


 |
市场调查报告书
商品编码
1936591
汽车变速箱市场机会、成长要素、产业趋势分析及预测(2026年至2035年)Automotive Transmission Market Opportunity, Growth Drivers, Industry Trend Analysis, and Forecast 2026 - 2035 |
||||||
全球汽车变速箱市场预计到 2025 年将达到 1,835 亿美元,到 2035 年将达到 3,115 亿美元,年复合成长率为 5.6%。
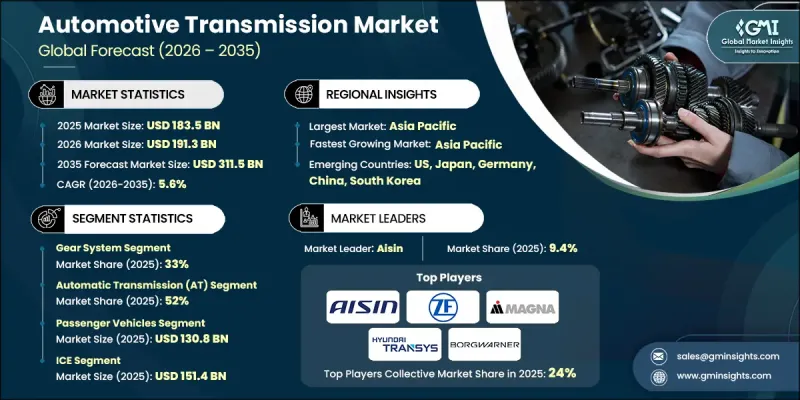
全球日益严格的燃油经济性和排放气体法规正在塑造市场成长,迫使汽车製造商采用先进的变速箱技术,在不牺牲驾驶舒适性的前提下提高燃油经济性。主要汽车市场的法规结构推动了变速箱檔位数量的增加、智慧换檔逻辑的改进以及与混合动力传动系统的兼容性,从而巩固了整车製造商(OEM)的研发策略和供应商的长期投资。同时,消费者偏好的转变正在加速手排变速箱的淘汰,因为驾驶者越来越倾向于平顺、便利和精緻的驾驶体验,尤其是在拥挤的城市环境中。自动变速箱、双离合器变速箱和无段变速箱在大众市场和豪华车型中正变得越来越普遍。电池式电动车( BEV)通常采用简化的动力传动系统,但不断增长的产量正在推动对变速箱组件、差速器和整合式电力驱动模组的需求。这种转变凸显了软体整合、热控制和噪音优化的重要性,在日益复杂的机械结构中提升了系统的价值。
| 市场覆盖范围 | |
|---|---|
| 开始年份 | 2025 |
| 预测年份 | 2026-2035 |
| 起始值 | 1835亿美元 |
| 预测金额 | 3115亿美元 |
| 复合年增长率 | 5.6% |
预计到2025年,齿轮系统市占率将达到33%,并在2035年之前以5.5%的复合年增长率成长。齿轮系统是任何传动系统架构的重要组成部分,也是传统汽车和电动车实现扭力转换、动力分配和效率优化的基础元件。齿轮设计、精密製造和降噪技术的不断改进,进一步巩固了齿轮系统在现代动力传动系统中的核心地位。
到2025年,自动变速箱将占据52%的市场份额,预计在2026年至2035年间将以6%的复合年增长率成长。先进的控制单元现在利用自适应逻辑,根据驾驶行为和运行状况优化换檔时机,从而实现更平顺的性能和更高的燃油效率。这些优势持续推动所有车型领域对手排变速箱的广泛替代品。
预计到2025年,中国汽车变速箱市场规模将达到351亿美元。作为全球最大的汽车生产基地,中国对自动变速箱、CVT变速箱和双离合器变速箱的需求持续强劲,同时,依赖先进减速和整合驱动技术的电动动力传动系统总成也实现了快速成长。
目录
第一章调查方法和范围
第二章执行摘要
第三章业界考察
- 生态系分析
- 供应商情况
- 系统平台提供者
- 硬体供应商
- 动力传动系统和软体整合合作伙伴
- 利基专家
- 最终用途
- 成本结构
- 利润率
- 每个阶段的附加价值
- 影响供应链的因素
- 颠覆者
- 供应商情况
- 影响因素
- 司机
- 严格的排放气体和燃油经济法规
- 对舒适性和性能的需求日益增长
- 对电池式电动车(BEV)的需求不断增长
- 新兴市场汽车拥有量不断成长
- 产业潜在风险与挑战
- 技术复杂性与成本压力
- 电动车的普及正在蚕食传统变速箱的市场份额。
- 市场机会
- 扩大电气化和混合动力输电系统
- 商用车和非公路用车辆电气化发展
- 软体定义和模组化运输平台
- 司机
- 成长潜力分析
- 监管环境
- 北美洲
- CAFE 标准
- 美国环保署温室气体排放标准
- 美墨加协定汽车原产地规则
- 加州空气资源委员会(CARB)先进清洁汽车和先进清洁卡车法规
- 欧洲
- 欧盟碳排放绩效标准
- 欧7排放气体法规
- 适用于 55 包装
- REACH 指令和报废车辆 (ELV) 指令
- 亚太地区
- 中国第六排放气体法规
- 中国新能源汽车强制政策
- BS-VI排放气体法规(印度)
- 日本燃油效率标准领导者
- 拉丁美洲
- PROCONVE(巴西排放标准)
- 阿根廷车辆排放气体法规
- 墨西哥NOM排放标准
- 中东和非洲
- 海湾合作委员会(GCC)燃油经济性与排放气体法规
- 南非汽车生产与发展计画(APDP)
- 国内电动车和产业本地化政策
- 北美洲
- 波特五力分析
- PESTEL 分析
- 科技与创新趋势
- 当前技术趋势
- 新兴技术
- 定价分析
- 副产品
- 按地区
- 成本細項分析
- 专利分析
- 生产统计
- 生产基地
- 消费基础
- 进出口
- 永续性和环境方面
- 永续实践
- 减少废弃物策略
- 生产中的能源效率
- 环保倡议
- 碳足迹考量
- 传动系统价格基准
- 总拥有成本 (TCO) 比较
- 製造和生产能力分析
- 客户和OEM厂商的购买行为
- 软体经济学与策略
第四章 竞争情势
- 介绍
- 公司市占率分析
- 北美洲
- 欧洲
- 亚太地区
- 拉丁美洲
- 中东和非洲
- 主要市场公司的竞争分析
- 竞争定位矩阵
- 战略展望矩阵
- 重大进展
- 併购
- 伙伴关係与合作
- 新产品发布
- 企业扩张计画和资金筹措
第五章 依输电方式分類的市场估计与预测,2022-2035年
- 手排变速箱(MT)
- 自动变速箱(AT)
- 无段变速箱(CVT)
- 双离合器变速箱(DCT)
- 自动手排变速箱(AMT)
第六章 按组件分類的市场估算与预测,2022-2035年
- 齿轮系统
- 离合器总成
- 液力变矩器
- 机电一体化与控制单元(TCU)
- 车轴和差速器系统
- 其他的
第七章 依车辆类型分類的市场估计与预测,2022-2035年
- 搭乘用车
- 掀背车
- 轿车
- SUV/跨界车
- 商用车辆
- 轻型商用车(LCV)
- 中型商用车(MCV)
- 重型商用车(HCV)
第八章 2022-2035年按推进方式分類的市场估算与预测
- 内燃机(ICE)
- 电动车
- 混合动力电动车(HEV)
- 插电式混合动力电动车(PHEV)
- 电池式电动车(BEV)
第九章 依销售管道分類的市场估计与预测,2022-2035年
- OEM
- 售后市场
第十章 2022-2035年各地区市场估计与预测
- 北美洲
- 我们
- 加拿大
- 欧洲
- 德国
- 英国
- 法国
- 义大利
- 西班牙
- 俄罗斯
- 北欧国家
- 比荷卢经济联盟
- 亚太地区
- 中国
- 印度
- 日本
- 澳洲
- 韩国
- 菲律宾
- 印尼
- 新加坡
- 拉丁美洲
- 巴西
- 墨西哥
- 阿根廷
- 智利
- 中东和非洲
- 南非
- 沙乌地阿拉伯
- 阿拉伯聯合大公国
第十一章 公司简介
- Global leaders
- ZF Friedrichshafen
- Aisin
- Magna International
- BorgWarner
- Schaeffler
- Hyundai Transys
- JATCO
- Allison Transmission
- Eaton
- GKN Automotive
- 本地製造商
- Punch Powertrain
- Dana
- AVL List
- Ricardo
- Nidec
- GETRAG
- Yutong Group Powertrain Division
- SAIC Transmission Systems
- AVTEC
- FEV
- 新兴企业
- Inovance Automotive
- Zhejiang Wanliyang Transmission
- Hofer Powertrain
- Xtrac
- Blue Nexus
The Global Automotive Transmission Market was valued at USD 183.5 billion in 2025 and is estimated to grow at a CAGR of 5.6% to reach USD 311.5 billion by 2035.
Market growth is shaped by increasingly stringent global efficiency and emission regulations, which are pushing automakers to adopt advanced transmission technologies that enhance fuel economy without compromising driving comfort. Regulatory frameworks across major automotive regions are encouraging higher gear counts, intelligent shift logic, and compatibility with hybrid powertrains, firmly anchoring OEM development strategies and long-term supplier investments. At the same time, changing consumer preferences are accelerating the transition away from manual transmissions, as drivers increasingly favor smooth, convenient, and refined driving experiences, especially in congested urban environments. Automatic, dual-clutch, and continuously variable transmissions are gaining traction across both mass-market and premium vehicles. While battery electric vehicles typically rely on simplified drivetrains, their rising volumes are generating strong demand for reduction gearsets, differentials, and integrated electric drive modules. This shift is increasing the importance of software integration, thermal control, and noise optimization, raising system value even as mechanical complexity evolves.
| Market Scope | |
|---|---|
| Start Year | 2025 |
| Forecast Year | 2026-2035 |
| Start Value | $183.5 Billion |
| Forecast Value | $311.5 Billion |
| CAGR | 5.6% |
The gear system segment held 33% share in 2025 and is expected to grow at a CAGR of 5.5% through 2035. Gear systems remain fundamental across all transmission architectures, supporting torque conversion, power distribution, and efficiency optimization in both conventional and electrified vehicles. Continuous improvements in gear design, precision manufacturing, and noise reduction are reinforcing their central role in modern drivetrains.
The automatic transmissions accounted for 52% share in 2025 and are forecast to grow at a CAGR of 6% from 2026 to 2035. Advanced control units now leverage adaptive logic to optimize shift timing based on driving behavior and operating conditions, delivering smoother performance and improved fuel efficiency. These benefits continue to drive widespread replacement of manual gearboxes across vehicle segments.
China Automotive Transmission Market reached USD 35.1 billion in 2025. As the world's largest vehicle manufacturing hub, the country continues to see strong demand for automatic, CVT, and dual-clutch systems, alongside rapid growth in electrified powertrains that rely on advanced reduction and integrated drive technologies.
Key players in the Global Automotive Transmission Market include ZF Friedrichshafen, Aisin, BorgWarner, Magna International, Allison Transmission, Schaeffler, JATCO, Eaton, GKN Automotive, and Hyundai Transys. Companies operating in the automotive transmission market are strengthening their competitive position by investing in next-generation transmission platforms that support electrification, hybridization, and improved efficiency. Strategic collaborations with automakers enable early integration of advanced systems into new vehicle architectures. Firms are prioritizing software-driven optimization, modular transmission designs, and lightweight materials to enhance performance and reduce costs. Expanding production capacity in high-growth regions, improving vertical integration, and focusing on reliability and durability are also key priorities. Additionally, manufacturers are advancing e-axle solutions and intelligent control technologies to align with long-term electrification trends and evolving regulatory requirements.
Table of Contents
Chapter 1 Methodology & Scope
- 1.1 Research approach
- 1.2 Quality Commitments
- 1.2.1 GMI AI policy & data integrity commitment
- 1.3 Research Trail & Confidence Scoring
- 1.3.1 Research Trail Components
- 1.3.2 Scoring Components
- 1.4 Data Collection
- 1.4.1 Partial list of primary sources
- 1.5 Data mining sources
- 1.5.1 Paid sources
- 1.6 Base estimates and calculations
- 1.6.1 Base year calculation for any one approach
- 1.7 Forecast model
- 1.8 Research transparency addendum
Chapter 2 Executive Summary
- 2.1 Industry 3600 synopsis, 2022-2035
- 2.2 Key market trends
- 2.2.1 Regional
- 2.2.2 Transmission
- 2.2.3 Component
- 2.2.4 Vehicle
- 2.2.5 Propulsion
- 2.2.6 Sales Channel
- 2.3 TAM Analysis, 2026-2035
- 2.4 CXO perspectives: Strategic imperatives
- 2.4.1 Key decision points for industry executives
- 2.4.2 Critical success factors for market players
- 2.5 Future outlook and strategic recommendations
Chapter 3 Industry Insights
- 3.1 Industry ecosystem analysis
- 3.1.1 Supplier landscape
- 3.1.1.1 System & platform providers
- 3.1.1.2 Hardware suppliers
- 3.1.1.3 Powertrain & software integration partners
- 3.1.1.4 Niche specialists
- 3.1.1.5 End use
- 3.1.2 Cost structure
- 3.1.3 Profit margin
- 3.1.4 Value addition at each stage
- 3.1.5 Factors impacting the supply chain
- 3.1.6 Disruptors
- 3.1.1 Supplier landscape
- 3.2 Impact on forces
- 3.2.1 Growth drivers
- 3.2.1.1 Stringent emission & fuel economy regulations
- 3.2.1.2 Rising demand for comfort & performance
- 3.2.1.3 Increasing demand in battery electric vehicles (BEVs)
- 3.2.1.4 Rising vehicle ownership across emerging markets
- 3.2.2 Industry pitfalls & challenges
- 3.2.2.1 Technological complexity & cost pressure
- 3.2.2.2 Ev transition cannibalizing traditional transmissions
- 3.2.3 Market opportunities
- 3.2.3.1 Expansion of electrified and hybrid transmission systems
- 3.2.3.2 Growth in commercial and off-highway electrification
- 3.2.3.3 Software-defined and modular transmission platforms
- 3.2.1 Growth drivers
- 3.3 Growth potential analysis
- 3.4 Regulatory landscape
- 3.4.1 North America
- 3.4.1.1 CAFE Standards
- 3.4.1.2 EPA Greenhouse Gas (GHG) Emission Standards
- 3.4.1.3 USMCA Automotive Rules of Origin
- 3.4.1.4 CARB Advanced Clean Cars & Advanced Clean Trucks Regulations
- 3.4.2 Europe
- 3.4.2.1 EU CO2 Emission Performance Standards
- 3.4.2.2 Euro 7 Emission Regulations
- 3.4.2.3 Fit for 55 Package
- 3.4.2.4 REACH & End-of-Life Vehicle (ELV) Directives
- 3.4.3 Asia Pacific
- 3.4.3.1 China VI Emission Standards
- 3.4.3.2 NEV (New Energy Vehicle) Mandate - China
- 3.4.3.3 BS-VI Emission Norms (India)
- 3.4.3.4 Japan Top Runner Fuel Economy Program
- 3.4.4 Latin America
- 3.4.4.1 PROCONVE (Brazil Emission Standards)
- 3.4.4.2 Argentina Vehicle Emission Regulations
- 3.4.4.3 Mexico NOM Emission Standards
- 3.4.5 Middle East & Africa
- 3.4.5.1 GCC Fuel Economy and Emission Regulations
- 3.4.5.2 South Africa Automotive Production and Development Programme (APDP)
- 3.4.5.3 National EV & Industrial Localization Policies
- 3.4.1 North America
- 3.5 Porter's analysis
- 3.6 PESTEL analysis
- 3.7 Technology and innovation landscape
- 3.7.1 Current technological trends
- 3.7.2 Emerging technologies
- 3.8 Pricing analysis
- 3.8.1 By product
- 3.8.2 By region
- 3.9 Cost breakdown analysis
- 3.10 Patent analysis
- 3.11 Production statistics
- 3.11.1 Production hubs
- 3.11.2 Consumption hubs
- 3.11.3 Export and import
- 3.12 Sustainability and environmental aspects
- 3.12.1 Sustainable practices
- 3.12.2 Waste reduction strategies
- 3.12.3 Energy efficiency in production
- 3.12.4 Eco-friendly initiatives
- 3.12.5 Carbon footprint considerations
- 3.13 Transmission system pricing benchmarks
- 3.14 Total Cost of Ownership (TCO) comparison
- 3.15 Manufacturing & capacity analysis
- 3.16 Customer & OEM buying behavior
- 3.17 Software economics & strategy
Chapter 4 Competitive Landscape, 2025
- 4.1 Introduction
- 4.2 Company market share analysis
- 4.2.1 North America
- 4.2.2 Europe
- 4.2.3 Asia Pacific
- 4.2.4 LATAM
- 4.2.5 MEA
- 4.3 Competitive analysis of major market players
- 4.4 Competitive positioning matrix
- 4.5 Strategic outlook matrix
- 4.6 Key developments
- 4.6.1 Mergers & acquisitions
- 4.6.2 Partnerships & collaborations
- 4.6.3 New product launches
- 4.6.4 Expansion plans and funding
Chapter 5 Market Estimates & Forecast, By Transmission, 2022 - 2035 ($Bn, Units)
- 5.1 Key trends
- 5.2 Manual transmission (MT)
- 5.3 Automatic transmission (AT)
- 5.4 Continuously variable transmission (CVT)
- 5.5 Dual-clutch transmission (DCT)
- 5.6 Automated manual transmission (AMT)
Chapter 6 Market Estimates & Forecast, By Component, 2022 - 2035 ($Bn, Units)
- 6.1 Key trends
- 6.2 Gear systems
- 6.3 Clutch assemblies
- 6.4 Torque converters
- 6.5 Mechatronics & control units (TCU)
- 6.6 Axle & differential systems
- 6.7 Others
Chapter 7 Market Estimates & Forecast, By Vehicle, 2022 - 2035 ($Bn, Units)
- 7.1 Key trends
- 7.2 Passenger vehicles
- 7.2.1 Hatchback
- 7.2.2 Sedan
- 7.2.3 SUV / Crossover
- 7.3 Commercial vehicles
- 7.3.1 Light commercial vehicles (LCV)
- 7.3.2 Medium commercial vehicles (MCV)
- 7.3.3 Heavy commercial vehicles (HCV)
Chapter 8 Market Estimates & Forecast, By Propulsion, 2022 - 2035 ($Bn, Units)
- 8.1 Key trends
- 8.2 Internal combustion engine (ICE)
- 8.3 Electric Vehicles
- 8.3.1 Hybrid electric vehicles (HEV)
- 8.3.2 Plug-in hybrid electric vehicles (PHEV)
- 8.3.3 Battery electric vehicles (BEV)
Chapter 9 Market Estimates & Forecast, By Sales Channel, 2022 - 2035 ($Bn, Units)
- 9.1 Key trends
- 9.2 OEM
- 9.3 Aftermarket
Chapter 10 Market Estimates & Forecast, By Region, 2022 - 2035 ($Bn, Units)
- 10.1 Key trends
- 10.2 North America
- 10.2.1 US
- 10.2.2 Canada
- 10.3 Europe
- 10.3.1 Germany
- 10.3.2 UK
- 10.3.3 France
- 10.3.4 Italy
- 10.3.5 Spain
- 10.3.6 Russia
- 10.3.7 Nordics
- 10.3.8 Benelux
- 10.4 Asia Pacific
- 10.4.1 China
- 10.4.2 India
- 10.4.3 Japan
- 10.4.4 Australia
- 10.4.5 South Korea
- 10.4.6 Philippines
- 10.4.7 Indonesia
- 10.4.8 Singapore
- 10.5 Latin America
- 10.5.1 Brazil
- 10.5.2 Mexico
- 10.5.3 Argentina
- 10.5.4 Chile
- 10.6 MEA
- 10.6.1 South Africa
- 10.6.2 Saudi Arabia
- 10.6.3 UAE
Chapter 11 Company Profiles
- 11.1 Global leaders
- 11.1.1 ZF Friedrichshafen
- 11.1.2 Aisin
- 11.1.3 Magna International
- 11.1.4 BorgWarner
- 11.1.5 Schaeffler
- 11.1.6 Hyundai Transys
- 11.1.7 JATCO
- 11.1.8 Allison Transmission
- 11.1.9 Eaton
- 11.1.10 GKN Automotive
- 11.2 Regional players
- 11.2.1 Punch Powertrain
- 11.2.2 Dana
- 11.2.3 AVL List
- 11.2.4 Ricardo
- 11.2.5 Nidec
- 11.2.6 GETRAG
- 11.2.7 Yutong Group Powertrain Division
- 11.2.8 SAIC Transmission Systems
- 11.2.9 AVTEC
- 11.2.10 FEV
- 11.3 Emerging players
- 11.3.1 Inovance Automotive
- 11.3.2 Zhejiang Wanliyang Transmission
- 11.3.3 Hofer Powertrain
- 11.3.4 Xtrac
- 11.3.5 Blue Nexus
 2026年全球汽车变速箱工程服务外包市场报告
 汽车自动变速箱:市场份额分析、行业趋势和统计数据、成长预测(2026-2031)
 全球自动变速箱市场规模、份额、趋势和成长分析报告(2026-2034年)汽车变速箱市场规模、份额、成长率和全球产业分析:按类型、应用和地区划分 - 洞察与预测(2026-2034 年)
 中重型商用车变速箱市场-全球产业规模、份额、趋势、机会及预测(按类型、燃料类型、齿轮类型、地区和竞争格局划分,2021-2031年)汽车变速箱工程服务外包市场-全球产业规模、份额、趋势、机会及预测(按变速箱类型、动力传动系统类型、服务、地区和竞争格局划分,2021-2031)
 变速箱再製造市场:按变速箱类型、车辆类型、工艺类型和分销管道划分,全球预测,2026-2032年变速箱同步器用黄铜环市场按类型、分销管道、车辆类型和最终用途行业划分-2026年至2032年全球预测
 汽车自动变速箱市场规模、份额和成长分析(按变速箱类型、车辆类型、驱动系统和地区划分)-2026-2033年产业预测汽车自排变速箱市场-全球产业规模、份额、趋势、机会及预测。依车辆类型、燃料类型、类型、地区和竞争格局划分(2021-2031年预测)