


 |
市场调查报告书
商品编码
1936617
永续製造设备市场机会、成长要素、产业趋势分析及预测(2026年至2035年)Sustainable Manufacturing Equipment Market Opportunity, Growth Drivers, Industry Trend Analysis, and Forecast 2026 - 2035 |
||||||
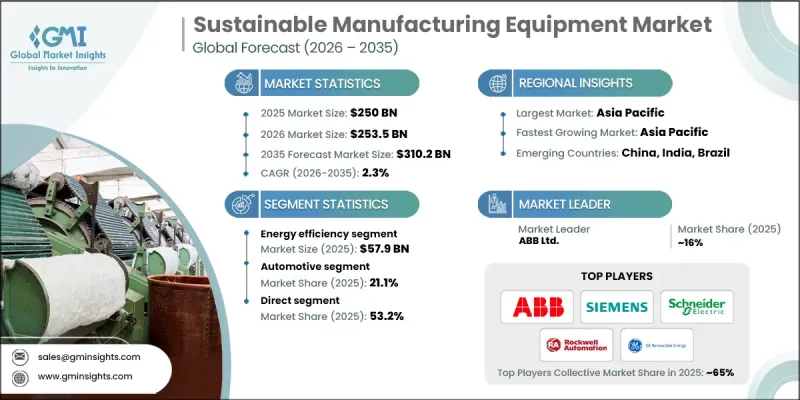
全球永续製造设备市场预计到 2025 年将达到 2,500 亿美元,到 2035 年将达到 3,102 亿美元,年复合成长率为 2.3%。
循环经济原则在各工业领域的应用正在影响市场成长。製造商日益注重提高资源利用效率、减少材料废弃物并延长产品生命週期,这直接增加了对支援这些目标的先进设备的需求。永续製造使企业能够透过基于再利用和回收的生产模式,在提高成本效益的同时降低对原材料的依赖。这种转变不仅受环境因素驱动,也受到经济诱因的推动,因为企业寻求从再生材料流中获得长期收益和新的商机。同时,世界各地的公共部门法规正在加速绿色製造实践的采用。各国政府透过支持性政策框架和金融机制鼓励这项转型,进而减轻绿色技术相关的投资负担。这些措施正促使製造商对其生产基础设施进行现代化改造,并将永续性作为核心营运目标。随着环境合规性、效率和盈利之间的关联日益密切,永续製造作为一项策略性投资,在全球各行业中持续获得关注。
| 市场覆盖范围 | |
|---|---|
| 开始年份 | 2025 |
| 预测年份 | 2026-2035 |
| 起始值 | 2500亿美元 |
| 预测金额 | 3102亿美元 |
| 复合年增长率 | 2.3% |
预计到2025年,能源效率领域的市场规模将达到5,79亿美元,并在2026年至2035年间以1.2%的复合年增长率成长。节能设备因其在多个行业的适用性、即时节省营运成本以及符合排放目标而保持较高的普及率。各公司正积极升级其机械设备,以降低能耗和营运成本,同时提升整体性能。
截至2024年,直销通路占了53.2%的市占率。直销模式使设备製造商能够绕过仲介业者,直接与终端用户交易,从而更清晰地传达永续性优势,例如减少排放、提高效率和可回收性,同时加强与客户的长期关係。
美国永续製造设备市场预计到2025年将达到4,48亿美元,到2035年将以1.6%的复合年增长率成长。强大的工业基础、先进的创新能力以及促进绿色生产的政策倡议支撑了这一市场主导地位。美国製造商积极采用者永续设备,以使其营运符合监管要求和企业永续性目标。
目录
第一章调查方法和范围
第二章执行摘要
第三章业界考察
- 生态系分析
- 供应商情况
- 利润率
- 每个阶段的附加价值
- 影响价值链的因素
- 产业影响因素
- 司机
- 企业为实现净零排放所做的努力
- 采纳循环经济原则
- 政府法规和激励措施
- 挑战与困难
- 高昂的初始投资成本
- 监理合规的复杂性
- 机会
- 节能低排放设备的需求日益增长
- 整合循环经济原则
- 司机
- 成长潜力分析
- 未来市场趋势
- 科技与创新趋势
- 当前技术趋势
- 新兴技术
- 价格趋势
- 按地区
- 副产品
- 监管环境
- 北美洲
- 美国:消费品安全委员会 (CPSC) 联邦法规第 16 篇 (CFR) 第 1512 部分
- 加拿大:国际标准化组织(ISO)4210
- 欧洲
- 德国:德国标准化协会 (DIN) 欧洲标准 (EN) ISO 4210
- 英国:欧洲标准 (EN) ISO 4210/英国合格评定 (UKCA)
- 法国:欧洲标准 (EN) ISO 4210
- 亚太地区
- 中国:国家标誌(GB)3565
- 印度:印度标准 (IS) 10613
- 日本:日本工业标准(JIS)D 9110
- 拉丁美洲
- 巴西:巴西技术标准协会 (ABNT) 巴西标准 (NBR) ISO 4210
- 墨西哥:国际标准化组织(ISO)4210
- 中东和非洲
- 南非:南非国家标准 (SANS) 311
- 沙乌地阿拉伯:沙乌地阿拉伯标准、计量和品质组织 (SASO) 海湾标准组织 (GSO) ISO 4210
- 北美洲
- 贸易统计
- 主要进口国
- 主要出口国
- 波特五力分析
- PESTEL 分析
第四章 竞争情势
- 介绍
- 公司市占率分析
- 按地区
- 北美洲
- 欧洲
- 亚太地区
- 拉丁美洲
- 中东和非洲
- 按地区
- 企业矩阵分析
- 主要市场公司的竞争分析
- 竞争定位矩阵
- 重大进展
- 併购
- 伙伴关係与合作
- 新产品发布
- 扩张计划
第五章 依设备类型分類的市场估算与预测,2022-2035年
- 节能机器
- 废弃物管理设施
- 水和污水处理设施
- 碳排放控制系统
- 可再生能源综合设施
- 智慧製造和监控设备
- 永续包装设备
- 积层製造设备
- 其他(材料回收系统等)
第六章 依最终用户产业分類的市场估算与预测,2022-2035年
- 车
- 电子和半导体
- 食品/饮料
- 化学製造业
- 製药
- 金属和采矿
- 消费品
- 其他(纺织製造业等)
7. 依最终用途分類的市场估计与预测,2022-2035 年
- 大公司
- 中小企业
- 政府和研究机构
- 永续製造Start-Ups
第八章 按分销管道分類的市场估算与预测,2022-2035年
- 直销
- 间接
第九章 2022-2035年各地区市场估算与预测
- 北美洲
- 我们
- 加拿大
- 欧洲
- 德国
- 英国
- 法国
- 义大利
- 西班牙
- 亚太地区
- 中国
- 印度
- 日本
- 韩国
- 澳洲
- 拉丁美洲
- 巴西
- 墨西哥
- 阿根廷
- 中东和非洲
- 沙乌地阿拉伯
- 阿拉伯聯合大公国
- 南非
第十章:公司简介
- 3D Systems Corporation
- ABB Ltd.
- Atlas Copco AB
- Bosch Rexroth AG
- Emerson Electric Co.
- FANUC Corporation
- General Electric(GE)Company
- Honeywell International Inc.
- Mitsubishi Electric Corporation
- Rockwell Automation, Inc.
- Schneider Electric SE
- Siemens AG
- Tetra Pak International SA
- Veolia Environment SA
- Yaskawa Electric Corporation
The Global Sustainable Manufacturing Equipment Market was valued at USD 250 billion in 2025 and is estimated to grow at a CAGR of 2.3% to reach USD 310.2 billion by 2035.
The rising adoption of circular economy principles across industrial sectors influences market growth. Manufacturers are increasingly focused on improving resource efficiency, reducing material waste, and extending product life cycles, which directly increases demand for advanced equipment designed to support these goals. Sustainable manufacturing equipment enables companies to lower raw material dependency while improving cost efficiency through reuse and recycling-driven production models. This shift is not only environmentally driven but also financially motivated, as organizations seek long-term savings and new revenue opportunities from secondary material streams. At the same time, public-sector regulations worldwide are accelerating the adoption of environmentally responsible manufacturing practices. Governments are encouraging the transition through supportive policy frameworks and financial mechanisms that ease the investment burden associated with greener technologies. These measures are pushing manufacturers to modernize production infrastructure and prioritize sustainability as a core operational objective. As environmental compliance, efficiency, and profitability become increasingly interconnected, sustainable manufacturing equipment continues to gain traction as a strategic investment across global industries.
| Market Scope | |
|---|---|
| Start Year | 2025 |
| Forecast Year | 2026-2035 |
| Start Value | $250 Billion |
| Forecast Value | $310.2 Billion |
| CAGR | 2.3% |
The energy efficiency segment generated USD 57.9 billion in 2025 and is expected to grow at a CAGR of 1.2% from 2026 to 2035. Energy-efficient equipment maintains strong adoption due to its applicability across multiple industries, immediate operational savings, and alignment with emissions reduction targets. Companies are actively upgrading machinery to reduce energy consumption and operating expenses while improving overall performance.
The direct segment held 53.2% share in 2024. Direct sales models allow equipment manufacturers to engage end users without intermediaries, enabling clearer communication of sustainability benefits such as lower emissions, improved efficiency, and recyclability while strengthening long-term customer relationships.
U.S. Sustainable Manufacturing Equipment Market reached USD 44.8 billion in 2025 and is projected to grow at a CAGR of 1.6% through 2035. Market leadership is supported by a strong industrial foundation, advanced innovation capabilities, and policy-driven encouragement of environmentally responsible production. U.S.-based manufacturers are early adopters of sustainable equipment as they align operations with regulatory expectations and corporate sustainability objectives.
Major companies operating in the Global Sustainable Manufacturing Equipment Market include Siemens AG, Schneider Electric SE, ABB Ltd., Rockwell Automation, Inc., Mitsubishi Electric Corporation, Honeywell International Inc., Emerson Electric Co., Atlas Copco AB, FANUC Corporation, Bosch Rexroth AG, Yaskawa Electric Corporation, General Electric Company, Tetra Pak International S.A., Veolia Environment S.A., and 3D Systems Corporation. Companies in the Sustainable Manufacturing Equipment Market are reinforcing their competitive position through continuous technology innovation and sustainability-focused product development. Many players are investing in automation, digital monitoring, and energy-optimized system designs to improve efficiency and reduce lifecycle costs. Strategic partnerships with industrial clients help tailor equipment to sector-specific sustainability goals. Firms are expanding global manufacturing and service networks to support faster deployment and localized compliance requirements.
Table of Contents
Chapter 1 Methodology & Scope
- 1.1 Market scope & definitions
- 1.2 Research design
- 1.2.1 Research approach
- 1.2.2 Data collection methods
- 1.3 Base estimates and calculations
- 1.3.1 Base year calculation
- 1.3.2 Market estimates & forecasts parameters
- 1.4 Forecast Model
- 1.4.1 Key trends for market estimates
- 1.4.2 Quantified market impact analysis
- 1.4.2.1 Mathematical impact of growth parameters on forecast
- 1.4.3 Scenario analysis framework
- 1.5 Primary research and validation
- 1.5.1 Some of the primary sources (but not limited to)
- 1.6 Data mining sources
- 1.6.1 Paid Sources
- 1.7 Primary research and validation
- 1.7.1 Primary sources
- 1.8 Research Trail & confidence scoring
- 1.8.1 Research trail components
- 1.8.2 Scoring components
- 1.9 Research transparency addendum
- 1.9.1 Source attribution framework
- 1.9.2 Quality assurance metrics
- 1.9.3 Our commitment to trust
- 1.10 Market Definitions
Chapter 2 Executive Summary
- 2.1 Industry 360° synopsis
- 2.2 Key market trends
- 2.2.1 Regional
- 2.2.2 Product Type
- 2.2.3 Automation
- 2.2.4 Application
- 2.2.5 Distribution channel
- 2.3 CXO perspectives: Strategic imperatives
- 2.3.1 Key decision points for industry executives
- 2.3.2 Critical success factors for market players
- 2.4 Future outlook and strategic recommendations
Chapter 3 Industry Insights
- 3.1 Industry ecosystem analysis
- 3.1.1 Supplier landscape
- 3.1.2 Profit margin
- 3.1.3 Value addition at each stage
- 3.1.4 Factor affecting the value chain
- 3.2 Industry impact forces
- 3.2.1 Growth drivers
- 3.2.1.1 Corporate commitments to net-zero emissions
- 3.2.1.2 Adoption of circular economy principles
- 3.2.1.3 Government regulations and incentives
- 3.2.2 Pitfalls & Challenges
- 3.2.2.1 High initial investment costs
- 3.2.2.2 Complexity of regulatory compliance
- 3.2.3 Opportunities
- 3.2.3.1 Growing demand for energy-efficient and low-emission equipment
- 3.2.3.2 Integration of circular economy principles
- 3.2.1 Growth drivers
- 3.3 Growth potential analysis
- 3.4 Future market trends
- 3.5 Technology and innovation landscape
- 3.5.1 Current technological trends
- 3.5.2 Emerging technologies
- 3.6 Price trends
- 3.6.1 By region
- 3.6.2 By product
- 3.7 Regulatory landscape
- 3.7.1 North America
- 3.7.1.1 US: Consumer Product Safety Commission (CPSC) 16 Code of Federal Regulations (CFR) part 1512
- 3.7.1.2 Canada: International Organization for Standardization (ISO) 4210
- 3.7.2 Europe
- 3.7.2.1 Germany: Deutsches Institut fur Normung (DIN) European Norm (EN) ISO 4210
- 3.7.2.2 UK: European Norm (EN) ISO 4210 / United Kingdom Conformity Assessed (UKCA)
- 3.7.2.3 France: European Norm (EN) ISO 4210
- 3.7.3 Asia Pacific
- 3.7.3.1 China: Guobiao (GB) 3565
- 3.7.3.2 India: Indian Standard (IS) 10613
- 3.7.3.3 Japan: Japanese Industrial Standard (JIS) D 9110
- 3.7.4 Latin America
- 3.7.4.1 Brazil: Associacao Brasileira de Normas Tecnicas (ABNT) Norma Brasileira (NBR) ISO 4210
- 3.7.4.2 Mexico: International Organization for Standardization (ISO) 4210
- 3.7.5 Middle East & Africa
- 3.7.5.1 South Africa: South African National Standard (SANS) 311
- 3.7.5.2 Saudi Arabia: Saudi Standards, Metrology and Quality Organization (SASO) Gulf Standardization Organization (GSO) ISO 4210
- 3.7.1 North America
- 3.8 Trade statistics
- 3.8.1 Major importing countries
- 3.8.2 Major exporting countries
- 3.9 Porter's analysis
- 3.10 PESTEL analysis
Chapter 4 Competitive Landscape, 2025
- 4.1 Introduction
- 4.2 Company market share analysis
- 4.2.1 By Region
- 4.2.1.1 North America
- 4.2.1.2 Europe
- 4.2.1.3 Asia Pacific
- 4.2.1.4 Latin America
- 4.2.1.5 Middle East & Africa
- 4.2.1 By Region
- 4.3 Company matrix analysis
- 4.4 Competitive analysis of major market players
- 4.5 Competitive positioning matrix
- 4.6 Key developments
- 4.6.1 Mergers & acquisitions
- 4.6.2 Partnerships & collaborations
- 4.6.3 New product launches
- 4.6.4 Expansion plans
Chapter 5 Market Estimates & Forecast, By Equipment Type, 2022 - 2035, (USD Billion) (Thousand Units)
- 5.1 Key trends
- 5.2 Energy-efficient machinery
- 5.3 Waste management equipment
- 5.4 Water & wastewater treatment equipment
- 5.5 Carbon emission control systems
- 5.6 Renewable energy integration equipment
- 5.7 Smart manufacturing & monitoring equipment
- 5.8 Sustainable packaging equipment
- 5.9 Additive manufacturing equipment
- 5.10 Others (material recovery systems, etc.)
Chapter 6 Market Estimates & Forecast, By End User Industry, 2022 - 2035, (USD Billion) (Thousand Units)
- 6.1 Key trends
- 6.2 Automotive
- 6.3 Electronics and semiconductors
- 6.4 Food and beverages
- 6.5 Chemical manufacturing
- 6.6 Pharmaceuticals
- 6.7 Metals and mining
- 6.8 Consumer goods
- 6.9 Others (textile manufacturing, etc.)
Chapter 7 Market Estimates & Forecast, By End Use, 2022 - 2035, (USD Billion) (Thousand Units)
- 7.1 Key trends
- 7.2 Large enterprises
- 7.3 Small & medium enterprises (SMEs)
- 7.4 Government & research institutes
- 7.5 Sustainable manufacturing startups
Chapter 8 Market Estimates & Forecast, By Distribution Channel, 2022 - 2035, (USD Billion) (Thousand Units)
- 8.1 Key trends
- 8.2 Direct
- 8.3 Indirect
Chapter 9 Market Estimates & Forecast, By Region, 2022 - 2035, (USD Billion) (Thousand Units)
- 9.1 Key trends
- 9.2 North America
- 9.2.1 U.S.
- 9.2.2 Canada
- 9.3 Europe
- 9.3.1 Germany
- 9.3.2 UK
- 9.3.3 France
- 9.3.4 Italy
- 9.3.5 Spain
- 9.4 Asia Pacific
- 9.4.1 China
- 9.4.2 India
- 9.4.3 Japan
- 9.4.4 South Korea
- 9.4.5 Australia
- 9.5 Latin America
- 9.5.1 Brazil
- 9.5.2 Mexico
- 9.5.3 Argentina
- 9.6 MEA
- 9.6.1 Saudi Arabia
- 9.6.2 UAE
- 9.6.3 South Africa
Chapter 10 Company Profiles
- 10.1 3D Systems Corporation
- 10.2 ABB Ltd.
- 10.3 Atlas Copco AB
- 10.4 Bosch Rexroth AG
- 10.5 Emerson Electric Co.
- 10.6 FANUC Corporation
- 10.7 General Electric (GE) Company
- 10.8 Honeywell International Inc.
- 10.9 Mitsubishi Electric Corporation
- 10.10 Rockwell Automation, Inc.
- 10.11 Schneider Electric SE
- 10.12 Siemens AG
- 10.13 Tetra Pak International S.A.
- 10.14 Veolia Environment S.A.
- 10.15 Yaskawa Electric Corporation
 混凝土管材和砌块製造市场:2026-2032年全球市场预测(按产品类型、应用、最终用户、製造流程和尺寸划分)
 製造业资讯通信技术市场-全球产业规模、份额、趋势、机会和预测:按组件、应用、部署类型、地区和竞争对手划分,2021-2031年
 「工业製造业预测」市场数据概况(2025 年第四季)工业与製造业市场预测工业与製造业调查:机器人技术(2024财年下半年/2025财年上半年)
 全球精密金属车床加工市场
 按行业、技术和地区分類的全球製造业市场
 金属精密车削产品製造:市场占有率分析、产业趋势与统计、成长预测(2025-2030 年)
 製造业研究回顾:2024 年金属精密车削产品製造市场 - 全球产业规模、份额、趋势、机会和预测,按营运、机器类型、最终用途、地区和竞争细分,2020-2030F