


 |
市场调查报告书
商品编码
1936627
突波保护器市场机会、成长要素、产业趋势分析及2026年至2035年预测Surge Protection Devices Market Opportunity, Growth Drivers, Industry Trend Analysis, and Forecast 2026 - 2035 |
||||||
全球突波保护器市场预计到 2025 年将达到 39 亿美元,到 2035 年将达到 76 亿美元,年复合成长率为 7.1%。
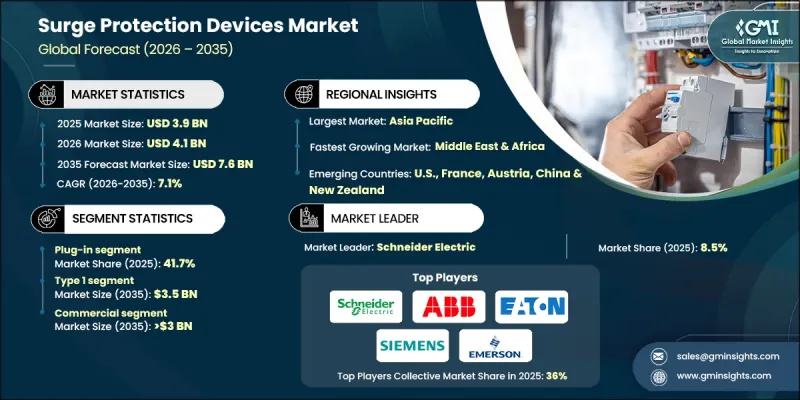
市场扩张的驱动力来自人们对设备可靠性的日益关注、敏感电子设备使用量的增加以及智慧建筑技术的日益普及。随着各组织将营运安全和运作置于优先地位,对电能品质解决方案的需求也随之飙升。突波保护器旨在保护电力系统免受雷击、突波和开关操作引起的瞬态过电压的影响,在现代配电网路中至关重要。电网现代化计画、可再生能源併网以及不断扩展的电动车充电基础设施正在推动市场发展。此外,对超大规模资料中心的投资、严格的合规标准以及频繁发生的极端天气事件也在促进产业成长。太阳能光电系统、电池储能装置以及UL/IEC认证突波保护器市场的普及进一步支撑了全球市场的扩张。
| 市场覆盖范围 | |
|---|---|
| 开始年份 | 2025 |
| 预测年份 | 2026-2035 |
| 起始值 | 39亿美元 |
| 预测金额 | 76亿美元 |
| 复合年增长率 | 7.1% |
到2025年,插电式突波保护器市场占有率将达到41.7%。其成长主要得益于家用电器的普及和人们对终端用电保护意识的提升。此外,市场对经济实惠的模组化插电式浪涌保护器的需求,以及将其整合到智慧家庭解决方案、住宅和小规模办公室的需求,也推动了市场的发展。
预计到2025年,1型突波保护器将占据47.8%的市场份额,到2035年市场规模将达到35亿美元。入户线安装量的增加、对防雷保护的日益重视以及公用事业规模计划和公共产业设施的广泛应用,都推动了这一增长。旧电网基础设施的现代化改造也进一步刺激了高能量突波保护器的需求。
预计到2025年,美国突波保护器市场将占据66.8%的市场份额,市场规模达5.275亿美元。电力系统现代化、智慧电网计划投资以及住宅和商业建筑中敏感电子设备使用量的增加是推动市场成长的主要因素。此外,资料中心和云端运算产业的持续扩张也进一步推动了突波保护器的应用,以确保系统可靠运作。
目录
第一章调查方法和范围
第二章执行摘要
第三章业界考察
- 生态系分析
- 原物料供应及采购分析
- 製造能力评估
- 供应链韧性与风险因素
- 配电网路分析
- 监管环境
- 产业影响因素
- 司机
- 产业潜在风险与挑战
- 成长潜力分析
- 波特五力分析
- PESTEL 分析
- 突波保护装置的成本结构分析
- 价格趋势分析
- 副产品
- 按地区
- 新的机会与趋势
- 数位化和物联网集成
第四章 竞争情势
- 介绍
- 按地区分類的公司市占率分析
- 北美洲
- 欧洲
- 亚太地区
- 中东和非洲
- 拉丁美洲
- 战略仪錶板
- Key partnerships &collaborations
- Major M&A activities
- Product innovations &launches
- Market expansion strategies
- 策略倡议
- 竞争标竿分析
- 创新与科技趋势
第五章 2022-2035年依产品分類的市场规模及预测
- 硬布线
- 外挂
- 电源线
- 电源控制设备
第六章 依技术分類的市场规模及预测(2022-2035年)
- 1型
- 类型 2
- 3型
第七章 依功率等级分類的市场规模及预测,2022-2035年
- ≤50 kA
- 超过 50kA 至 100kA
- 超过10万至15万
- 超过15万
第八章 依应用领域分類的市场规模及预测(2022-2035年)
- 住宅
- 商业的
- 工业的
第九章 2022-2035年各地区市场规模及预测
- 北美洲
- 我们
- 加拿大
- 墨西哥
- 欧洲
- 德国
- 法国
- 俄罗斯
- 英国
- 义大利
- 西班牙
- 荷兰
- 奥地利
- 亚太地区
- 中国
- 日本
- 韩国
- 印度
- 澳洲
- 纽西兰
- 马来西亚
- 印尼
- 中东和非洲
- 沙乌地阿拉伯
- 阿拉伯聯合大公国
- 卡达
- 埃及
- 南非
- 奈及利亚
- 拉丁美洲
- 巴西
- 阿根廷
第十章:公司简介
- ABB
- Belkin
- Bourns
- Eaton
- Emerson Electric
- GE Vernova
- Havells India
- Hubbell
- Infineon Technologies
- JMV
- Legrand
- Leviton Manufacturing
- Littelfuse
- Maxivolt
- Mersen
- Philips
- Phoenix Contact
- Raycap
- Rockwell Automation
- Schneider Electric
- Siemens
The Global Surge Protection Devices Market was valued at USD 3.9 billion in 2025 and is estimated to grow at a CAGR of 7.1% to reach USD 7.6 billion by 2035.
The market expansion is driven by rising concerns over equipment reliability, the increasing use of sensitive electronics, and the growing integration of smart building technologies. Demand for power quality solutions is escalating as organizations prioritize operational safety and uptime. Surge protection devices, designed to safeguard electrical systems from transient overvoltages caused by lightning, power surges, or switching operations, are critical in modern power distribution networks. Grid modernization initiatives, renewable energy integration, and the expansion of electric vehicle charging infrastructure are bolstering the market. Additionally, hyperscale data center investments, stricter compliance standards, and the increasing frequency of extreme weather events are reinforcing industry growth. Adoption of solar PV systems, battery storage installations, and UL/IEC-certified Surge Protection Devices Market further supports market expansion globally.
| Market Scope | |
|---|---|
| Start Year | 2025 |
| Forecast Year | 2026-2035 |
| Start Value | $3.9 Billion |
| Forecast Value | $7.6 Billion |
| CAGR | 7.1% |
The plug-in surge protection device segment held 41.7% share in 2025. Its growth is fueled by the increasing penetration of consumer electronics and rising awareness of point-of-use protection. Residential and small office deployments, coupled with demand for cost-effective and modular plug-in designs integrated into smart home solutions, are driving market adoption.
Type 1 SPDs accounted for 47.8% share in 2025 and are projected to reach USD 3.5 billion by 2035. Increasing installations at service entrances, emphasis on lightning protection, and adoption in utility-scale projects and industrial facilities are supporting growth. Modernization of aging grid infrastructure is further driving the demand for high-energy surge-handling devices.
U.S. Surge Protection Devices Market held a 66.8% share in 2025, generating USD 527.5 million. Growth is driven by grid modernization, smart grid project investments, and the rising use of sensitive electronics in residential and commercial buildings. The expanding data center and cloud computing sectors are fueling further adoption of SPDs to ensure reliable operations.
Leading companies in the Global Surge Protection Devices Market include ABB, Belkin, Bourns, Eaton, Emerson Electric, GE Vernova, Havells India, Hubbell, Infineon Technologies, JMV, Legrand, Leviton Manufacturing, Littelfuse, Maxivolt, Mersen, Philips, Phoenix Contact, Raycap, Rockwell Automation, Schneider Electric, and Siemens. Key strategies adopted by companies in the surge protection devices market include investing in research and development to enhance product reliability, efficiency, and energy compliance. Firms are expanding globally to target emerging markets and forming strategic partnerships with utilities, data center operators, and smart building integrators. Emphasis on modular and plug-in product designs facilitates residential and commercial adoption, while achieving UL and IEC certifications strengthens trust and regulatory compliance. Companies are also focusing on retrofitting aging electrical infrastructure, offering predictive maintenance solutions, and integrating IoT-enabled SPDs to differentiate their portfolio, increase market share, and solidify long-term footholds in the competitive industry.
Table of Contents
Chapter 1 Methodology & Scope
- 1.1 Research approach
- 1.2 Quality commitments
- 1.2.1 GMI AI policy & data integrity commitment
- 1.2.1.1 Source consistency protocol
- 1.2.1 GMI AI policy & data integrity commitment
- 1.3 Research trail & confidence scoring
- 1.3.1 Research trail components
- 1.3.2 Scoring components
- 1.4 Data collection
- 1.4.1 Partial list of primary sources
- 1.5 Data mining sources
- 1.5.1 Paid sources
- 1.5.1.1 Sources, by region
- 1.5.1 Paid sources
- 1.6 Base estimates and calculations
- 1.6.1 Base year calculation for any one approach
- 1.7 Market estimates & forecasts parameters
- 1.8 Forecast model
- 1.8.1 Quantified market impact analysis
- 1.8.1.1 Mathematical impact of growth parameters on forecast
- 1.8.1 Quantified market impact analysis
- 1.9 Research transparency addendum
- 1.9.1 Source attribution framework
- 1.9.2 Quality assurance metrics
- 1.9.3 Our commitment to trust
- 1.10 Market definitions
Chapter 2 Executive Summary
- 2.1 Industry synopsis, 2022 - 2035
- 2.2 Business trends
- 2.3 Product trends
- 2.4 Technology trends
- 2.5 Power rating trends
- 2.6 Application trends
- 2.7 Regional trends
Chapter 3 Industry Insights
- 3.1 Industry ecosystem analysis
- 3.1.1 Raw material availability & sourcing analysis
- 3.1.2 Manufacturing capacity assessment
- 3.1.3 Supply chain resilience & risk factors
- 3.1.4 Distribution network analysis
- 3.2 Regulatory landscape
- 3.3 Industry impact forces
- 3.3.1 Growth drivers
- 3.3.2 Industry pitfalls & challenges
- 3.4 Growth potential analysis
- 3.5 Porter's analysis
- 3.5.1 Bargaining power of suppliers
- 3.5.2 Bargaining power of buyers
- 3.5.3 Threat of new entrants
- 3.5.4 Threat of substitutes
- 3.6 PESTEL analysis
- 3.6.1 Political factors
- 3.6.2 Economic factors
- 3.6.3 Social factors
- 3.6.4 Technological factors
- 3.6.5 Legal factors
- 3.6.6 Environmental factors
- 3.7 Cost structure analysis of surge protection devices
- 3.8 Price trend analysis
- 3.8.1 By product
- 3.8.2 By region
- 3.9 Emerging opportunities & trends
- 3.10 Digitalization and IoT integration
Chapter 4 Competitive Landscape, 2025
- 4.1 Introduction
- 4.2 Company market share analysis, by region, 2025
- 4.2.1 North America
- 4.2.2 Europe
- 4.2.3 Asia Pacific
- 4.2.4 Middle East & Africa
- 4.2.5 Latin America
- 4.3 Strategic dashboard
- 4.3.1 Key partnerships & collaborations
- 4.3.2 Major M&A activities
- 4.3.3 Product innovations & launches
- 4.3.4 Market expansion strategies
- 4.4 Strategic initiatives
- 4.5 Competitive benchmarking
- 4.6 Innovation & technology landscape
Chapter 5 Market Size and Forecast, By Product, 2022 - 2035 (USD Million & Units)
- 5.1 Key trends
- 5.2 Hard-wired
- 5.3 Plug-in
- 5.4 Line cord
- 5.5 Power control devices
Chapter 6 Market Size and Forecast, By Technology, 2022 - 2035 (USD Million & Units)
- 6.1 Key trends
- 6.2 Type 1
- 6.3 Type 2
- 6.4 Type 3
Chapter 7 Market Size and Forecast, By Power Rating, 2022 - 2035 (USD Million & Units)
- 7.1 Key trends
- 7.2 ≤ 50 kA
- 7.3 > 50 KA to 100 KA
- 7.4 > 100 KA to 150 KA
- 7.5 > 150 KA
Chapter 8 Market Size and Forecast, By Application, 2022 - 2035 (USD Million & Units)
- 8.1 Key trends
- 8.2 Residential
- 8.3 Commercial
- 8.4 Industrial
Chapter 9 Market Size and Forecast, By Region, 2022 - 2035 (USD Million & Units)
- 9.1 Key trends
- 9.2 North America
- 9.2.1 U.S.
- 9.2.2 Canada
- 9.2.3 Mexico
- 9.3 Europe
- 9.3.1 Germany
- 9.3.2 France
- 9.3.3 Russia
- 9.3.4 UK
- 9.3.5 Italy
- 9.3.6 Spain
- 9.3.7 Netherlands
- 9.3.8 Austria
- 9.4 Asia Pacific
- 9.4.1 China
- 9.4.2 Japan
- 9.4.3 South Korea
- 9.4.4 India
- 9.4.5 Australia
- 9.4.6 New Zealand
- 9.4.7 Malaysia
- 9.4.8 Indonesia
- 9.5 Middle East & Africa
- 9.5.1 Saudi Arabia
- 9.5.2 UAE
- 9.5.3 Qatar
- 9.5.4 Egypt
- 9.5.5 South Africa
- 9.5.6 Nigeria
- 9.6 Latin America
- 9.6.1 Brazil
- 9.6.2 Argentina
Chapter 10 Company Profiles
- 10.1 ABB
- 10.2 Belkin
- 10.3 Bourns
- 10.4 Eaton
- 10.5 Emerson Electric
- 10.6 GE Vernova
- 10.7 Havells India
- 10.8 Hubbell
- 10.9 Infineon Technologies
- 10.10 JMV
- 10.11 Legrand
- 10.12 Leviton Manufacturing
- 10.13 Littelfuse
- 10.14 Maxivolt
- 10.15 Mersen
- 10.16 Philips
- 10.17 Phoenix Contact
- 10.18 Raycap
- 10.19 Rockwell Automation
- 10.20 Schneider Electric
- 10.21 Siemens
 2026年全球瞬态保护装置市场报告
 突波保护设备的全球市场(2025年):终端用户,用途,竞争企业:分析与预测
 突波保护零组件的全球市场(2025年)- 终端用户,用途,竞争企业
 快速充电突波保护插座市场:依产品类型、通路、最终用途和应用划分-全球预测,2026-2032年
 突波保护设备市场规模、份额、趋势和预测:按产品、类型、额定功率、最终用户和地区划分,2026-2034 年
 工业突波保护设备市场:商机、成长要素、产业趋势分析及2026-2035年预测2026年全球突波保护设备市场报告
 临时防护装置市场-全球产业规模、份额、趋势、机会、预测:按类型、应用、地区和竞争格局划分,2021-2031年突波保护器市场-全球产业规模、份额、趋势、机会与预测:按类型、功率范围、组件、最终用途、地区和竞争格局划分,2021-2031年按类型、安装方式、相位、最终用途和分销管道突波的浪涌抑制器市场 - 全球预测 2026-2032