


 |
市场调查报告书
商品编码
1936650
虚拟电厂市场机会、成长要素、产业趋势分析及预测(2026年至2035年)Virtual Power Plant Market Opportunity, Growth Drivers, Industry Trend Analysis, and Forecast 2026 - 2035 |
||||||
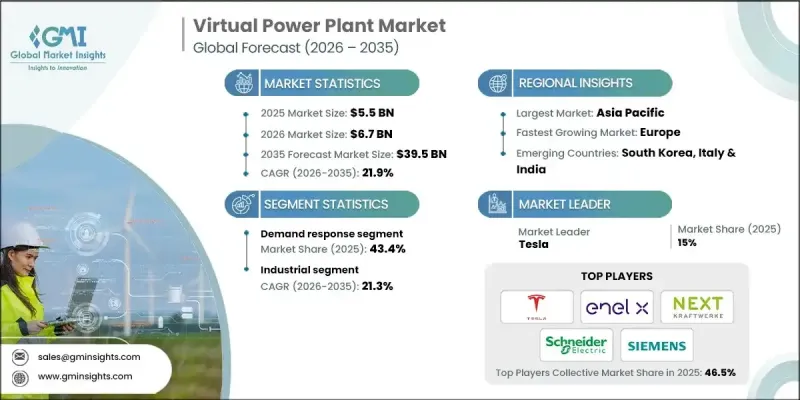
全球虚拟电厂 (VPP) 市场预计到 2025 年将达到 55 亿美元,到 2035 年将达到 395 亿美元,年复合成长率为 21.9%。
虚拟电厂(VPP)透过将太阳能板、风力发电机、电池储能和需量反应机制等分散式能源整合到一个智慧管理的单一网路中,推动着现代能源系统的演进。透过聚合发电、储能和用电,VPP 优化了能源分配,提高了电网可靠性,并增加了可再生能源发电的渗透率,同时减少了碳排放。先进能源储存系统(尤其是锂离子电池)的快速普及,使电力公司能够在用电低谷期储存多余的能源,并在需要时释放,从而保障电网的稳定性和效率。机器学习、先进通讯技术和即时分析的集成,进一步提升了运作性能、预测性维护和成本优化。随着公共产业和消费者寻求灵活、弹性和永续的能源解决方案,VPP 的重要性日益凸显。
| 市场覆盖范围 | |
|---|---|
| 开始年份 | 2025 |
| 预测年份 | 2026-2035 |
| 起始值 | 55亿美元 |
| 预测金额 | 395亿美元 |
| 复合年增长率 | 21.9% |
预计到2035年,混合资产板块将以22.1%的复合年增长率成长,这主要得益于包括太阳能板、风力发电机、电池储能係统和可控负载在内的多种分散式能源的整合。透过聚合这些多样化的资源,虚拟电厂(VPP)能够平衡间歇性能源产出与波动性需求,从而提高电网可靠性并即时优化能源调度。这种多资源模式使公共产业和营运商能够更有效地管理尖峰负载,减少对传统发电的依赖,并支持大规模可再生能源的采用,同时保持电网稳定。
预计2026年至2035年间,住宅市场将以22.5%的复合年增长率成长,主要受屋顶太阳能光电系统、家用储能电池和电动车充电器普及率不断提高的推动。住宅积极参与虚拟电厂(VPP)项目,以优化能源使用、降低电费,并透过出售剩余电力获得额外收入。意识提升的永续性、清洁能源推广奖励的出台以及智慧家居的日益普及,都在加速住宅分散式能源併入虚拟电厂网络。
美国虚拟电厂市场占据87.9%的市场份额,预计2035年将成长至115亿美元。市场扩张的驱动力主要来自电网可靠性面临的挑战,例如基础设施老化、极端天气事件频繁以及电力需求不断增长。虚拟电厂利用分散式资源提供柔软性,这对于在尖峰负载期间稳定电网至关重要。政府的支持,包括对可再生能源和储能的联邦补贴和税收优惠,进一步推动了虚拟电厂解决方案的采用和广泛应用。
目录
第一章调查方法和范围
第二章执行摘要
第三章业界考察
- 产业生态系统
- 原物料供应及采购分析
- 製造能力评估
- 供应链韧性与风险因素
- 配电网路分析
- 监管环境
- 产业影响因素
- 司机
- 产业潜在风险与挑战
- 成长潜力分析
- 成本结构分析
- 波特五力分析
- PESTEL 分析
- 新的机会与趋势
- 数位化和物联网集成
- 拓展新兴市场
- 投资分析及未来展望
第四章 竞争情势
- 介绍
- 按地区分類的公司市占率分析
- 北美洲
- 欧洲
- 亚太地区
- 世界其他地区
- 战略仪錶板
- 策略倡议
- 企业标竿管理
- 创新与科技趋势
第五章 依技术分類的市场规模及预测(2022-2035年)
- 分散式能源
- 需量反应
- 复杂资产
第六章 依最终用途分類的市场规模及预测(2022-2035年)
- 住宅
- 工业的
- 商业的
第七章 2022-2035年各地区市场规模及预测
- 北美洲
- 我们
- 加拿大
- 欧洲
- 德国
- 法国
- 英国
- 义大利
- 亚太地区
- 中国
- 日本
- 韩国
- 印度
- 世界其他地区
第八章 公司简介
- AGL Energy
- Bosch Global
- Enbala Power Networks
- Enel X
- EnergyHub
- ENGIE
- Flexitricity
- Hitachi
- Lumenaza
- Next Kraftwerke
- Schneider Electric
- Shell
- Siemens
- Statkraft
- Sunrun
- Sunnova Energy International
- Tesla
- Tiko Energy Solutions
- Toshiba Corporation
- Virtual Peaker
The Global Virtual Power Plant Market was valued at USD 5.5 billion in 2025 and is estimated to grow at a CAGR of 21.9% to reach USD 39.5 billion by 2035.
Virtual power plants (VPPs) are driving the evolution of modern energy systems by combining decentralized energy resources such as solar panels, wind turbines, batteries, and demand-response mechanisms into a single, intelligently managed network. By aggregating generation, storage, and consumption, VPPs optimize energy dispatch, improve grid reliability, and enable higher penetration of renewable energy while reducing carbon emissions. The rapid adoption of advanced energy storage systems, particularly lithium-ion batteries, allows operators to store excess power during low-demand periods and release it when needed, supporting grid stability and efficiency. Integration of machine learning, advanced communication technologies, and real-time analytics further enhances operational performance, predictive maintenance, and cost optimization. VPPs are increasingly essential as utilities and consumers seek flexible, resilient, and sustainable energy solutions.
| Market Scope | |
|---|---|
| Start Year | 2025 |
| Forecast Year | 2026-2035 |
| Start Value | $5.5 Billion |
| Forecast Value | $39.5 Billion |
| CAGR | 21.9% |
The mixed assets segment is projected to grow at a CAGR of 22.1% through 2035, driven by the integration of varied distributed energy resources such as solar panels, wind turbines, battery storage systems, and controllable loads. By aggregating these diverse resources, virtual power plants can balance intermittent energy generation with fluctuating demand, enhance grid reliability, and optimize energy dispatch in real time. This multi-resource approach also enables utilities and operators to manage peak loads more effectively, reduce reliance on conventional power generation, and support large-scale renewable adoption while maintaining grid stability.
The residential segment is expected to grow at a CAGR of 22.5% through 2026-2035, propelled by increasing adoption of rooftop solar installations, home battery storage, and electric vehicle chargers. Homeowners are actively participating in VPP programs to optimize energy usage, cut electricity expenses, and generate additional revenue by selling excess power to the grid. The combination of rising consumer awareness of sustainability, incentives for clean energy adoption, and smart home integration is accelerating the integration of residential distributed energy resources into VPP networks.
U.S. Virtual Power Plant Market held 87.9% share and is expected to generate USD 11.5 billion by 2035. Market expansion is driven by challenges related to grid reliability caused by aging infrastructure, extreme weather events, and rising electricity demand. VPPs provide critical flexibility by leveraging distributed resources to stabilize the grid during peak loads. Supportive government measures, including federal grants and tax incentives for renewable energy and energy storage, are further encouraging deployment and adoption of virtual power plant solutions.
Key players in the Global Virtual Power Plant Market include AGL Energy, Bosch Global, Enbala Power Networks, Enel X, EnergyHub, ENGIE, Flexitricity, Hitachi, Lumenaza, Next Kraftwerke, Schneider Electric, Shell, Siemens, Statkraft, Sunrun, Sunnova Energy International, Tesla, Tiko Energy Solutions, Toshiba Corporation, and Virtual Peaker. Companies in the virtual power plant market are focusing on expanding their footprint by developing integrated software platforms for energy management, forming strategic partnerships with utilities and energy providers, and investing in advanced analytics and predictive maintenance solutions. They are diversifying product portfolios to include both residential and commercial applications, enhancing scalability, and improving interoperability across distributed energy resources. Key strategies also include acquiring startups or smaller technology providers to gain innovative solutions, collaborating with regulators to ensure compliance, and offering flexible financing models to accelerate customer adoption of VPP solutions.
Table of Contents
Chapter 1 Methodology & Scope
- 1.1 Research design
- 1.2 Quality commitment
- 1.2.1 GMI AI policy & data integrity commitment
- 1.2.1.1 Source consistency protocol
- 1.2.1 GMI AI policy & data integrity commitment
- 1.3 Research Trail & Confidence Scoring
- 1.3.1 Research Trail Components
- 1.3.2 Scoring Components
- 1.4 Data Collection
- 1.4.1 Partial list of primary sources
- 1.5 Data mining sources
- 1.5.1 Paid sources
- 1.5.1.1 Sources, by region
- 1.5.1 Paid sources
- 1.6 Base estimates and calculations
- 1.6.1 Base year calculation for any one approach
- 1.7 Forecast model
- 1.8 Research transparency addendum
- 1.8.1 Source attribution framework
- 1.8.2 Quality assurance metrics
- 1.8.3 Our commitment to trust
- 1.9 Market definitions
Chapter 2 Executive Summary
- 2.1 Industry synopsis, 2022 - 2035
- 2.2 Business trends
- 2.3 Technology trends
- 2.4 End use trends
- 2.5 Regional trends
Chapter 3 Industry Insights
- 3.1 Industry ecosystem
- 3.1.1 Raw material availability & sourcing analysis
- 3.1.2 Manufacturing capacity assessment
- 3.1.3 Supply chain resilience & risk factors
- 3.1.4 Distribution network analysis
- 3.2 Regulatory landscape
- 3.3 Industry impact forces
- 3.3.1 Growth drivers
- 3.3.2 Industry pitfalls & challenges
- 3.4 Growth potential analysis
- 3.5 Cost structure analysis
- 3.6 Porter's analysis
- 3.6.1 Bargaining power of suppliers
- 3.6.2 Bargaining power of buyers
- 3.6.3 Threat of new entrants
- 3.6.4 Threat of substitutes
- 3.7 PESTEL analysis
- 3.7.1 Political factors
- 3.7.2 Economic factors
- 3.7.3 Social factors
- 3.7.4 Technological factors
- 3.7.5 Legal factors
- 3.7.6 Environmental factors
- 3.8 Emerging opportunities & trends
- 3.8.1 Digitalization & IoT integration
- 3.8.2 Emerging market penetration
- 3.9 Investment analysis and future outlook
Chapter 4 Competitive landscape, 2025
- 4.1 Introduction
- 4.2 Company market share analysis, by region, 2025
- 4.2.1 North America
- 4.2.2 Europe
- 4.2.3 Asia Pacific
- 4.2.4 Rest of world
- 4.3 Strategic dashboard
- 4.4 Strategic initiatives
- 4.5 Company benchmarking
- 4.6 Innovation & technology landscape
Chapter 5 Market Size and Forecast, By Technology, 2022 - 2035 (USD Billion)
- 5.1 Key trends
- 5.2 Distributed energy resource
- 5.3 Demand response
- 5.4 Mixed asset
Chapter 6 Market Size and Forecast, By End Use, 2022 - 2035 (USD Billion)
- 6.1 Key trends
- 6.2 Residential
- 6.3 Industrial
- 6.4 Commercial
Chapter 7 Market Size and Forecast, By Region, 2022 - 2035 (USD Billion)
- 7.1 Key trends
- 7.2 North America
- 7.2.1 U.S.
- 7.2.2 Canada
- 7.3 Europe
- 7.3.1 Germany
- 7.3.2 France
- 7.3.3 UK
- 7.3.4 Italy
- 7.4 Asia Pacific
- 7.4.1 China
- 7.4.2 Japan
- 7.4.3 South Korea
- 7.4.4 India
- 7.5 Rest of world
Chapter 8 Company Profiles
- 8.1 AGL Energy
- 8.2 Bosch Global
- 8.3 Enbala Power Networks
- 8.4 Enel X
- 8.5 EnergyHub
- 8.6 ENGIE
- 8.7 Flexitricity
- 8.8 Hitachi
- 8.9 Lumenaza
- 8.10 Next Kraftwerke
- 8.11 Schneider Electric
- 8.12 Shell
- 8.13 Siemens
- 8.14 Statkraft
- 8.15 Sunrun
- 8.16 Sunnova Energy International
- 8.17 Tesla
- 8.18 Tiko Energy Solutions
- 8.19 Toshiba Corporation
- 8.20 Virtual Peaker
 虚拟电厂市场:按组件、技术、能源来源、部署类型和最终用户划分-2026-2032年全球市场预测
 虚拟电厂市场报告:按技术、电源、最终用户和地区划分(2026-2034 年)
 虚拟电厂市场规模、份额、成长及全球产业分析:按类型、应用和地区分類的洞察,2026-2034 年预测
 2026年全球虚拟电厂市场报告全球虚拟电厂市场规模、份额、趋势和成长分析报告(2026-2034年)
 全球虚拟电厂市场:市场规模、份额和趋势分析(按技术、最终用途和地区划分),细分市场预测(2026-2033 年)
 全球虚拟电厂市场预测至2034年:按组件、电源、技术、应用、最终用户和地区划分
 全球虚拟电厂市场洞察及预测(至2032年)虚拟电厂控制平台市场(按组件、应用、最终用户、资源类型、部署模式和电压划分),全球预测(2026-2032年)
 亚太虚拟电厂(VPP)市场:按应用、产品和国家分類的分析和预测(2025-2035 年)