


 |
市场调查报告书
商品编码
1936653
电能转气市场机会、成长要素、产业趋势分析及预测(2026年至2035年)Power to Gas Market Opportunity, Growth Drivers, Industry Trend Analysis, and Forecast 2026 - 2035 |
||||||
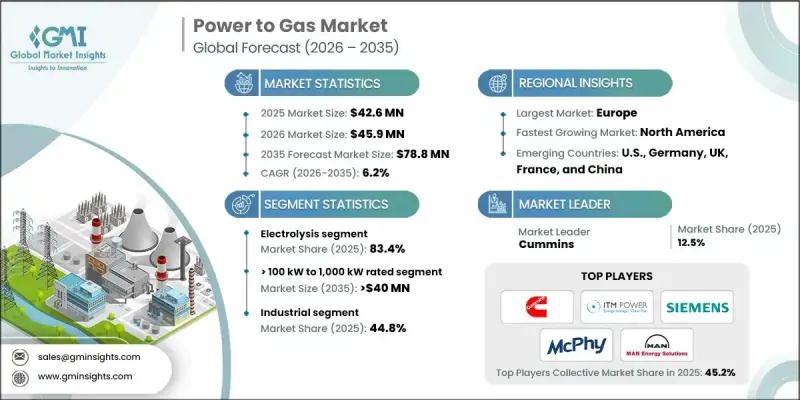
全球电能转气市场预计到 2025 年将价值 4,260 万美元,到 2035 年达到 7,880 万美元,年复合成长率为 6.2%。
这一增长得益于可再生能源发电的快速增长以及可变电源日益融入国家电网。随着能源系统的演进,电能转气技术日益被视为平衡供给与需求的关键手段。先进的数位预测工具、智慧电力调节系统和即时电解控制技术正在提升系统的效率和可靠性。电能转气技术将剩余电力转化为气态能源载体,用于长期储存、併网以及跨产业应用。将氢气混合标准与公用事业公司的脱碳策略相协调,将有助于加速基础设施建设并改善各行业的耦合。同时,碳捕获整合和甲烷化製程扩充性的进步正在推动碳循环路径的构建,并提升合成气解决方案的商业性可行性。需求成长的驱动因素包括减少发电弃风、应对间歇性、工业电气化以及对低碳原料的需求,而电能转气应用范围的扩大则得益于热力系统维修和工业燃料转化需求的增加。
| 市场覆盖范围 | |
|---|---|
| 开始年份 | 2025 |
| 预测年份 | 2026-2035 |
| 起始值 | 4260万美元 |
| 预测金额 | 7880万美元 |
| 复合年增长率 | 6.2% |
到2025年,基于电解电能转气技术将占据83.4%的市场份额,这反映了其在当前部署策略中的核心地位。再生能源可用性的提高和剩余发电量的增加正在加速电解的部署。对绿色氢能发展的坚定承诺和国家脱碳目标正在推动先进电解平台的广泛应用。同时,再生能源成本的下降和电解效率的持续提升提高了电解电能转气解决方案的经济可行性,并增强了其长期发展前景。
预计到2025年,额定功率在100kW至1000kW之间的系统将占据54.3%的市场份额,到2035年市场份额将达到4000万美元。这一容量范围与商业和工业领域的能源整合计划高度契合,尤其是在现场可再生能源发电不断扩展的情况下。寻求低碳能源来源以实现排放目标的机构正越来越多地采用中等规模的电能转气系统。区域能源供应和清洁供热策略对氢气日益增长的需求,也进一步推动了该电力领域装置容量的成长。
预计到2025年,美国电能转气市场将占据74.9%的市场份额,市场规模将达到750万美元。该国市场扩张的驱动力主要来自可再生能源发电能力的快速成长以及缓解能源紧张的需求。对清洁氢能发展和脱碳政策的支持正在推动对电解槽基础设施的投资。可再生能源枢纽的广泛部署和日益增长的电网平衡需求进一步加速了电能转气技术在美国能源领域的整合。
目录
第一章调查方法和范围
第二章执行摘要
第三章业界考察
- 生态系分析
- 原物料供应及采购分析
- 製造能力评估
- 供应链韧性与风险因素
- 配电网路分析
- 监管环境
- 产业影响因素
- 司机
- 产业潜在风险与挑战
- 成长潜力分析
- 波特五力分析
- PESTEL 分析
- 电力製气转换成本结构分析
- 价格趋势分析
- 透过技术
- 按地区
- 新的机会与趋势
- 数位化和物联网集成
第四章 竞争情势
- 介绍
- 按地区分類的公司市占率分析
- 北美洲
- 欧洲
- 亚太地区
- 战略仪錶板
- Key partnerships &collaborations
- Major M&A activities
- Product innovations &launches
- Market expansion strategies
- 策略倡议
- 竞争标竿分析
- 创新与科技趋势
第五章 依技术分類的市场规模及预测(2022-2035年)
- 电解
- 甲烷化
第六章 依产能分類的市场规模及预测(2022-2035年)
- 功率≤100千瓦
- 100千瓦至1000千瓦
- 超过1000千瓦
第七章 依应用领域分類的市场规模及预测(2022-2035年)
- 商业的
- 公共产业
- 工业的
第八章 2022-2035年各地区市场规模及预测
- 北美洲
- 我们
- 加拿大
- 欧洲
- 德国
- 英国
- 法国
- 丹麦
- 荷兰
- 瑞士
- 亚太地区
- 中国
- 日本
- 澳洲
第九章:公司简介
- AquaHydrex
- Baker Hughes
- Cummins
- Electrochaea
- Engie
- GRTgaz
- Hitachi Zosen Inova Schmack
- ITM Power
- John Cockerill
- Kanadevia Inova
- Krajete
- KROHNE
- Linde
- MAN Energy Solutions
- McPhy Energy
- NEL
- Phoenix Contact
- Power-to-Gas Hungary
- Ren-Gas
- Siemens
- Terega
- Thyssenkrupp
The Global Power to Gas Market was valued at USD 42.6 million in 2025 and is estimated to grow at a CAGR of 6.2% to reach USD 78.8 million by 2035.
Growth is supported by the rapid increase in renewable electricity generation and the growing integration of variable power sources into national grids. As energy systems evolve, power to gas solutions are increasingly viewed as a critical mechanism for balancing supply and demand. Advanced digital forecasting tools, intelligent dispatch systems, and real-time electrolyzer control technologies are strengthening system efficiency and reliability. Power to gas technology enables the conversion of surplus electricity into gaseous energy carriers, allowing long-term storage, grid injection, and cross-sector utilization. Alignment between utility decarbonization strategies and hydrogen blending standards accelerate infrastructure readiness and improving sector coupling. In parallel, advancements in carbon capture integration and methanation scalability are enabling circular carbon pathways, enhancing the commercial viability of synthetic gas solutions. Growing emphasis on curtailment reduction, intermittency management, industrial electrification, and low-carbon feedstock requirements is reinforcing demand, while expanding thermal system retrofitting and industrial fuel switching are broadening the application scope of power to gas systems.
| Market Scope | |
|---|---|
| Start Year | 2025 |
| Forecast Year | 2026-2035 |
| Start Value | $42.6 Million |
| Forecast Value | $78.8 Million |
| CAGR | 6.2% |
The electrolysis-based power to gas technologies segment accounted for 83.4% share in 2025, reflecting its central role in current deployment strategies. Increasing availability of renewable electricity and higher volumes of surplus generation are accelerating electrolyzer installations. Strong commitments to green hydrogen development and national decarbonization objectives are supporting wider adoption of advanced electrolysis platforms. At the same time, declining renewable power costs and ongoing improvements in electrolyzer efficiency are enhancing economic feasibility, strengthening the long-term outlook for electrolysis-driven power to gas solutions.
The systems rated between greater than 100 kW and 1,000 kW represented 54.3% share in 2025 and are expected to reach USD 40 million by 2035. This capacity range aligns well with commercial and industrial energy integration programs, particularly where on-site renewable generation is expanding. Organizations seeking low-carbon energy inputs to meet emissions reduction commitments are increasingly deploying mid-scale power to gas systems. Rising hydrogen demand for localized energy distribution and clean heating strategies is further supporting the growth of installations within this power segment.
United States Power to Gas Market held 74.9% share, generating USD 7.5 million in 2025. Market expansion in the country is being driven by the rapid growth of renewable power capacity and the need to mitigate energy curtailment. Policy support for clean hydrogen development and decarbonization mandates is encouraging investment in electrolyzer-based infrastructure. Broader deployment of renewable energy hubs and increasing grid-balancing requirements are further accelerating integration of power to gas technologies across the U.S. energy landscape.
Key companies operating in the Global Power to Gas Market include Siemens Energy, Linde, Baker Hughes, Cummins, Thyssenkrupp, NEL, ITM Power, McPhy Energy, MAN Energy Solutions, Engie, John Cockerill, Kanadevia Inova, Hitachi Zosen Inova Schmack, Electrochaea, Phoenix Contact, GRTgaz, Terega, Ren-Gas, AquaHydrex, KROHNE, Krajete, and Power-to-Gas Hungary. Companies active in the power to gas market are strengthening their competitive position through technology advancement, strategic partnerships, and system optimization. Leading players are investing in higher-efficiency electrolyzers, modular system designs, and digital control platforms to improve performance and scalability. Collaboration with utilities, industrial customers, and infrastructure operators is enabling faster deployment and smoother grid integration. Many companies are expanding solution portfolios to support both hydrogen and synthetic gas pathways, enhancing flexibility across end-use applications.
Table of Contents
Chapter 1 Methodology & Scope
- 1.1 Research approach
- 1.2 Quality commitments
- 1.2.1 GMI AI policy & data integrity commitment
- 1.2.1.1 Source consistency protocol
- 1.2.1 GMI AI policy & data integrity commitment
- 1.3 Research trail & confidence scoring
- 1.3.1 Research trail components
- 1.3.2 Scoring components
- 1.4 Data collection
- 1.4.1 Partial list of primary sources
- 1.5 Data mining sources
- 1.5.1 Paid sources
- 1.5.1.1 Sources, by region
- 1.5.1 Paid sources
- 1.6 Base estimates and calculations
- 1.6.1 Base year calculation for any one approach
- 1.7 Market estimates & forecasts parameters
- 1.8 Forecast model
- 1.8.1 Quantified market impact analysis
- 1.8.1.1 Mathematical impact of growth parameters on forecast
- 1.8.1 Quantified market impact analysis
- 1.9 Research transparency addendum
- 1.9.1 Source attribution framework
- 1.9.2 Quality assurance metrics
- 1.9.3 Our commitment to trust
- 1.10 Market definitions
Chapter 2 Executive Summary
- 2.1 Industry synopsis, 2022 - 2035
- 2.2 Business trends
- 2.3 Technology trends
- 2.4 Capacity trends
- 2.5 Application trends
- 2.6 Regional trends
Chapter 3 Industry Insights
- 3.1 Industry ecosystem analysis
- 3.1.1 Raw material availability & sourcing analysis
- 3.1.2 Manufacturing capacity assessment
- 3.1.3 Supply chain resilience & risk factors
- 3.1.4 Distribution network analysis
- 3.2 Regulatory landscape
- 3.3 Industry impact forces
- 3.3.1 Growth drivers
- 3.3.2 Industry pitfalls & challenges
- 3.4 Growth potential analysis
- 3.5 Porter's analysis
- 3.5.1 Bargaining power of suppliers
- 3.5.2 Bargaining power of buyers
- 3.5.3 Threat of new entrants
- 3.5.4 Threat of substitutes
- 3.6 PESTEL analysis
- 3.6.1 Political factors
- 3.6.2 Economic factors
- 3.6.3 Social factors
- 3.6.4 Technological factors
- 3.6.5 Legal factors
- 3.6.6 Environmental factors
- 3.7 Cost structure analysis of power to gas
- 3.8 Price trend analysis
- 3.8.1 By technology
- 3.8.2 By region
- 3.9 Emerging opportunities & trends
- 3.10 Digitalization and IoT integration
Chapter 4 Competitive Landscape, 2026
- 4.1 Introduction
- 4.2 Company market share analysis, by region, 2025
- 4.2.1 North America
- 4.2.2 Europe
- 4.2.3 Asia Pacific
- 4.3 Strategic dashboard
- 4.3.1 Key partnerships & collaborations
- 4.3.2 Major M&A activities
- 4.3.3 Product innovations & launches
- 4.3.4 Market expansion strategies
- 4.4 Strategic initiatives
- 4.5 Competitive benchmarking
- 4.6 Innovation & technology landscape
Chapter 5 Market Size and Forecast, By Technology, 2022 - 2035 (USD Million & kW)
- 5.1 Key trends
- 5.2 Electrolysis
- 5.3 Methanation
Chapter 6 Market Size and Forecast, By Capacity, 2022 - 2035 (USD Million & kW)
- 6.1 Key trends
- 6.2 ≤ 100 kW
- 6.3 > 100 kW to 1,000 kW
- 6.4 > 1,000 kW
Chapter 7 Market Size and Forecast, By Application, 2022 - 2035 (USD Million & kW)
- 7.1 Key trends
- 7.2 Commercial
- 7.3 Utility
- 7.4 Industrial
Chapter 8 Market Size and Forecast, By Region, 2022 - 2035 (USD Million & kW)
- 8.1 Key trends
- 8.2 North America
- 8.2.1 U.S.
- 8.2.2 Canada
- 8.3 Europe
- 8.3.1 Germany
- 8.3.2 UK
- 8.3.3 France
- 8.3.4 Denmark
- 8.3.5 Netherlands
- 8.3.6 Switzerland
- 8.4 Asia Pacific
- 8.4.1 China
- 8.4.2 Japan
- 8.4.3 Australia
Chapter 9 Company Profiles
- 9.1 AquaHydrex
- 9.2 Baker Hughes
- 9.3 Cummins
- 9.4 Electrochaea
- 9.5 Engie
- 9.6 GRTgaz
- 9.7 Hitachi Zosen Inova Schmack
- 9.8 ITM Power
- 9.9 John Cockerill
- 9.10 Kanadevia Inova
- 9.11 Krajete
- 9.12 KROHNE
- 9.13 Linde
- 9.14 MAN Energy Solutions
- 9.15 McPhy Energy
- 9.16 NEL
- 9.17 Phoenix Contact
- 9.18 Power-to-Gas Hungary
- 9.19 Ren-Gas
- 9.20 Siemens
- 9.21 Terega
- 9.22 Thyssenkrupp
 气化市场:气化设备类型、原料类型、技术、计划产能与最终用途-2026-2032年全球市场预测
 2026年全球P2H2(电制氢)市场报告
 全球Power-to-X市场:市场规模、占有率、成长率、产业分析、依类型、应用和地区划分的考察以及未来预测(2026-2034)
 气化市场-全球产业规模、份额、趋势、机会、预测:依原料、应用、区域和竞争格局划分,2021-2031年电转气市场-全球产业规模、份额、趋势、机会和预测:按技术、产能、最终用户、地区和竞争格局划分,2021-2031年
 氢气:市场占有率分析、产业趋势与统计、成长预测(2026-2031)Power-To-X 市场 - 全球产业规模、份额、趋势、机会和预测,按技术、最终用途、地区和竞争格局划分,2021-2031 年预测
 气化市场规模、份额及成长分析(依原料、气化炉类型、应用、最终用户及地区划分)-2026-2033年产业预测
 Power to X 全球市场全球氢气测试市场(2024-2029)