


 |
市场调查报告书
商品编码
1910556
氢气:市场占有率分析、产业趋势与统计、成长预测(2026-2031)Hydrogen Gas - Market Share Analysis, Industry Trends & Statistics, Growth Forecasts (2026 - 2031) |
||||||
※ 本网页内容可能与最新版本有所差异。详细情况请与我们联繫。
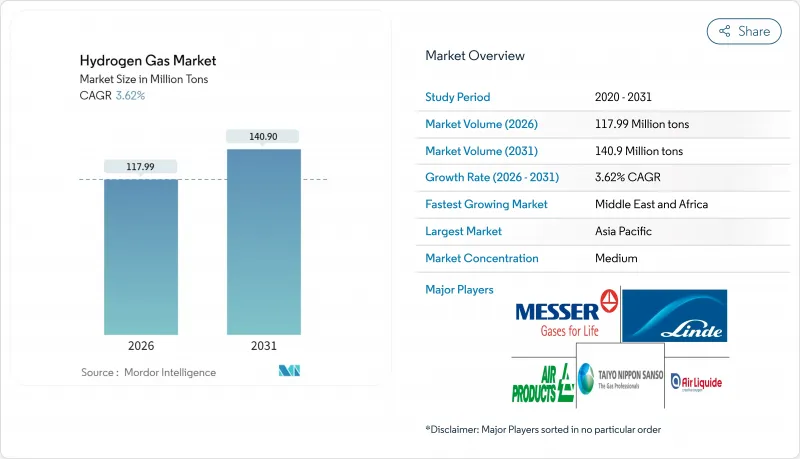
预计氢气市场将从 2025 年的 1.1386 亿吨成长到 2026 年的 1.1799 亿吨,到 2031 年将达到 1.409 亿吨,2026 年至 2031 年的复合年增长率为 3.62%。
基于成本竞争力、政府补贴和脱碳政策的区域竞争是影响氢气市场的关键因素。日本累计200亿美元用于全国范围内的基础建设,欧盟则推动到2030年将20%的氢气掺入天然气管网。生产地点和碳排放正在影响战略选址决策,促使生产商将电解和蓝氢生产设施建在低成本可再生能源和天然气资源附近。中东和澳洲等新兴出口中心为贸易增添了新的维度,而燃料电池汽车的稳步普及正在推动基础设施需求的成长,并为建立更广泛的加氢网路奠定基础。
全球氢气市场趋势及展望
对低碳氨生产的需求
航运业的脱碳进程正在推动对绿色氨的需求,而随着托运人寻求碳中和的船舶加註解决方案,氢气市场的重要性日益凸显。国际海事组织(IMO)2050年净零排放承诺正在加速生产商的转型,例如Yara和Angie等公司已将可再生能源连接到其化肥生产基地,以确保在碳排放受限的市场中获得出口合格。竞争优势取决于氢气的碳排放强度,而不仅仅是原料价格,这为氨相关氢气的长期结构性成长提供了保障。
炼油厂脱硫法规
2020年国际海事组织(IMO)硫含量上限和区域燃料品质标准使炼油厂的氢气需求增加了约15%,从而为氢气市场奠定了基本负载需求。加工高黏度原油需要更先进的加氢处理工艺,这推动了炼油厂附近蓝氢的投资。这些专有的整合模式透过共用公用设施确保了需求的稳定性,并简化了碳捕获的经济性。
绿色/蓝氢生产高成本
目前,绿氢的生产成本在每公斤3至8美元之间,具体价格取决于再生能源价格和电解性能,远高于每公斤1至2美元的灰色氢气。蓝氢缩小了成本差距,但需要承担碳捕获成本并接受监管。目前,只有符合碳定价机制的高价值应用才能承担这些增加的成本,这暂时限制了蓝色氢气在氢气市场的普及。
细分市场分析
2025年,随着大型工业走廊充分利用现有路权资源,管道运输网路将占据氢气市场58.36%的份额,预计到2031年,这种运输方式的复合年增长率将达到4.06%。欧洲氢能骨干网全长28,000公里,与公路拖车运输相比,可降低30%至50%的运输成本,进而增强氢气市场的规模经济效益。高压管网拖车仍将是偏远地区需求中心和早期部署阶段的重要运输方式,而气瓶则将用于特殊应用和偏远地区的使用者。
在新兴市场,由于缺乏现有的天然气管网,管网运输可以弥补基础设施的不足,即使运输成本高昂,也能促进氢气技术的早期应用。随着欧洲和美国审批流程的加快,专用氢气管道将从丛集延伸至钢铁和化工厂,为深化工业脱碳和扩大氢气市场奠定必要的基础。
本氢气市场报告按分销方式(管道、高压管束拖车、钢瓶)、应用领域(氨、甲醇、炼油、直接还原铁、燃料电池汽车及其他应用)和地区(亚太、北美、欧洲、南美、中东和非洲)进行分析。市场预测以吨为单位。
区域分析
预计到2025年,亚太地区将占全球氢气市场规模的34.12%,主要得益于中国重工业的快速发展、日本的氢能协会倡议以及韩国燃料电池发电的普及。中国的碳中和承诺和氢能炼钢先导计画也持续推高了该地区的氢气需求。日本200亿美元的公共资金投入正在加速氢气供需基础设施的建设,而韩国的「K-New Deal」计画则将氢能融入其电力和交通发展策略。
在「再生能源赋能欧盟」(REPowerEU)倡议下,欧洲已将氢能定位为天然气供应多元化的战略工具,推动国内电解工厂的建设和进口码头的投资。德国在电解能力方面处于领先地位,荷兰正在将鹿特丹改造为全球氢气运输的欧洲进口枢纽。北欧的水力和风能资源是绿色氢气出口的基础,挪威正在开发管道和海上运输路线以满足欧洲的需求。
北美正利用其丰富的天然气蕴藏量,大力发展蓝氢经济,同时计画投资95亿美元建设氢能中心,扩大绿色氢生产。加州的低碳燃料标准支撑着除亚洲以外全球最大的加氢网络,而加拿大则致力于透过向亚洲出口液态氢来提升出口价格竞争力。中东和非洲地区在沙乌地阿拉伯NEOM计划和阿联酋出口蓝图的推动下,实现了4.03%的年复合成长率,成为成长最快的地区。这些措施旨在将丰富的太阳能资源与大规模电解技术相结合,为当地工业和国际消费者提供氢气。
其他福利:
- Excel格式的市场预测(ME)表
- 3个月的分析师支持
目录
第一章 引言
- 研究假设和市场定义
- 调查范围
第二章调查方法
第三章执行摘要
第四章 市场情势
- 市场概览
- 市场驱动因素
- 对低碳氨生产的需求
- 炼油厂脱硫法规
- 政府对绿氢能的激励措施
- 扩大燃料电池汽车的引入
- 强制混合氢气
- 市场限制
- 绿色/蓝氢生产成本高
- 高成本的仓储和运输物流
- 当地民众反对新建氢气管道
- 价值链分析
- 波特五力模型
- 供应商的议价能力
- 买方的议价能力
- 新进入者的威胁
- 替代品的威胁
- 竞争对手之间的竞争
第五章 市场规模与成长预测
- 透过散布
- 管道
- 高压管拖车
- 圆柱
- 透过使用
- 氨
- 甲醇
- 纯化
- 直接还原铁(DRI)
- 燃料电池汽车(FCV)
- 其他用途
- 按地区
- 亚太地区
- 中国
- 印度
- 日本
- 韩国
- 东南亚国协
- 亚太其他地区
- 北美洲
- 美国
- 加拿大
- 墨西哥
- 欧洲
- 德国
- 英国
- 法国
- 义大利
- 俄罗斯
- 北欧国家
- 其他欧洲地区
- 南美洲
- 巴西
- 阿根廷
- 其他南美洲
- 中东和非洲
- 沙乌地阿拉伯
- 南非
- 其他中东和非洲地区
- 亚太地区
第六章 竞争情势
- 市场集中度
- 策略趋势
- 市占率/排名分析
- 公司简介
- Aditya Birla Chemicals
- Air Liquide
- Air Products and Chemicals, Inc.
- BASF SE
- Equinor ASA
- Gulf Cryo
- Iwatani Corp.
- Kawasaki Heavy Industries, Ltd.
- Linde plc
- MATHESON Tri-Gas, Inc.
- Messer SE & Co. KGaA
- TAIYO NIPPON SANSO CORPORATION
第七章 市场机会与未来展望
The Hydrogen Gas Market is expected to grow from 113.86 million tons in 2025 to 117.99 million tons in 2026 and is forecast to reach 140.9 million tons by 2031 at 3.62% CAGR over 2026-2031.
Cost-driven regional competitiveness, government subsidies, and decarbonization mandates are the principal forces shaping the hydrogen gas market, with Japan earmarking USD 20 billion for nationwide infrastructure and the European Union pressing toward a 20% hydrogen blend in natural-gas grids by 2030. Production location and carbon intensity now dictate strategic positioning, pushing producers to co-locate electrolysis or blue-hydrogen facilities near low-cost renewable or natural-gas resources. Emerging export hubs in the Middle East and Australia add a new trade dimension, while the steady rollout of fuel-cell vehicles builds anchor demand that underwrites a wider refueling network.
Global Hydrogen Gas Market Trends and Insights
Demand for Low-Carbon Ammonia Production
Global maritime decarbonization triggers demand for green ammonia, elevating the hydrogen gas market as shippers seek carbon-neutral bunkering solutions. The International Maritime Organization's 2050 net-zero pledge accelerates producer pivots, with Yara and Engie linking renewable power to fertilizer complexes to safeguard export eligibility in carbon-constrained markets. Competitive advantage now hinges on hydrogen carbon intensity rather than merely feedstock price, injecting long-term structural growth into ammonia-linked hydrogen volumes.
Refinery Desulfurization Regulations
The 2020 IMO sulfur cap and regional fuel-quality standards lifted refinery hydrogen offtake by nearly 15%, anchoring base-load demand in the hydrogen gas market. Heavier crude slates need deeper hydroprocessing, prompting blue-hydrogen investments adjacent to refineries. These captive integration models ensure offtake certainty and streamline carbon-capture economics through shared utilities.
High Cost of Green/Blue H2 Production
Green hydrogen currently ranges between USD 3 and 8 per kg depending on renewable electricity pricing and electrolyzer performance, outstripping gray alternatives at USD 1-2 per kg. Blue hydrogen narrows the gap but entails carbon-capture costs and regulatory scrutiny. Only premium applications with carbon-pricing compliance can presently absorb these premiums, temporarily limiting widespread uptake across the hydrogen gas market.
Other drivers and restraints analyzed in the detailed report include:
- Government Incentives for Green H2
- Rising Fuel-Cell Vehicle Rollout
- Expensive Storage and Transport Logistics
For complete list of drivers and restraints, kindly check the Table Of Contents.
Segment Analysis
Pipeline networks captured 58.36% of the hydrogen gas market share in 2025 as large industrial corridors exploit existing right-of-way assets, and this modality is growing at 4.06% CAGR through 2031. The European Hydrogen Backbone's planned 28,000 km of lines will lower delivered costs by 30-50% relative to road trailers, reinforcing scale economies across the hydrogen gas market. High-pressure tube trailers remain crucial for islanded demand centers and early-stage deployments, while cylinders serve specialized or remote users.
In emerging markets without legacy gas grids, tube-trailer logistics bridge the readiness gap, fostering early adoption despite premium transport costs. As permitting accelerates in Europe and the United States, dedicated hydrogen pipelines will broaden from refining clusters to include steel and chemical plants, providing the backbone required for deeper industrial decarbonization and wider hydrogen gas market reach.
The Hydrogen Gas Market Report is Segmented by Distribution (Pipeline, High-Pressure Tube Trailer, and Cylinder), Application (Ammonia, Methanol, Refining, Direct Reduced Iron, Fuel-Cell Vehicles, and Other Applications), and Geography (Asia-Pacific, North America, Europe, South America, and Middle East and Africa). The Market Forecasts are Provided in Terms of Volume (Tons).
Geography Analysis
Asia-Pacific accounted for 34.12% of the hydrogen gas market size in 2025, anchored by China's heavy-industry uptake, Japan's hydrogen-society agenda, and South Korea's fuel-cell power rollouts. China's carbon-neutrality pledge and pilot hydrogen-steel projects keep regional volumes elevated. Japan's USD 20 billion public-funding pool accelerates both supply and demand infrastructure, while South Korea's K-New Deal integrates hydrogen into power and transport goals.
Europe positions hydrogen as a strategic lever for gas-supply diversification under REPowerEU, catalyzing domestic electrolyzer builds and import-terminal investments. Germany leads installed electrolysis capacity, and the Netherlands is remaking Rotterdam into a continental intake hub for global hydrogen shipments. Nordic hydro and wind resources underpin green-hydrogen export ambitions, with Norway exploring pipeline and maritime routes to serve continental demand.
North America leverages ample natural-gas reserves for blue-hydrogen economics while boosting green output under the USD 9.5 billion hydrogen-hubs program. California's Low Carbon Fuel Standard underwrites the world's largest non-Asian refueling network, and Canada targets export parity with liquefied shipments to Asia. Middle East and Africa score the fastest 4.03% CAGR, led by Saudi Arabia's NEOM and the UAE's export road map, stitching together sun-rich renewable resources with scale electrolysis to supply both local industry and overseas consumers.
- Aditya Birla Chemicals
- Air Liquide
- Air Products and Chemicals, Inc.
- BASF SE
- Equinor ASA
- Gulf Cryo
- Iwatani Corp.
- Kawasaki Heavy Industries, Ltd.
- Linde plc
- MATHESON Tri-Gas, Inc.
- Messer SE & Co. KGaA
- TAIYO NIPPON SANSO CORPORATION
Additional Benefits:
- The market estimate (ME) sheet in Excel format
- 3 months of analyst support
TABLE OF CONTENTS
1 Introduction
- 1.1 Study Assumptions and Market Definition
- 1.2 Scope of the Study
2 Research Methodology
3 Executive Summary
4 Market Landscape
- 4.1 Market Overview
- 4.2 Market Drivers
- 4.2.1 Demand for Low-Carbon Ammonia Production
- 4.2.2 Refinery Desulfurization Regulations
- 4.2.3 Government Incentives for Green H2
- 4.2.4 Rising Fuel-Cell Vehicle Rollout
- 4.2.5 Hydrogen-Gas-Grid Blending Mandates
- 4.3 Market Restraints
- 4.3.1 High Cost of Green/Blue H2 Production
- 4.3.2 Expensive Storage and Transport Logistics
- 4.3.3 Community Opposition to New H2 Pipelines
- 4.4 Value Chain Analysis
- 4.5 Porter's Five Forces
- 4.5.1 Bargaining Power of Suppliers
- 4.5.2 Bargaining Power of Buyers
- 4.5.3 Threat of New Entrants
- 4.5.4 Threat of Substitutes
- 4.5.5 Competitive Rivalry
5 Market Size and Growth Forecasts (Volume)
- 5.1 By Distribution
- 5.1.1 Pipeline
- 5.1.2 High-pressure tube trailer
- 5.1.3 Cylinder
- 5.2 By Application
- 5.2.1 Ammonia
- 5.2.2 Methanol
- 5.2.3 Refining
- 5.2.4 Direct Reduced Iron (DRI)
- 5.2.5 Fuel-cell Vehicles (FCVs)
- 5.2.6 Other Applications
- 5.3 By Geography
- 5.3.1 Asia-Pacific
- 5.3.1.1 China
- 5.3.1.2 India
- 5.3.1.3 Japan
- 5.3.1.4 South Korea
- 5.3.1.5 ASEAN Countries
- 5.3.1.6 Rest of Asia-Pacific
- 5.3.2 North America
- 5.3.2.1 United States
- 5.3.2.2 Canada
- 5.3.2.3 Mexico
- 5.3.3 Europe
- 5.3.3.1 Germany
- 5.3.3.2 United Kingdom
- 5.3.3.3 France
- 5.3.3.4 Italy
- 5.3.3.5 Russia
- 5.3.3.6 NORDIC Countries
- 5.3.3.7 Rest of Europe
- 5.3.4 South America
- 5.3.4.1 Brazil
- 5.3.4.2 Argentina
- 5.3.4.3 Rest of South America
- 5.3.5 Middle East and Africa
- 5.3.5.1 Saudi Arabia
- 5.3.5.2 South Africa
- 5.3.5.3 Rest of Middle East and Africa
- 5.3.1 Asia-Pacific
6 Competitive Landscape
- 6.1 Market Concentration
- 6.2 Strategic Moves
- 6.3 Market Share/Ranking Analysis
- 6.4 Company Profiles (includes Global level Overview, Market level overview, Core Segments, Financials as available, Strategic Information, Market Rank/Share for key companies, Products and Services, and Recent Developments)
- 6.4.1 Aditya Birla Chemicals
- 6.4.2 Air Liquide
- 6.4.3 Air Products and Chemicals, Inc.
- 6.4.4 BASF SE
- 6.4.5 Equinor ASA
- 6.4.6 Gulf Cryo
- 6.4.7 Iwatani Corp.
- 6.4.8 Kawasaki Heavy Industries, Ltd.
- 6.4.9 Linde plc
- 6.4.10 MATHESON Tri-Gas, Inc.
- 6.4.11 Messer SE & Co. KGaA
- 6.4.12 TAIYO NIPPON SANSO CORPORATION
7 Market Opportunities and Future Outlook
- 7.1 White-space and Unmet-need Assessment
 气化市场:气化设备类型、原料类型、技术、计划产能与最终用途-2026-2032年全球市场预测
 2026年全球P2H2(电制氢)市场报告
 全球Power-to-X市场:市场规模、占有率、成长率、产业分析、依类型、应用和地区划分的考察以及未来预测(2026-2034)
 电能转气市场机会、成长要素、产业趋势分析及预测(2026年至2035年)
 气化市场-全球产业规模、份额、趋势、机会、预测:依原料、应用、区域和竞争格局划分,2021-2031年电转气市场-全球产业规模、份额、趋势、机会和预测:按技术、产能、最终用户、地区和竞争格局划分,2021-2031年Power-To-X 市场 - 全球产业规模、份额、趋势、机会和预测,按技术、最终用途、地区和竞争格局划分,2021-2031 年预测
 气化市场规模、份额及成长分析(依原料、气化炉类型、应用、最终用户及地区划分)-2026-2033年产业预测
 Power to X 全球市场全球氢气测试市场(2024-2029)