


 |
市场调查报告书
商品编码
1936658
整合舰桥系统市场机会、成长要素、产业趋势分析及预测(2026年至2035年)Integrated Bridge Systems Market Opportunity, Growth Drivers, Industry Trend Analysis, and Forecast 2026 - 2035 |
||||||
全球整合舰桥系统市场预计到 2025 年将达到 71.3 亿美元,到 2035 年将达到 140.7 亿美元,年复合成长率为 7.2%。
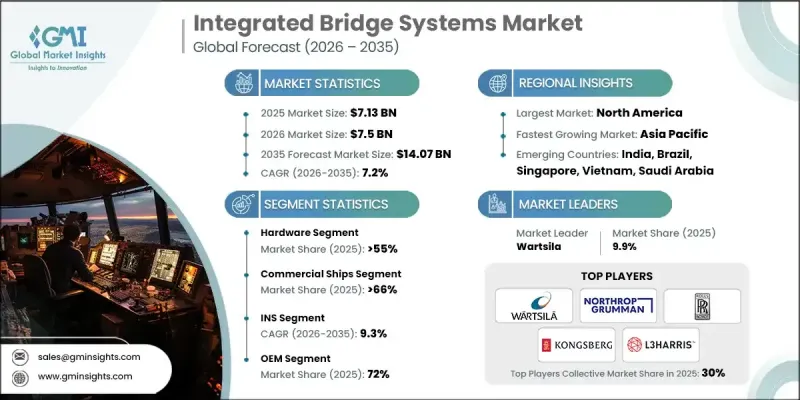
国际海运贸易的扩张和持续的船队更新正在推动新船建造,直接增加了对工厂预装的整合舰桥系统的需求,这些系统能够提高航行效率、航线规划精度和作业协调性。船东和营运商越来越注重优化远洋作业,同时降低燃油消耗和整体航程成本。整合舰桥系统透过将导航智慧、效能分析和即时作业资料整合到一个统一的指挥环境中,帮助实现这些目标。配备数位技术的船舶数量不断增加,进一步强化了对集中式控制系统的需求,这些系统能够最大限度地减少船员的工作负荷,同时提高情境察觉。有关航行安全、监控透明度和标准化作业规范的监管压力,并持续推动私营和政府营运船队采用整合式驾驶台系统。随着海上作业变得越来越资料密集和主导,整合舰桥系统正逐渐成为现代船舶架构的核心组成部分。
| 市场覆盖范围 | |
|---|---|
| 开始年份 | 2025 |
| 预测年份 | 2026-2035 |
| 起始值 | 71.3亿美元 |
| 预测金额 | 140.7亿美元 |
| 复合年增长率 | 7.2% |
2025 年,硬体部分占 55% 的市场份额,预计到 2035 年将达到 73.5 亿美元。整合舰桥系统中的硬体不断发展,透过提高显示解析度、模组化系统设计以及注重冗余的架构,提高运行可靠性,并支援多个船舶类别的高级自动化。
到 2025 年,商船运输领域将占 66% 的市场份额,市场规模将达到 47.3 亿美元。推动该领域采用的因素包括满足安全法规、提高导航效率以及透过整合数位导航和控制平台获得大规模营运支援的需求。
预计2025年,美国整合舰桥系统市场规模将达15.2亿美元。持续进行的舰艇更新和现代化改造项目正在推动对安全、互通性且具有弹性的舰桥系统的需求,这些系统旨在满足先进的运行需求和长期任务可靠性要求。此外,人们对网路安全的日益关注也加速了网路弹性架构的普及,这些架构能够保护导航和控制系统免受潜在故障的影响。
目录
第一章调查方法
第二章执行摘要
第三章业界考察
- 生态系分析
- 供应商情况
- 利润率分析
- 成本结构
- 每个阶段的附加价值
- 影响价值链的因素
- 中断
- 产业影响因素
- 司机
- 智慧与自主船舶的普及应用日益广泛
- 严格的国际海事安全法规
- 全球海运贸易的成长
- 提高燃油效率和优化航程的需求
- 海洋电子技术的进步
- 产业潜在风险与挑战
- 较高的初始实施和整合成本
- 现有船舶改造的复杂性
- 市场机会
- 完全整合桥樑系统扩展
- 新兴航运经济体的需求不断成长
- 整合数位化和数据分析
- 海军和国防舰队现代化计划
- 成长潜力分析
- 监管环境
- 北美洲
- 美国:美国海岸警卫队航行与船舶检查通告 (NVIC) 01-20 - 海事网路风险管理
- 加拿大:《加拿大航运法》(2001 年)-海事安全条例
- 欧洲
- 英国:商船(航行安全)条例
- 德国:BSH整合导航系统型式核准要求
- 法国:SOLAS(国际海上人命安全公约)-船舶设备要求
- 义大利:IMO SOLAS一体化驾驶室与导航系统
- 西班牙:欧盟海事设备指令(MED)-导航设备
- 亚太地区
- 中国:中国船级社关于航海设备和IBS的规则
- 日本国土交通省船舶导航设备技术标准
- 印度:商船(航海设备)规则
- 拉丁美洲
- 巴西:NORMAM-01 - 导航设备需求
- 墨西哥:SEMAR 海事安全法规
- 阿根廷:SOLAS——航行装备合规性
- 中东和非洲
- 阿联酋:海上安全法规 - SOLAS
- 南非:商船(航行安全)规则
- 沙乌地阿拉伯:SACS关于船舶导航设备的规定
- 北美洲
- 波特五力分析
- PESTEL 分析
- 科技与创新趋势
- 当前技术趋势
- 新兴技术
- 成本細項分析
- 专利分析
- 永续性和环境方面
- 永续实践
- 减少废弃物策略
- 生产中的能源效率
- 环保倡议
- 未来市场展望与机会
- 定价、商业模式和合约类型
- 硬体定价(驾驶室主机、感应器、显示器)
- 软体授权模式(按船舶/按模组)
- 服务和维护合约(5-20年生命週期)
- OEM捆绑定价与模组化升级
- 比较国防采购和商业运输价格
- 安装经济性和生命週期成本分析
- 新船IBS安装的成本结构
- 改造整合成本与风险
- 校准、培训和认证费用
- 软体更新及持续营运成本
- 新建和改造专案采用分析
- 依船舶船龄及等级分類的改装需求
- 监管主导的改装週期
- 投资报酬率比较:改装vs. 全面更换
- 买家和采购决策的趋势
- 网路安全与功能安全经济学
第四章 竞争情势
- 介绍
- 公司市占率分析
- 北美洲
- 欧洲
- 亚太地区
- 拉丁美洲
- 中东和非洲
- 主要市场公司的竞争分析
- 竞争定位矩阵
- 战略展望矩阵
- 重大进展
- 併购
- 伙伴关係与合作
- 新产品发布
- 企业扩张计画和资金筹措
第五章 按组件分類的市场估算与预测,2022-2035年
- 硬体
- 展示
- 控制单元
- 资料储存设备
- 感应器
- 警报装置
- 其他的
- 软体
- 服务
- 专业服务
- 託管服务
第六章 按船舶类型分類的市场估算与预测,2022-2035年
- 商船
- 防御舰
7. 2022-2035年各子系统市场估算与预测
- INS
- 自动气象观测系统(AWOS)
- 航行数据记录仪
- 自动辨识系统(AIS)
第八章 依最终用途分類的市场估算与预测,2022-2035年
- OEM
- 售后市场
9. 依整合程度分類的市场估计与预测,2022-2035 年
- 部分
- 完全的
第十章 2022-2035年各地区市场估计与预测
- 北美洲
- 我们
- 加拿大
- 欧洲
- 德国
- 英国
- 法国
- 义大利
- 西班牙
- 俄罗斯
- 北欧国家
- 葡萄牙
- 克罗埃西亚
- 比荷卢经济联盟
- 亚太地区
- 中国
- 印度
- 日本
- 澳洲
- 韩国
- 新加坡
- 泰国
- 印尼
- 越南
- 拉丁美洲
- 巴西
- 墨西哥
- 阿根廷
- 哥伦比亚
- 中东和非洲
- 南非
- 沙乌地阿拉伯
- 阿拉伯聯合大公国
- 土耳其
第十一章 公司简介
- 世界玩家
- Consilium
- Furuno Electric
- Hensoldt
- Kongsberg Gruppen
- L3 Harris Technologies
- Mitsubishi Electric
- Northrop Grumman
- Rolls-Royce
- Sperry Marine
- Wartsila
- 区域玩家
- Alphatron Marine
- Beier Integrated Systems
- Japan Radio Company(JRC)
- Naudeq
- Norwegian Electric Systems
- Praxis Automation Technology
- Prime Mover Controls
- Tokyo Keiki
- Emerging/Disruptor Players
- ComNav Marine
- Hatteland Technology
- Høglund Marine Automation
- Mackay Marine
- Marine Technologies
- Naval Group Navigation Systems
- Raytheon Anschutz
- Saab Marine Electronics
- Tokyo Sensor
- Trelleborg Marine Systems
The Global Integrated Bridge Systems Market was valued at USD 7.13 billion in 2025 and is estimated to grow at a CAGR of 7.2% to reach USD 14.07 billion by 2035.
Rising international seaborne trade and continuous fleet renewal initiatives are driving the construction of new vessels, which directly increases demand for factory-installed integrated bridge systems that enhance navigational efficiency, voyage planning accuracy, and operational coordination. Shipowners and operators are increasingly focused on optimizing long-distance operations while reducing fuel consumption and overall voyage costs. Integrated bridge systems support these objectives by combining navigation intelligence, performance analytics, and real-time operational data within a single command environment. The growing presence of digitally enabled vessels is further reinforcing the need for centralized control systems that improve situational awareness while minimizing crew workload. Regulatory pressure related to navigation safety, monitoring transparency, and standardized operational practices continues to drive adoption across commercial and government-operated fleets. As maritime operations become more data-intensive and automation-driven, integrated bridge systems are positioned as a core component of modern vessel architecture.
| Market Scope | |
|---|---|
| Start Year | 2025 |
| Forecast Year | 2026-2035 |
| Start Value | $7.13 Billion |
| Forecast Value | $14.07 Billion |
| CAGR | 7.2% |
In 2025, the hardware segment held 55% share and is forecast to reach USD 7.35 billion by 2035. Hardware within integrated bridge systems continues to advance through improved display resolution, modular system design, and redundancy-focused architectures that enhance operational reliability and support higher levels of automation across multiple vessel categories.
The commercial ships segment accounted for 66% share in 2025 and generated USD 4.73 billion. Adoption within this segment is driven by the need to meet safety regulations, improve voyage efficiency, and support large-scale operations through integrated digital navigation and control platforms.
US Integrated Bridge Systems Market was valued at USD 1.52 billion in 2025. Ongoing fleet upgrades and modernization programs are driving demand for secure, interoperable, and resilient bridge systems designed to support advanced operational requirements and long-term mission reliability. Rising concerns around digital security are also accelerating the adoption of cyber-resilient architectures that protect navigation and control systems from potential disruptions.
Key companies operating in the Global Integrated Bridge Systems Market include Kongsberg Gruppen, Wartsila, Furuno Electric, Rolls-Royce, Northrop Grumman, L3Harris Technologies, Tokyo Keiki, Japan Radio Company, Alphatron Marine, and Consilium. Companies in the integrated bridge systems market strengthen their market position by investing in advanced digital navigation platforms and scalable system architectures. Many focus on integrating automation-ready hardware with intelligent software to support future vessel upgrades. Strategic partnerships with shipbuilders and fleet operators enable early system integration and long-term service contracts. Firms also emphasize compliance with evolving regulatory standards while improving cybersecurity and system redundancy. Expanding global service networks and lifecycle support capabilities helps maintain customer retention. Continuous innovation in display technologies, data fusion, and decision-support tools allows companies to differentiate offerings and capture a greater share across both commercial and government maritime sectors.
Table of Contents
Chapter 1 Methodology
- 1.1 Research approach
- 1.2 Quality commitments
- 1.2.1 GMI AI policy & data integrity commitment
- 1.3 Research trail & confidence scoring
- 1.3.1 Research trail components
- 1.3.2 Scoring components
- 1.4 Data collection
- 1.4.1 Partial list of primary sources
- 1.5 Data mining sources
- 1.5.1 Paid sources
- 1.6 Base estimates and calculations
- 1.6.1 Base year calculation
- 1.7 Forecast
- 1.8 Research transparency addendum
Chapter 2 Executive Summary
- 2.1 Industry 360° synopsis, 2022 - 2035
- 2.2 Key market trends
- 2.2.1 Regional
- 2.2.2 Component
- 2.2.3 Ship
- 2.2.4 Sub system
- 2.2.5 Level of integration
- 2.2.6 End use
- 2.3 TAM Analysis, 2026-2034
- 2.4 CXO perspectives: Strategic imperatives
- 2.4.1 Executive decision points
- 2.4.2 Critical success factors
- 2.5 Future outlook & strategic recommendations
Chapter 3 Industry Insights
- 3.1 Industry ecosystem analysis
- 3.1.1 Supplier landscape
- 3.1.2 Profit margin analysis
- 3.1.3 Cost structure
- 3.1.4 Value addition at each stage
- 3.1.5 Factor affecting the value chain
- 3.1.6 Disruptions
- 3.2 Industry impact forces
- 3.2.1.1 Growth drivers
- 3.2.1.2 Rising adoption of smart and autonomous vessels
- 3.2.1.3 Stringent international maritime safety regulations
- 3.2.1.4 Growth in global seaborne trade
- 3.2.1.5 Need for fuel efficiency and voyage optimization
- 3.2.1.6 Technological advancements in marine electronics
- 3.2.2 Industry pitfalls and challenges
- 3.2.2.1 High initial installation and integration costs
- 3.2.2.2 Complexity of retrofitting existing vessels
- 3.2.3 Market opportunities
- 3.2.3.1 Expansion of fully integrated bridge systems
- 3.2.3.2 Rising demand from emerging maritime economies
- 3.2.3.3 Digitalization and data analytics integration
- 3.2.3.4 Naval and defence fleet modernization programs
- 3.3 Growth potential analysis
- 3.4 Regulatory landscape
- 3.4.1 North America
- 3.4.1.1 United States: U.S. Coast Guard Navigation and Vessel Inspection Circular (NVIC) 01-20 - Maritime Cyber Risk Management
- 3.4.1.2 Canada: Canada Shipping Act, 2001 - Marine Safety Regulations
- 3.4.2 Europe
- 3.4.2.1 United Kingdom: Merchant Shipping (Safety of Navigation) Regulations
- 3.4.2.2 Germany: BSH Type Approval Requirements for Integrated Navigation Systems
- 3.4.2.3 France: SOLAS- Ship Navigation Equipment Requirements
- 3.4.2.4 Italy: IMO SOLAS- Integrated Bridge and Navigation Systems
- 3.4.2.5 Spain: EU Marine Equipment Directive (MED) - Navigation Equipment
- 3.4.3 Asia Pacific
- 3.4.3.1 China: China Classification Society Rules for Navigation Equipment and IBS
- 3.4.3.2 Japan: MLIT Technical Standards for Ship Navigation Equipment
- 3.4.3.3 India: Merchant Shipping (Navigational Equipment) Rules
- 3.4.4 Latin America
- 3.4.4.1 Brazil: NORMAM-01 - Navigation Equipment Requirements
- 3.4.4.2 Mexico: SEMAR Maritime Navigation Safety Regulations
- 3.4.4.3 Argentina: SOLAS- Navigation Equipment Compliance
- 3.4.5 Middle East & Africa
- 3.4.5.1 United Arab Emirates: Marine Navigation Safety Regulations - SOLAS
- 3.4.5.2 South Africa: Merchant Shipping (Safe Navigation) Regulations
- 3.4.5.3 Saudi Arabia: SACS Rules for Ship Navigation Equipment
- 3.4.1 North America
- 3.5 Porter's analysis
- 3.6 PESTEL analysis
- 3.7 Technology and innovation landscape
- 3.7.1 Current technological trends
- 3.7.2 Emerging technologies
- 3.8 Cost breakdown analysis
- 3.9 Patent analysis
- 3.10 Sustainability and environmental aspects
- 3.10.1 Sustainable practices
- 3.10.2 Waste reduction strategies
- 3.10.3 Energy efficiency in production
- 3.10.4 Eco-friendly Initiatives
- 3.11 Future market outlook & opportunities
- 3.12 Pricing, Commercial & Contracting Models
- 3.12.1 Hardware pricing (bridge consoles, sensors, displays)
- 3.12.2 Software license models (per vessel / per module)
- 3.12.3 Service & AMC contracts (5-20 year lifecycle)
- 3.12.4 OEM bundle pricing vs modular upgrades
- 3.12.5 Defense procurement vs commercial shipping pricing
- 3.13 Installation Economics & Lifecycle Cost Analysis
- 3.13.1 Newbuild IBS installation cost structure
- 3.13.2 Retrofit integration costs & risks
- 3.13.3 Calibration, training & certification costs
- 3.13.4 Software updates & recurring OPEX
- 3.14 Newbuild vs Retrofit Adoption Analysis
- 3.14.1 Retrofit demand by ship age & class
- 3.14.2 Regulatory-driven retrofit cycles
- 3.14.3 ROI comparison: retrofit vs full replacement
- 3.15 Buyer & Procurement Decision Dynamics
- 3.16 Cybersecurity & Functional Safety Economics
Chapter 4 Competitive Landscape, 2025
- 4.1 Introduction
- 4.2 Company market share analysis
- 4.2.1 North America
- 4.2.2 Europe
- 4.2.3 Asia Pacific
- 4.2.4 LATAM
- 4.2.5 MEA
- 4.3 Competitive analysis of major market players
- 4.4 Competitive positioning matrix
- 4.5 Strategic outlook matrix
- 4.6 Key developments
- 4.6.1 Mergers & acquisitions
- 4.6.2 Partnerships & collaborations
- 4.6.3 New Product Launches
- 4.6.4 Expansion Plans and funding
Chapter 5 Market Estimates & Forecast By Component, 2022 - 2035 ($Bn)
- 5.1 Key trends
- 5.2 Hardware
- 5.2.1 Displays
- 5.2.2 Control Unit
- 5.2.3 Data Storage Devices
- 5.2.4 Sensors
- 5.2.5 Alarms
- 5.2.6 Others
- 5.3 Software
- 5.4 Services
- 5.4.1 Professional services
- 5.4.2 Managed services
Chapter 6 Market Estimates & Forecast, By Ship, 2022 - 2035 ($Bn)
- 6.1 Key trends
- 6.2 Commercial Ship
- 6.3 Defense Ship
Chapter 7 Market Estimates & Forecast, By Sub system, 2022 - 2035 ($Bn)
- 7.1 Key trends
- 7.2 INS
- 7.3 Automatic Weather Observation System (AWOS)
- 7.4 Voyage Data Recorder
- 7.5 Automatic Identification System (AIS)
Chapter 8 Market Estimates & Forecast, By End use, 2022 - 2035 ($Bn)
- 8.1 Key trends
- 8.2 OEM
- 8.3 Aftermarket
Chapter 9 Market Estimates & Forecast, By Level of Integration, 2022 - 2035 ($Bn)
- 9.1 Key trends
- 9.2 Partial
- 9.3 Fully
Chapter 10 Market Estimates & Forecast, By Region, 2022 - 2035 ($Bn)
- 10.1 Key trends
- 10.2 North America
- 10.2.1 US
- 10.2.2 Canada
- 10.3 Europe
- 10.3.1 Germany
- 10.3.2 UK
- 10.3.3 France
- 10.3.4 Italy
- 10.3.5 Spain
- 10.3.6 Russia
- 10.3.7 Nordics
- 10.3.8 Portugal
- 10.3.9 Croatia
- 10.3.10 Benelux
- 10.4 Asia Pacific
- 10.4.1 China
- 10.4.2 India
- 10.4.3 Japan
- 10.4.4 Australia
- 10.4.5 South Korea
- 10.4.6 Singapore
- 10.4.7 Thailand
- 10.4.8 Indonesia
- 10.4.9 Vietnam
- 10.5 Latin America
- 10.5.1 Brazil
- 10.5.2 Mexico
- 10.5.3 Argentina
- 10.5.4 Colombia
- 10.6 MEA
- 10.6.1 South Africa
- 10.6.2 Saudi Arabia
- 10.6.3 UAE
- 10.6.4 Turkey
Chapter 11 Company Profiles
- 11.1 Global Players
- 11.1.1 Consilium
- 11.1.2 Furuno Electric
- 11.1.3 Hensoldt
- 11.1.4 Kongsberg Gruppen
- 11.1.5. L3 Harris Technologies
- 11.1.6 Mitsubishi Electric
- 11.1.7 Northrop Grumman
- 11.1.8 Rolls-Royce
- 11.1.9 Sperry Marine
- 11.1.10 Wartsila
- 11.2 Regional Players
- 11.2.1 Alphatron Marine
- 11.2.2 Beier Integrated Systems
- 11.2.3 Japan Radio Company (JRC)
- 11.2.4 Naudeq
- 11.2.5 Norwegian Electric Systems
- 11.2.6 Praxis Automation Technology
- 11.2.7 Prime Mover Controls
- 11.2.8 Tokyo Keiki
- 11.3 Emerging / Disruptor Players
- 11.3.1 ComNav Marine
- 11.3.2 Hatteland Technology
- 11.3.3 Høglund Marine Automation
- 11.3.4 Mackay Marine
- 11.3.5 Marine Technologies
- 11.3.6 Naval Group Navigation Systems
- 11.3.7 Raytheon Anschutz
- 11.3.8 Saab Marine Electronics
- 11.3.9 Tokyo Sensor
- 11.3.10 Trelleborg Marine Systems
 整合舰桥系统市场:按组件类型、整合等级、安装类型和船舶类型划分 - 全球市场预测 2026-2032 年
 2026年全球综合桥樑系统市场报告
 船舶综合桥樑系统市场-全球产业规模、份额、趋势、机会及预测(按子系统、船舶类型、应用、地区及竞争格局划分,2021-2031年)
 整合桥樑系统市场规模、份额和成长分析(按组件、船舶类型、子系统、最终用途和地区划分)—产业预测(2026-2033 年)
 全球整合舰桥系统市场规模、份额、产业分析报告(按子系统、组件、平台和地区分類的展望和预测,2025-2032 年)
 整合舰桥系统市场规模、份额、趋势分析报告:按组件、子系统、平台、地区、细分市场预测,2025-2030 年美国整合驾驶台系统市场规模、份额、趋势分析报告:按组件、子系统、平台、细分市场预测、主要企业、竞争分析,2025-2030 年
 整合舰桥系统的全球市场:市场规模·占有率·趋势,产业分析 (各零件·子系统·各平台·各终端用户·各地区),未来预测 (2025年~2034年)