


 |
市场调查报告书
商品编码
1936674
乙醇胺市场机会、成长要素、产业趋势分析及2026年至2035年预测Ethanolamines Market Opportunity, Growth Drivers, Industry Trend Analysis, and Forecast 2026 - 2035 |
||||||
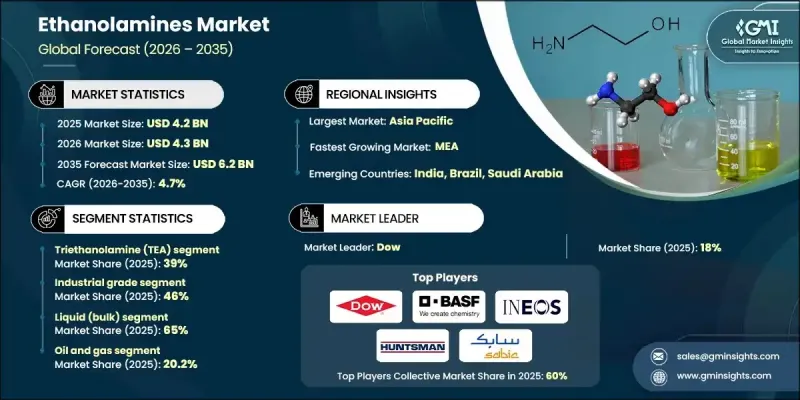
全球乙醇胺市场预计到 2025 年将达到 42 亿美元,到 2035 年将达到 62 亿美元,年复合成长率为 4.7%。
过去四年,受疫情后建筑化学品、清洁剂和气体处理应用领域需求成长的推动,乙醇胺的需求稳定成长。预计2021年至2025年全球化学品产量将持续成长,国际能源总署(IEA)等机构强调清洁化学品消费的强劲成长,而清洁化学品正是单乙醇胺(MEA)、二乙醇胺(DEA)和三乙醇胺(TEA)的主要市场。化学品生产的持续成长主要由界面活性剂和清洁剂的生产所驱动。疫情期间对卫生和清洁产品的需求激增,在疫情后依然持续,并维持着较高的消费水准。乙醇胺是生产非离子和阴离子界面活性剂的重要原料,这些界面活性剂广泛应用于工业和商用清洁剂、个人保健产品及其他清洁产品。中国、印度和东南亚国家的快速工业成长推动了下游应用领域的扩张,例如化肥、水泥、油漆和清洁产品,使亚太地区成为规模最大、成长最快的乙醇胺市场。同时,在有利的环境法规和政策的推动下,北美和欧洲的效率提升趋势带来了稳定成长。儘管石油天然气、建筑和工业清洗等产业采用了专门的乙醇胺基气体处理解决方案,但这些领域对整体市场成长的贡献甚微,仍有一定的市场缺口。
| 市场覆盖范围 | |
|---|---|
| 开始年份 | 2025 |
| 预测年份 | 2026-2035 |
| 起始值 | 42亿美元 |
| 预测金额 | 62亿美元 |
| 复合年增长率 | 4.7% |
三乙醇胺 (TEA) 占据了 39% 的市场份额,预计到 2035 年将以 4.3% 的复合年增长率增长。乙醇胺市场正逐步从以销售为导向、以大宗商品为基础的模式转向以明确产品功能为导向的更具针对性的模式。单乙醇胺 (MEA) 在气体处理和农业化学品领域仍然至关重要,而二乙醇胺 (DEA) 和三乙醇胺 (TEA) 在表面活性剂、清洁剂和个人护理用品领域中则发挥关键作用。 TEA 的用途尤其广泛,在多种配方中可用作中和剂、乳化剂和 pH 调节剂,使其成为众多化学过程中的多功能成分。
液态(散装)乙醇胺占据了65%的市场份额,预计到2035年将以4.6%的复合年增长率成长。散装液态乙醇胺广泛应用于多个产业,包括气体处理、清洁剂、农药和水泥添加剂。管道、散装卡车和ISO罐等物流解决方案有助于大型用户优化成本。许多製造商现在提供乙醇胺水溶液或混合溶液,这简化了现场操作,提高了计量效率,并确保工业工厂、炼油厂和大型综合运营商符合安全标准。
预计到2025年,北美乙醇胺市场规模将达到9.21亿美元,2035年将成长至13亿美元。这一增长主要由天然气加工、清洁剂和下游化工应用推动。该地区拥有成熟的天然气加工基础设施、成熟的工业和家用清洁市场以及严格的产品性能法规,这些都支撑了对单乙醇胺(MEA)、二乙醇胺(DEA)和三乙醇胺(TEA)的稳定需求。
目录
第一章调查方法和范围
第二章执行摘要
第三章业界考察
- 生态系分析
- 供应商情况
- 利润率
- 每个阶段的附加价值
- 影响价值链的因素
- 中断
- 产业影响因素
- 司机
- 天然气加工需求不断成长
- 清洁和个人护理中表面活性剂的使用量增加
- 亚太地区基础建设和建筑业成长
- 产业潜在风险与挑战
- 乙烯和氨原料价格波动
- 关于缉毒署使用的环境与健康问题
- 市场机会
- 中东和亚洲天然气计划的扩张
- 开发生物基和低VOC配方
- 司机
- 成长潜力分析
- 监管环境
- 北美洲
- 欧洲
- 亚太地区
- 拉丁美洲
- 中东和非洲
- 波特五力分析
- PESTEL 分析
- 价格趋势
- 按地区
- 依产品类型
- 未来市场趋势
- 科技与创新趋势
- 当前技术趋势
- 新兴技术
- 专利状态
- 贸易统计(HS编码)(註:仅提供主要国家的贸易统计)
- 主要进口国
- 主要出口国
- 永续性和环境方面
- 永续努力
- 减少废弃物策略
- 生产中的能源效率
- 环保倡议
- 考虑到碳足迹
第四章 竞争情势
- 介绍
- 公司市占率分析
- 按地区
- 北美洲
- 欧洲
- 亚太地区
- 拉丁美洲
- 中东和非洲
- 按地区
- 企业矩阵分析
- 主要市场公司的竞争分析
- 竞争定位矩阵
- 重大进展
- 併购
- 伙伴关係与合作
- 新产品发布
- 业务拓展计划
第五章 依产品类型分類的市场估算与预测,2022-2035年
- 单乙醇胺(MEA)
- 二乙醇胺(DEA)
- 三乙醇胺(TEA)
- 其他乙醇胺衍生物
第六章 各等级市场估算与预测,2022-2035年
- 技术级
- 工业级
- 高纯度
- 特殊用途/定製配方
第七章 按类型分類的市场估计与预测,2022-2035年
- 液体(散装)
- 溶液/水性混合物
- 固体/片状物(如适用)
第八章 依最终用途分類的市场估算与预测,2022-2035年
- 石油和天然气
- 化学品和石油化工
- 家用和工业清洁剂
- 个人护理和化妆品
- 农业
- 金属加工和汽车产业
- 製药和医疗保健
- 纸浆和造纸
- 其他工业和特殊用途
第九章 2022-2035年各地区市场估算与预测
- 北美洲
- 我们
- 加拿大
- 欧洲
- 德国
- 英国
- 法国
- 西班牙
- 义大利
- 其他欧洲地区
- 亚太地区
- 中国
- 印度
- 日本
- 澳洲
- 韩国
- 亚太其他地区
- 拉丁美洲
- 巴西
- 墨西哥
- 阿根廷
- 其他拉丁美洲地区
- 中东和非洲
- 沙乌地阿拉伯
- 南非
- 阿拉伯聯合大公国
- 其他中东和非洲地区
第十章:公司简介
- Dow
- BASF SE
- INEOS Group
- Huntsman Corporation
- SABIC
- Eastman Chemical Company
- Nippon Shokubai Co., Ltd.
- LyondellBasell Industries
- India Glycols Limited
- Reliance Industries Limited
- Sinopec
- Mitsubishi Chemical Corporation
- PCC Rokita SA
- Saudi Kayan Petrochemical Company
- Thai Ethanolamines Co., Ltd.
- Aceto GmbH
The Global Ethanolamines Market was valued at USD 4.2 billion in 2025 and is estimated to grow at a CAGR of 4.7% to reach USD 6.2 billion by 2035.
Over the past four years, demand has steadily increased due to the post-pandemic rise in construction chemicals, detergents, and gas treatment applications. Global chemical production expanded between 2021 and 2025, with organizations like the International Energy Agency highlighting strong growth in the consumption of cleaning chemicals, which constitute the primary markets for monoethanolamine (MEA), diethanolamine (DEA), and triethanolamine (TEA). The consistent rise in chemical manufacturing has largely been driven by the production of surfactants and detergents. Pandemic-related surges in hygiene and cleaning product demand persisted into the post-pandemic period, maintaining high consumption levels. Ethanolamines are essential ingredients in creating non-ionic and anionic surfactants, which are widely used in industrial and institutional cleaning solutions, personal care formulations, and other cleaning products. Rapid industrial growth in countries such as China, India, and across Southeast Asia has fueled expansion in downstream applications like fertilizers, cement, coatings, and cleaning products, making the Asia Pacific region the largest and fastest-growing ethanolamines market. Meanwhile, North America and Europe experienced steady, efficiency-driven growth due to moderate environmental regulations and energy-transition policies. In industries such as oil and gas, construction, and industrial cleaning, specialized ethanolamine-based gas treatment solutions were used, but these sectors contributed modestly to overall market growth, leaving certain market gaps.
| Market Scope | |
|---|---|
| Start Year | 2025 |
| Forecast Year | 2026-2035 |
| Start Value | $4.2 Billion |
| Forecast Value | $6.2 Billion |
| CAGR | 4.7% |
The triethanolamine (TEA) segment accounted for 39% share and is expected to grow at a CAGR of 4.3% by 2035. The ethanolamines market is gradually shifting from a volume-driven, commodity-based model to a more targeted approach with defined product roles. MEA continues to be indispensable in gas treatment and agricultural chemicals, while DEA and TEA are critical for surfactants, detergents, and personal care applications. TEA is particularly versatile, serving as a neutralizer, emulsifier, and pH adjuster in a wide range of formulations, making it a multifunctional component for numerous chemical processes.
The liquid (bulk) segment held 65% share and is projected to grow at a CAGR of 4.6% by 2035. Bulk liquid ethanolamines serve multiple industries, including gas treatment, detergents, agricultural chemicals, and cement additives. Logistics solutions such as pipelines, bulk trucks, and ISO tanks help optimize costs for large-scale consumers. Many producers are now providing ethanolamines as aqueous blends or solutions, which simplifies on-site handling, improves dosing efficiency, and ensures compliance with safety standards for industrial plants, refineries, and large integrators.
North America Ethanolamines Market reached USD 921 million in 2025 and is expected to grow to USD 1.3 billion by 2035. The growth is primarily driven by gas treatment, detergents, and downstream chemical applications. The region benefits from mature gas processing infrastructure, established industrial and household cleaning markets, and stringent product-performance regulations, which sustain steady demand for MEA, DEA, and TEA.
Key players in the Global Ethanolamines Market include BASF SE, Dow, INEOS Group, Huntsman Corporation, SABIC, Eastman Chemical Company, Nippon Shokubai Co., Ltd., LyondellBasell Industries, Reliance Industries Limited, India Glycols Limited, Sinopec, Mitsubishi Chemical Corporation, PCC Rokita SA, Saudi Kayan Petrochemical Company, Thai Ethanolamines Co., Ltd., and Aceto GmbH. Companies in the ethanolamines market are adopting several strategic measures to strengthen their position and expand market reach. These include forming partnerships and alliances with chemical and industrial manufacturers to enhance product integration, investing heavily in research and development for next-generation ethanolamine products, and improving production efficiencies to reduce costs. Firms are also focusing on regional expansion in high-growth markets, acquiring smaller specialty chemical companies, and offering tailored, high-performance solutions for specific applications.
Table of Contents
Chapter 1 Methodology & Scope
- 1.1 Market scope and definition
- 1.2 Research design
- 1.2.1 Research approach
- 1.2.2 Data collection methods
- 1.3 Data mining sources
- 1.3.1 Global
- 1.3.2 Regional/Country
- 1.4 Base estimates and calculations
- 1.4.1 Base year calculation
- 1.4.2 Key trends for market estimation
- 1.5 Primary research and validation
- 1.5.1 Primary sources
- 1.6 Forecast model
- 1.7 Research assumptions and limitations
Chapter 2 Executive Summary
- 2.1 Industry 3600 synopsis
- 2.2 Key market trends
- 2.2.1 Regional
- 2.2.2 Product Type
- 2.2.3 Grade
- 2.2.4 Form
- 2.2.5 End Use
- 2.3 TAM Analysis, 2026-2035
- 2.4 CXO perspectives: Strategic imperatives
- 2.4.1 Executive decision points
- 2.4.2 Critical success factors
- 2.5 Future Outlook and Strategic Recommendations
Chapter 3 Industry Insights
- 3.1 Industry ecosystem analysis
- 3.1.1 Supplier landscape
- 3.1.2 Profit margin
- 3.1.3 Value addition at each stage
- 3.1.4 Factor affecting the value chain
- 3.1.5 Disruptions
- 3.2 Industry impact forces
- 3.2.1 Growth drivers
- 3.2.1.1 Growing gas treating demand in natural gas processing
- 3.2.1.2 Rising surfactant use in cleaning and personal care
- 3.2.1.3 Infrastructure and construction growth in Asia Pacific
- 3.2.2 Industry pitfalls and challenges
- 3.2.2.1 Volatile ethylene and ammonia feedstock prices
- 3.2.2.2 Environmental and health concerns around DEA usage
- 3.2.3 Market opportunities
- 3.2.3.1 Expansion of gas projects in Middle East and Asia
- 3.2.3.2 Development of bio-based and low-VOC formulations
- 3.2.1 Growth drivers
- 3.3 Growth potential analysis
- 3.4 Regulatory landscape
- 3.4.1 North America
- 3.4.2 Europe
- 3.4.3 Asia Pacific
- 3.4.4 Latin America
- 3.4.5 Middle East & Africa
- 3.5 Porter's analysis
- 3.6 PESTEL analysis
- 3.7 Price trends
- 3.7.1 By region
- 3.7.2 By Product type
- 3.8 Future market trends
- 3.9 Technology and Innovation landscape
- 3.9.1 Current technological trends
- 3.9.2 Emerging technologies
- 3.10 Patent Landscape
- 3.11 Trade statistics (HS code) ( Note: the trade statistics will be provided for key countries only)
- 3.11.1 Major importing countries
- 3.11.2 Major exporting countries
- 3.12 Sustainability and environmental aspects
- 3.12.1 Sustainable practices
- 3.12.2 Waste reduction strategies
- 3.12.3 Energy efficiency in production
- 3.12.4 Eco-friendly initiatives
- 3.13 Carbon footprint consideration
Chapter 4 Competitive Landscape, 2025
- 4.1 Introduction
- 4.2 Company market share analysis
- 4.2.1 By region
- 4.2.1.1 North America
- 4.2.1.2 Europe
- 4.2.1.3 Asia Pacific
- 4.2.1.4 LATAM
- 4.2.1.5 MEA
- 4.2.1 By region
- 4.3 Company matrix analysis
- 4.4 Competitive analysis of major market players
- 4.5 Competitive positioning matrix
- 4.6 Key developments
- 4.6.1 Mergers & acquisitions
- 4.6.2 Partnerships & collaborations
- 4.6.3 New Product Launches
- 4.6.4 Expansion Plans
Chapter 5 Market Estimates and Forecast, By Product Type, 2022-2035 (USD Billion) (Kilo Tons)
- 5.1 Key trends
- 5.2 Monoethanolamine (MEA)
- 5.3 Diethanolamine (DEA)
- 5.4 Triethanolamine (TEA)
- 5.5 Other ethanolamine derivatives
Chapter 6 Market Estimates and Forecast, By Grade, 2022-2035 (USD Billion) (Kilo Tons)
- 6.1 Key trends
- 6.2 Technical grade
- 6.3 Industrial grade
- 6.4 High-purity grade
- 6.5 Specialty / customized formulations
Chapter 7 Market Estimates and Forecast, By Form, 2022-2035 (USD Billion) (Kilo Tons)
- 7.1 Key trends
- 7.2 Liquid (bulk)
- 7.3 Solution / aqueous blends
- 7.4 Solid / flakes (where applicable)
Chapter 8 Market Estimates and Forecast, By End Use, 2022-2035 (USD Billion) (Kilo Tons)
- 8.1 Key trends
- 8.2 Oil and gas
- 8.3 Chemicals and petrochemicals
- 8.4 Home and industrial cleaning
- 8.5 Personal care and cosmetics
- 8.6 Agriculture
- 8.7 Metalworking and automotive
- 8.8 Pharmaceuticals and healthcare
- 8.9 Paper and pulp
- 8.10 Other industrial and specialty end uses
Chapter 9 Market Estimates and Forecast, By Region, 2022-2035 (USD Billion) (Kilo Tons)
- 9.1 Key trends
- 9.2 North America
- 9.2.1 U.S.
- 9.2.2 Canada
- 9.3 Europe
- 9.3.1 Germany
- 9.3.2 UK
- 9.3.3 France
- 9.3.4 Spain
- 9.3.5 Italy
- 9.3.6 Rest of Europe
- 9.4 Asia Pacific
- 9.4.1 China
- 9.4.2 India
- 9.4.3 Japan
- 9.4.4 Australia
- 9.4.5 South Korea
- 9.4.6 Rest of Asia Pacific
- 9.5 Latin America
- 9.5.1 Brazil
- 9.5.2 Mexico
- 9.5.3 Argentina
- 9.5.4 Rest of Latin America
- 9.6 Middle East and Africa
- 9.6.1 Saudi Arabia
- 9.6.2 South Africa
- 9.6.3 UAE
- 9.6.4 Rest of Middle East and Africa
Chapter 10 Company Profiles
- 10.1 Dow
- 10.2 BASF SE
- 10.3 INEOS Group
- 10.4 Huntsman Corporation
- 10.5 SABIC
- 10.6 Eastman Chemical Company
- 10.7 Nippon Shokubai Co., Ltd.
- 10.8 LyondellBasell Industries
- 10.9 India Glycols Limited
- 10.10 Reliance Industries Limited
- 10.11 Sinopec
- 10.12 Mitsubishi Chemical Corporation
- 10.13 PCC Rokita SA
- 10.14 Saudi Kayan Petrochemical Company
- 10.15 Thai Ethanolamines Co., Ltd.
- 10.16 Aceto GmbH
 2026年全球单乙醇胺市场报告
 单乙醇胺市场规模、份额和成长分析(按类型、应用、通路、形态、等级和地区划分)-2026-2033年产业预测
 三乙醇胺 (TEA) 市场规模、占有率、成长、全球产业分析:按类型、应用和地区划分的见解、预测(2026-2034 年)
 乙醇胺市场规模、份额和成长分析(按类型、应用、最终用途产业和地区划分)-2026-2033年产业预测
 氨基乙基乙醇胺市场规模、份额和成长分析(按等级、应用、形态、销售管道和地区划分)-2026-2033年产业预测
 椰油酰胺甲基MEA - 全球市场份额和排名、总收入和需求预测(2025-2031年)
 全球乙醇胺市场:产能、需求、平均价格及产业展望(至2034年)
 乙醇胺:市场份额分析、行业趋势、统计数据和成长预测(2025-2030 年)
 乙醇胺市场按产品类型、应用和地区划分
 胺基市场规模、份额、趋势分析报告:按等级、应用、地区、细分市场预测,2025-2030 年