


 |
市场调查报告书
商品编码
1959270
2026-2035年减糖膳食纤维成分的市场机会、成长要素、产业趋势分析及预测Fiber Ingredients for Sugar Reduction Market Opportunity, Growth Drivers, Industry Trend Analysis, and Forecast 2026 - 2035 |
||||||
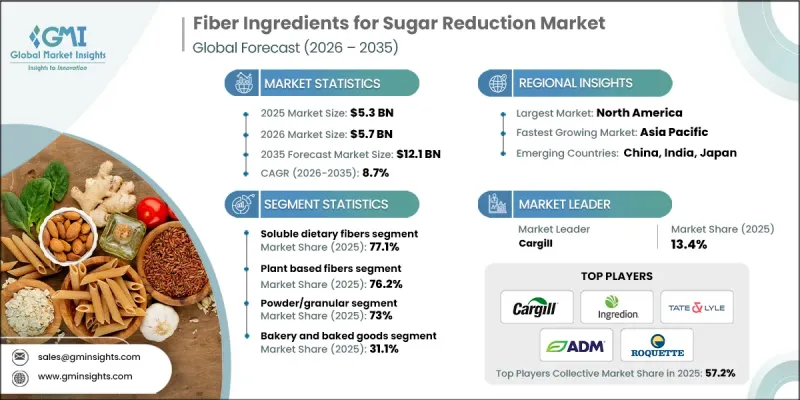
2025 年全球用于减糖的膳食纤维成分市场价值为 53 亿美元,预计到 2035 年将达到 121 亿美元,年复合成长率为 8.7%。
全球健康意识的增强以及人们对过量摄取糖分负面影响的日益关注,推动了市场成长。消费者越来越倾向于选择既能提供甜味和口感,又不牺牲营养价值的产品。富含膳食纤维的成分因其能够改善口感、平衡甜味感知、提升整体感官品质,同时提供极低的热量和血糖生成指数,而被广泛接受为一种有效的减糖方案。这些成分还有助于开发机能性食品,以满足维持消化健康、代谢平衡和体重管理等目标。对于食品饮料生产商而言,无需使用人工甜味剂即可实现洁净标示配方的能力尤其具有吸引力。儘管监管部门日益加强要求减少加工食品中的糖分,进一步刺激了市场需求,但持续的配方创新正在拓展其在各类产品类型中的应用潜力。
| 市场范围 | |
|---|---|
| 开始年份 | 2025 |
| 预测年份 | 2026-2035 |
| 起始金额 | 53亿美元 |
| 预测金额 | 121亿美元 |
| 复合年增长率 | 8.7% |
预计到2025年,水溶性膳食纤维市占率将达到77.1%,并在2035年之前以8.7%的复合年增长率成长。消费者对健康营养和预防医学日益增长的兴趣是推动该细分市场需求的主要因素。水溶性膳食纤维广泛应用于机能性食品、饮料和营养配方中,因为它有助于控制胆固醇、调节血糖值和维持消化器官系统平衡。其功能多样性和对不同配方的适应性持续推动着整个行业的高普及率。
预计到2025年,植物来源纤维市占率将达到76.2%,并在2026年至2035年间以8.8%的复合年增长率成长。源自谷物、豆类、水果和根茎类的纤维因其广泛的来源和功能性而保持市场主导地位。消费者对兼具营养和感官益处的纤维需求日益增长,尤其是那些具有益生元特性和天然甜味的纤维。丰富的植物来源原料使生产商能够满足各种配方需求,同时也能满足消费者对天然且易于识别的成分的期望。
预计到2025年,北美减糖膳食纤维配料市场份额将达到36%。消费者营养意识的提高,以及功能性食品饮料产业的蓬勃发展,正在推动该地区市场的扩张。先进的加工能力和持续的产品创新进一步促进了美国和加拿大市场的繁荣发展。
目录
第一章:调查方法和范围
第二章执行摘要
第三章业界考察
- 生态系分析
- 供应商情况
- 利润率
- 每个阶段增加的价值
- 影响价值链的因素
- 中断
- 影响产业的因素
- 促进因素
- 产业潜在风险与挑战
- 市场机会
- 成长潜力分析
- 监理情势
- 波特五力分析
- PESTEL 分析
- 价格趋势
- 按地区
- 按类型
- 未来市场趋势
- 科技与创新趋势
- 当前技术趋势
- 新兴技术
- 专利状态
- 贸易统计(HS编码)
- 主要进口国
- 主要出口国
- 永续性和环境方面
- 永续倡议
- 减少废弃物策略
- 生产中的能源效率
- 具有环保意识的倡议
- 考虑碳足迹
第四章 竞争情势
- 介绍
- 企业市占率分析
- 按地区
- 北美洲
- 欧洲
- 亚太地区
- 拉丁美洲
- 中东和非洲
- 按地区
- 公司矩阵分析
- 主要市场公司的竞争分析
- 竞争定位矩阵
- 主要进展
- 併购
- 伙伴关係与合作
- 新产品发布
- 业务拓展计划
第五章 市场估算与预测:依纺织品类型划分,2022-2035年
- 水溶性膳食纤维
- 不溶性膳食纤维
第六章 市场估算与预测:依原料划分,2022-2035年
- 植物来源纤维
- 谷物衍生纤维
- 豆类纤维
- 根和块茎纤维
- 水果来源的纤维
- 其他的
- 合成纤维和加工纤维
- 聚葡萄糖
- 不可消化的麦芽糊精
- 产酵素纤维
- 半乳寡糖(GOS)
- 寡果醣(FOS)
- 其他的
第七章 市场估计与预测:依类型划分,2022-2035年
- 粉末/颗粒
- 液体/糖浆
第八章 市场估计与预测:依应用领域划分,2022-2035年
- 烘焙点心
- 麵包捲
- 蛋糕和酥皮点心
- 饼干和曲奇
- 谷物棒/点心棒
- 饮料
- 乳製品和冷冻甜点
- 糖果甜点
- 巧克力和巧克力糖果甜点
- 糖果甜点和软糖
- 特殊营养食品
- 营养补充品
- 医用营养食品
- 运动营养
- 体重管理产品
- 其他的
第九章 市场估计与预测:依地区划分,2022-2035年
- 北美洲
- 我们
- 加拿大
- 欧洲
- 德国
- 英国
- 法国
- 西班牙
- 义大利
- 其他欧洲地区
- 亚太地区
- 中国
- 印度
- 日本
- 澳洲
- 韩国
- 亚太其他地区
- 拉丁美洲
- 巴西
- 墨西哥
- 阿根廷
- 其他拉丁美洲地区
- 中东和非洲
- 沙乌地阿拉伯
- 南非
- 阿拉伯聯合大公国
- 其他中东和非洲地区
第十章:公司简介
- ADM
- BENEO
- BioNeutra
- Cargill
- Ingredion
- Kerry Group
- Nexira
- Roquette
- Sensus
- Tate & Lyle
The Global Fiber Ingredients for Sugar Reduction Market was valued at USD 5.3 billion in 2025 and is estimated to grow at a CAGR of 8.7% to reach USD 12.1 billion by 2035.
Market growth is driven by a strong global shift toward healthier eating habits and rising awareness of the negative effects of excess sugar consumption. Consumers are increasingly seeking products that deliver sweetness and texture without compromising nutritional value. Fiber-based ingredients are gaining widespread adoption as effective sugar-reduction solutions because they enhance mouthfeel, balance sweetness perception, and improve overall sensory quality while contributing minimal calories and low glycemic impact. These ingredients also support the development of functional food products aligned with digestive wellness, metabolic balance, and weight management goals. Their ability to deliver clean-label formulations without artificial sweeteners makes them particularly attractive to food and beverage manufacturers. Growing regulatory pressure to reduce sugar levels in packaged foods is further accelerating demand, while continuous formulation innovation is expanding application potential across a broad range of product categories.
| Market Scope | |
|---|---|
| Start Year | 2025 |
| Forecast Year | 2026-2035 |
| Start Value | $5.3 Billion |
| Forecast Value | $12.1 Billion |
| CAGR | 8.7% |
The soluble dietary fibers segment accounted for 77.1% share in 2025 and is expected to grow at a CAGR of 8.7% through 2035. Demand for this segment is supported by increasing consumer focus on wellness-oriented nutrition and preventive health. Soluble fibers are widely incorporated into functional foods, beverages, and nutrition-focused formulations due to their role in supporting cholesterol management, blood sugar regulation, and digestive balance. Their functional versatility and compatibility with diverse formulations continue to drive strong adoption across the industry.
The plant-based fibers segment held a 76.2% share in 2025 and is forecast to grow at a CAGR of 8.8% from 2026 to 2035. Market leadership is sustained by the broad availability and functionality of fibers sourced from grains, legumes, fruits, and root crops. Demand is rising for fibers that deliver both nutritional and sensory benefits, particularly those offering prebiotic functionality and naturally derived sweetness. This diversity of plant-based sources enables manufacturers to address varying formulation needs while meeting consumer expectations for natural and recognizable ingredients.
North America Fiber Ingredients for Sugar Reduction Market held 36% share in 2025. High consumer awareness around nutrition, coupled with a strong functional food and beverage sector, supports regional expansion. Advanced processing capabilities and continuous product innovation further strengthen market development across the United States and Canada.
Key companies operating in the Global Fiber Ingredients for Sugar Reduction Market include Tate & Lyle, ADM, Ingredion, Cargill, BENEO, Roquette, Kerry Group, Nexira, Sensus, and BioNeutra. Companies in the fiber ingredients for sugar reduction market are strengthening their market foothold through sustained investment in research and development aimed at improving taste, texture, and formulation performance. Many players are expanding their portfolios with clean-label and multifunctional fiber solutions to meet evolving consumer and regulatory demands. Strategic collaborations with food and beverage manufacturers are being used to accelerate innovation and application development. Capacity expansion, supply chain optimization, and sourcing transparency are also key priorities. Firms are increasingly focusing on sustainability initiatives and regulatory compliance to enhance brand trust, while geographic expansion into high-growth regions supports long-term competitive positioning.
Table of Contents
Chapter 1 Methodology & Scope
- 1.1 Market scope and definition
- 1.2 Research design
- 1.2.1 Research approach
- 1.2.2 Data collection methods
- 1.3 Data mining sources
- 1.3.1 Global
- 1.3.2 Regional/Country
- 1.4 Base estimates and calculations
- 1.4.1 Base year calculation
- 1.4.2 Key trends for market estimation
- 1.5 Primary research and validation
- 1.5.1 Primary sources
- 1.6 Forecast model
- 1.7 Research assumptions and limitations
Chapter 2 Executive Summary
- 2.1 Industry 360° synopsis
- 2.2 Key market trends
- 2.2.1 Regional
- 2.2.2 Fiber type
- 2.2.3 Sources
- 2.2.4 Form
- 2.2.5 Application
- 2.3 TAM Analysis, 2026-2035
- 2.4 CXO perspectives: Strategic imperatives
- 2.4.1 Executive decision points
- 2.4.2 Critical success factors
- 2.5 Future Outlook and Strategic Recommendations
Chapter 3 Industry Insights
- 3.1 Industry ecosystem analysis
- 3.1.1 Supplier landscape
- 3.1.2 Profit margin
- 3.1.3 Value addition at each stage
- 3.1.4 Factor affecting the value chain
- 3.1.5 Disruptions
- 3.2 Industry impact forces
- 3.2.1 Growth drivers
- 3.2.2 Industry pitfalls and challenges
- 3.2.3 Market opportunities
- 3.3 Growth potential analysis
- 3.4 Regulatory landscape
- 3.4.1 North America
- 3.4.2 Europe
- 3.4.3 Asia Pacific
- 3.4.4 Latin America
- 3.4.5 Middle East & Africa
- 3.5 Porter's analysis
- 3.6 PESTEL analysis
- 3.7 Price trends
- 3.7.1 By region
- 3.7.2 By type
- 3.8 Future market trends
- 3.9 Technology and Innovation landscape
- 3.9.1 Current technological trends
- 3.9.2 Emerging technologies
- 3.10 Patent Landscape
- 3.11 Trade statistics (HS code)
- 3.11.1 Major importing countries
- 3.11.2 Major exporting countries
- 3.12 Sustainability and environmental aspects
- 3.12.1 Sustainable practices
- 3.12.2 Waste reduction strategies
- 3.12.3 Energy efficiency in production
- 3.12.4 Eco-friendly initiatives
- 3.13 Carbon footprint consideration
Chapter 4 Competitive Landscape, 2025
- 4.1 Introduction
- 4.2 Company market share analysis
- 4.2.1 By region
- 4.2.1.1 North America
- 4.2.1.2 Europe
- 4.2.1.3 Asia Pacific
- 4.2.1.4 LATAM
- 4.2.1.5 MEA
- 4.2.1 By region
- 4.3 Company matrix analysis
- 4.4 Competitive analysis of major market players
- 4.5 Competitive positioning matrix
- 4.6 Key developments
- 4.6.1 Mergers & acquisitions
- 4.6.2 Partnerships & collaborations
- 4.6.3 New Product Launches
- 4.6.4 Expansion Plans
Chapter 5 Market Estimates and Forecast, By Fiber Type, 2022-2035 (USD Billion) (Kilo Tons)
- 5.1 Key trends
- 5.2 Soluble dietary fibers
- 5.3 Insoluble dietary fibers
Chapter 6 Market Estimates and Forecast, By Source, 2022-2035 (USD Billion) (Kilo Tons)
- 6.1 Key trends
- 6.2 Plant-based fibers
- 6.2.1 Cereal-derived fibers
- 6.2.2 Legume-derived fibers
- 6.2.3 Root & tuber-derived fibers
- 6.2.4 Fruit-derived fibers
- 6.2.5 Others
- 6.3 Synthetic/modified fibers
- 6.3.1 Polydextrose
- 6.3.2 Resistant maltodextrin
- 6.4 Enzymatically-produced fibers
- 6.4.1 Galactooligosaccharides (GOS)
- 6.4.2 Fructooligosaccharides (FOS)
- 6.4.3 Others
Chapter 7 Market Estimates and Forecast, By Form, 2022-2035 (USD Billion) (Kilo Tons)
- 7.1 Key trends
- 7.2 Powder/granular
- 7.3 Liquid/syrup
Chapter 8 Market Estimates and Forecast, By Application, 2022-2035 (USD Billion) (Kilo Tons)
- 8.1 Key trends
- 8.2 Bakery & baked goods
- 8.2.1 Breads & rolls
- 8.2.2 Cakes & pastries
- 8.2.3 Cookies & biscuits
- 8.2.4 Cereal bars & snack bars
- 8.3 Beverages
- 8.4 Dairy & frozen desserts
- 8.5 Confectionery
- 8.5.1 Chocolate & chocolate confectionery
- 8.5.2 Sugar confectionery & gummies
- 8.6 Specialized nutrition
- 8.6.1 Dietary supplements
- 8.6.2 Medical nutrition
- 8.6.3 Sports nutrition
- 8.6.4 Weight management products
- 8.7 Others
Chapter 9 Market Estimates and Forecast, By Region, 2022-2035 (USD Billion) (Kilo Tons)
- 9.1 Key trends
- 9.2 North America
- 9.2.1 U.S.
- 9.2.2 Canada
- 9.3 Europe
- 9.3.1 Germany
- 9.3.2 UK
- 9.3.3 France
- 9.3.4 Spain
- 9.3.5 Italy
- 9.3.6 Rest of Europe
- 9.4 Asia Pacific
- 9.4.1 China
- 9.4.2 India
- 9.4.3 Japan
- 9.4.4 Australia
- 9.4.5 South Korea
- 9.4.6 Rest of Asia Pacific
- 9.5 Latin America
- 9.5.1 Brazil
- 9.5.2 Mexico
- 9.5.3 Argentina
- 9.5.4 Rest of Latin America
- 9.6 Middle East and Africa
- 9.6.1 Saudi Arabia
- 9.6.2 South Africa
- 9.6.3 UAE
- 9.6.4 Rest of Middle East and Africa
Chapter 10 Company Profiles
- 10.1 ADM
- 10.2 BENEO
- 10.3 BioNeutra
- 10.4 Cargill
- 10.5 Ingredion
- 10.6 Kerry Group
- 10.7 Nexira
- 10.8 Roquette
- 10.9 Sensus
- 10.10 Tate & Lyle

