


 |
市场调查报告书
商品编码
1959281
物联网赋能的工业压力感测器市场:机会、成长要素、产业趋势分析、预测(2026-2035年)Industrial Pressure Sensor with IoT Market Opportunity, Growth Drivers, Industry Trend Analysis, and Forecast 2026 - 2035 |
||||||
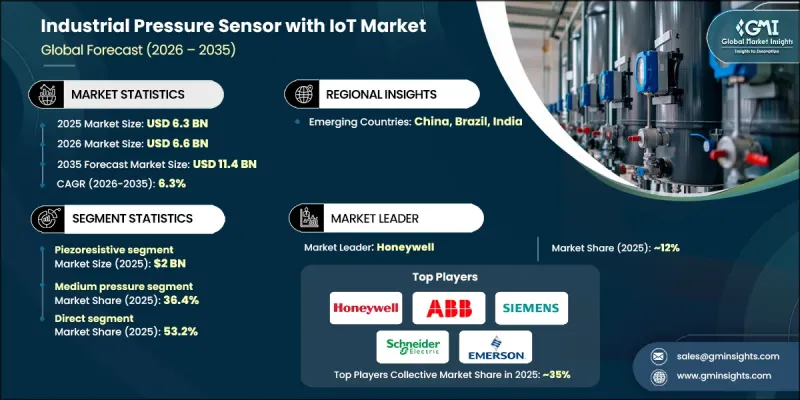
2025 年全球物联网工业压力感测器市场价值 63 亿美元,预计到 2035 年将达到 114 亿美元,年复合成长率为 6.3%。
这一增长得益于压力感测技术与自动化生产环境的融合,不间断的资料收集和分析为持续生产提供了保障。智慧压力感测器能够实现即时监控和数据驱动的决策,且不会中断生产流程。它们支援预测性维护,显着降低了设备意外故障的风险,并帮助製造商优化生产计画和库存管理。这些感测器旨在作为数位互联工厂的原生组件运行,加速向全自动化智慧生产系统的转型。更高的测量精度和一致性使製造商能够更严格地控制流程,提高产品质量,最大限度地减少材料损耗,并实现更高的效率。随着工业4.0的深入应用,物联网赋能的压力感测器正成为营运韧性和长期生产力提升的关键工具。
| 市场范围 | |
|---|---|
| 开始年份 | 2025 |
| 预测年份 | 2026-2035 |
| 起始金额 | 63亿美元 |
| 预测金额 | 114亿美元 |
| 复合年增长率 | 6.3% |
预计到2025年,压阻式感测器市场规模将达到20亿美元,并在2026年至2035年间以5.8%的复合年增长率成长。该技术凭藉其高灵敏度、稳定的性能以及即使在严苛的工作条件下也能保持一致的测量精度,在市场上占据领先地位。压阻式感测器广泛应用于需要可靠压力监测和长期可靠性的领域,而物联网在工业环境中的日益普及也推动了其持续成长。
预计到2025年,中压感测器市场份额将达到36.4%,并在2035年之前以6.8%的复合年增长率成长。此范围的感测器能够有效平衡性能、精度和系统耐久性,从而满足各种运作需求。其经济高效且功能可靠,使其成为需要稳定压力控制且系统复杂度不高的应用的首选。
美国物联网赋能的工业压力感测器市场预计到2025年将达到11亿美元,并在2026年至2035年间以5.9%的复合年增长率成长。对智慧製造的大力投资和先进数位技术的早期应用正在巩固其市场领先地位。成熟的工业基础和严格的营运标准持续推动对兼具精度、安全性和高效性的互联压力感测解决方案的需求。
目录
第一章:调查方法和范围
第二章执行摘要
第三章业界考察
- 生态系分析
- 供应商情况
- 利润率
- 每个阶段增加的价值
- 影响价值链的因素
- 影响产业的因素
- 促进因素
- 工业4.0实施现状
- 能源效率和安全法规
- 与云端和人工智慧分析的集成
- 挑战与困难
- 初始成本高且整合复杂
- 网路安全风险
- 机会
- 新兴智慧基础设施计划
- 无线和低功耗技术的进步
- 促进因素
- 成长潜力分析
- 未来市场趋势
- 科技与创新趋势
- 当前技术趋势
- 新兴技术
- 价格趋势
- 按地区
- 副产品
- 监理情势
- 北美洲
- 美国:消费品安全委员会(CPSC)联邦法规(CFR)第16篇第1512部分
- 加拿大:国际标准化组织(ISO)4210
- 欧洲
- 德国:德国标准化协会 (DIN)、欧洲标准 (EN)、ISO 4210
- 英国:欧洲标准 (EN) ISO 4210 /英国合格评定 (UKCA)
- 法国:欧洲标准 (EN) ISO 4210
- 亚太地区
- 中国:国家标准(GB)3565
- 印度:印度标准 (IS) 10613
- 日本:日本工业标准(JIS)D 9110
- 拉丁美洲
- 巴西:巴西技术标准协会 (ABNT)、巴西标准局 (NBR)、ISO 4210
- 墨西哥:国际标准化组织(ISO)4210
- 中东和非洲
- 南非:南非国家标准 (SANS) 311
- 沙乌地阿拉伯:沙乌地阿拉伯标准、计量和品质组织 (SASO)、海湾标准化组织 (GSO)、ISO 4210
- 北美洲
- 贸易统计(HS编码 - 9026.20)
- 主要进口国
- 主要出口国
- 波特的分析
- PESTEL 分析
第四章 竞争情势
- 介绍
- 企业市占率分析
- 按地区
- 北美洲
- 欧洲
- 亚太地区
- 拉丁美洲
- 中东和非洲
- 按地区
- 公司矩阵分析
- 主要市场公司的竞争分析
- 竞争定位矩阵
- 主要进展
- 併购
- 伙伴关係与合作
- 新产品发布
- 扩张计划
第五章 市场估算与预测:依感测器类型划分,2022-2035年
- 压阻式
- 电容式
- 共振类型
- 光学的
- 电磁
- 压电
第六章 市场估计与预测:依压力范围划分,2022-2035年
- 低压(低于 1,000 psi)
- 中等压力(1,000–10,000 psi)
- 高压(超过 10,000 psi)
第七章 市场估计与预测:依应用领域划分,2022-2035年
- 製程监控与控制
- 预测性保护
- 洩漏检测
- 液位测量
- 流量测量
- 暖通空调系统
- 液压/气压系统
- 环境监测
第八章 市场估算与预测:依最终用户产业划分,2022-2035年
- 商业农场
- 石油和天然气
- 製造业
- 车
- 製药
- 食品/饮料
- 供水/污水处理
- 发电
- 化学品
- 航太和国防工业
第九章 市场估价与预测:依通路划分,2022-2035年
- 直销
- 间接销售
第十章 市场估价与预测:依地区划分,2022-2035年
- 北美洲
- 我们
- 加拿大
- 欧洲
- 德国
- 英国
- 法国
- 义大利
- 西班牙
- 亚太地区
- 中国
- 印度
- 日本
- 韩国
- 澳洲
- 拉丁美洲
- 巴西
- 墨西哥
- 阿根廷
- 中东和非洲
- 沙乌地阿拉伯
- 阿拉伯聯合大公国
- 南非
第十一章:公司简介
- ABB Ltd.
- AMETEK Inc.
- Baumer Group
- Bosch Sensortec
- Emerson Electric
- Endress+Hauser Group
- Honeywell International Inc.
- Murata Manufacturing Co., Ltd.
- Omron Corporation
- Rockwell Automation
- Schneider Electric
- Siemens AG
- TDK Corporation
- TE Connectivity
- Yokogawa Electric Corp.
The Global Industrial Pressure Sensor with IoT Market was valued at USD 6.3 billion in 2025 and is estimated to grow at a CAGR of 6.3% to reach USD 11.4 billion by 2035.
Growth is driven by the integration of connected pressure-sensing technologies into automated production environments, where uninterrupted data collection and analysis support continuous operations. Smart pressure sensors enable real-time monitoring and data-driven decision-making without disrupting manufacturing workflows. Their ability to support predictive maintenance significantly lowers the risk of unexpected equipment failure, allowing manufacturers to optimize production planning and inventory management. These sensors are designed to operate as native components within digitally connected factories, accelerating the transition toward fully automated and intelligent production systems. Enhanced measurement accuracy and consistency allow manufacturers to maintain tighter process control, improve output quality, minimize material loss, and achieve higher levels of efficiency. As Industry 4.0 adoption deepens, IoT-enabled pressure sensors are becoming essential tools for achieving operational resilience and long-term productivity gains.
| Market Scope | |
|---|---|
| Start Year | 2025 |
| Forecast Year | 2026-2035 |
| Start Value | $6.3 Billion |
| Forecast Value | $11.4 Billion |
| CAGR | 6.3% |
The piezoresistive segment generated USD 2 billion in 2025 and is expected to grow at a CAGR of 5.8% from 2026 to 2035. This technology leads the market due to its strong sensitivity, stable performance, and consistent measurement accuracy in demanding operating conditions. Piezoresistive sensors are widely selected for applications that require dependable pressure monitoring and long-term reliability, supporting their continued adoption as IoT integration expands across industrial environments.
The medium pressure segment accounted for 36.4% share in 2025 and is forecast to grow at a CAGR of 6.8% through 2035. Sensors in this range address a broad spectrum of operational requirements by offering an effective balance between performance, precision, and system durability. Their cost efficiency and reliable functionality make them a preferred option for applications that demand consistent pressure control without excessive system complexity.
U.S. Industrial Pressure Sensor with IoT Market generated USD 1.1 billion in 2025 and is projected to grow at a CAGR of 5.9% from 2026 to 2035. Market leadership is supported by strong investment in smart manufacturing and early adoption of advanced digital technologies. A well-established industrial base and rigorous operational standards continue to drive demand for connected pressure sensing solutions that deliver accuracy, safety, and efficiency.
Key companies operating in the Global Industrial Pressure Sensor with IoT Market include Siemens AG, Honeywell International Inc., Schneider Electric, ABB Ltd., Yokogawa Electric Corp., Emerson Electric, TE Connectivity, Rockwell Automation, AMETEK Inc., Omron Corporation, Endress+Hauser Group, TDK Corporation, Murata Manufacturing Co., Ltd., Baumer Group, and Bosch Sensortec. Companies in the industrial pressure sensor with IoT market focus on innovation, system integration, and global expansion to strengthen their market position. Many invest in advanced sensor design to enhance accuracy, durability, and data reliability. Integration with digital platforms and analytics tools is prioritized to support predictive maintenance and real-time monitoring. Strategic partnerships help expand solution ecosystems and improve interoperability. Manufacturers also emphasize compliance with industrial standards and cybersecurity requirements to build customer confidence.
Table of Contents
Chapter 1 Methodology & Scope
- 1.1 Market scope & definitions
- 1.2 Research design
- 1.2.1 Research approach
- 1.2.2 Data collection methods
- 1.3 Base estimates and calculations
- 1.3.1 Base year calculation
- 1.3.2 Market estimates & forecasts parameters
- 1.4 Forecast Model
- 1.4.1 Key trends for market estimates
- 1.4.2 Quantified market impact analysis
- 1.4.2.1 Mathematical impact of growth parameters on forecast
- 1.4.3 Scenario analysis framework
- 1.5 Primary research and validation
- 1.5.1 Some of the primary sources (but not limited to)
- 1.6 Data mining sources
- 1.6.1 Paid Sources
- 1.7 Research Trail & confidence scoring
- 1.7.1 Research trail components
- 1.7.2 Scoring components
- 1.8 Research transparency addendum
- 1.8.1 Source attribution framework
- 1.8.2 Quality assurance metrics
- 1.8.3 Our commitment to trust
- 1.9 Market Definitions
Chapter 2 Executive Summary
- 2.1 Industry 360° synopsis
- 2.2 Key market trends
- 2.2.1 Regional
- 2.2.2 Sensor type
- 2.2.3 Pressure range
- 2.2.4 Application
- 2.2.5 End user industry
- 2.2.6 Distribution channel
- 2.3 CXO perspectives: Strategic imperatives
- 2.3.1 Key decision points for industry executives
- 2.3.2 Critical success factors for market players
- 2.4 Future outlook and strategic recommendations
Chapter 3 Industry Insights
- 3.1 Industry ecosystem analysis
- 3.1.1 Supplier landscape
- 3.1.2 Profit margin
- 3.1.3 Value addition at each stage
- 3.1.4 Factor affecting the value chain
- 3.2 Industry impact forces
- 3.2.1 Growth drivers
- 3.2.1.1 Industry 4.0 adoption
- 3.2.1.2 Energy efficiency & safety regulations
- 3.2.1.3 Integration with cloud & ai analytics
- 3.2.2 Pitfalls & Challenges
- 3.2.2.1 High initial cost & integration complexity
- 3.2.2.2 Cybersecurity risks
- 3.2.3 Opportunities
- 3.2.3.1 Emerging smart infrastructure projects
- 3.2.3.2 Advancements in wireless & low-power technologies
- 3.2.1 Growth drivers
- 3.3 Growth potential analysis
- 3.4 Future market trends
- 3.5 Technology and innovation landscape
- 3.5.1 Current technological trends
- 3.5.2 Emerging technologies
- 3.6 Price trends
- 3.6.1 By region
- 3.6.2 By product
- 3.7 Regulatory landscape
- 3.7.1 North America
- 3.7.1.1 US: Consumer Product Safety Commission (CPSC) 16 Code of Federal Regulations (CFR) part 1512
- 3.7.1.2 Canada: International Organization for Standardization (ISO) 4210
- 3.7.2 Europe
- 3.7.2.1 Germany: Deutsches Institut fur Normung (DIN) European Norm (EN) ISO 4210
- 3.7.2.2 UK: European Norm (EN) ISO 4210 / United Kingdom Conformity Assessed (UKCA)
- 3.7.2.3 France: European Norm (EN) ISO 4210
- 3.7.3 Asia Pacific
- 3.7.3.1 China: Guobiao (GB) 3565
- 3.7.3.2 India: Indian Standard (IS) 10613
- 3.7.3.3 Japan: Japanese Industrial Standard (JIS) D 9110
- 3.7.4 Latin America
- 3.7.4.1 Brazil: Associacao Brasileira de Normas Tecnicas (ABNT) Norma Brasileira (NBR) ISO 4210
- 3.7.4.2 Mexico: International Organization for Standardization (ISO) 4210
- 3.7.5 Middle East & Africa
- 3.7.5.1 South Africa: South African National Standard (SANS) 311
- 3.7.5.2 Saudi Arabia: Saudi Standards, Metrology and Quality Organization (SASO) Gulf Standardization Organization (GSO) ISO 4210
- 3.7.1 North America
- 3.8 Trade statistics (HS code- 9026.20)
- 3.8.1 Major importing countries
- 3.8.2 Major exporting countries
- 3.9 Porter’s analysis
- 3.10 PESTEL analysis
Chapter 4 Competitive Landscape, 2025
- 4.1 Introduction
- 4.2 Company market share analysis
- 4.2.1 By Region
- 4.2.1.1 North America
- 4.2.1.2 Europe
- 4.2.1.3 Asia Pacific
- 4.2.1.4 Latin America
- 4.2.1.5 Middle East & Africa
- 4.2.1 By Region
- 4.3 Company matrix analysis
- 4.4 Competitive analysis of major market players
- 4.5 Competitive positioning matrix
- 4.6 Key developments
- 4.6.1 Mergers & acquisitions
- 4.6.2 Partnerships & collaborations
- 4.6.3 New product launches
- 4.6.4 Expansion plans
Chapter 5 Market Estimates & Forecast, By Sensor Type, 2022 - 2035, (USD Billion) (Thousand Units)
- 5.1 Key trends
- 5.2 Piezoresistive
- 5.3 Capacitive
- 5.4 Resonant
- 5.5 Optical
- 5.6 Electromagnetic
- 5.7 Piezoelectric
Chapter 6 Market Estimates & Forecast, By Pressure Range, 2022 - 2035, (USD Billion) (Thousand units)
- 6.1 Key trends
- 6.2 Low Pressure (less than 1,000 psi)
- 6.3 Medium Pressure (1,000-10,000 psi)
- 6.4 High Pressure (more than 10,000 psi)
Chapter 7 Market Estimates & Forecast, By Application, 2022 - 2035, (USD Billion) (Thousand units)
- 7.1 Key trends
- 7.2 Process monitoring & control
- 7.3 Predictive maintenance
- 7.4 Leak detection
- 7.5 Level measurement
- 7.6 Flow measurement
- 7.7 Hvac systems
- 7.8 Hydraulic/pneumatic systems
- 7.9 Environmental monitoring
Chapter 8 Market Estimates & Forecast, By End User Industry, 2022 - 2035, (USD Billion) (Thousand units)
- 8.1 Key trends
- 8.2 Commercial farms
- 8.3 Oil & gas
- 8.4 Manufacturing
- 8.5 Automotive
- 8.6 Pharmaceuticals
- 8.7 Food and beverages
- 8.8 Water & wastewater
- 8.9 Power generation
- 8.10 Chemicals
- 8.11 Aerospace & defense
Chapter 9 Market Estimates & Forecast, By Distribution Channel, 2022 - 2035, (USD Billion) (Thousand Units)
- 9.1 Key trends
- 9.2 Direct
- 9.3 Indirect
Chapter 10 Market Estimates & Forecast, By Region, 2022 - 2035, (USD Billion) (Thousand Units)
- 10.1 Key trends
- 10.2 North America
- 10.2.1 U.S.
- 10.2.2 Canada
- 10.3 Europe
- 10.3.1 Germany
- 10.3.2 UK
- 10.3.3 France
- 10.3.4 Italy
- 10.3.5 Spain
- 10.4 Asia Pacific
- 10.4.1 China
- 10.4.2 India
- 10.4.3 Japan
- 10.4.4 South Korea
- 10.4.5 Australia
- 10.5 Latin America
- 10.5.1 Brazil
- 10.5.2 Mexico
- 10.5.3 Argentina
- 10.6 MEA
- 10.6.1 Saudi Arabia
- 10.6.2 UAE
- 10.6.3 South Africa
Chapter 11 Company Profiles
- 11.1 ABB Ltd.
- 11.2 AMETEK Inc.
- 11.3 Baumer Group
- 11.4 Bosch Sensortec
- 11.5 Emerson Electric
- 11.6 Endress+Hauser Group
- 11.7 Honeywell International Inc.
- 11.8 Murata Manufacturing Co., Ltd.
- 11.9 Omron Corporation
- 11.10 Rockwell Automation
- 11.11 Schneider Electric
- 11.12 Siemens AG
- 11.13 TDK Corporation
- 11.14 TE Connectivity
- 11.15 Yokogawa Electric Corp.
 2026-2030年全球物联网(IoT)安全市场
 物联网安全市场规模、份额、趋势和预测:按组件、安全类型、行业和地区划分,2026-2034 年
 物联网市场追踪:家庭安全与自动化
 2026年全球安防自动化市场报告
 物联网安全市场:按组件、安全类型、部署模式、组织规模和产业划分-2026-2032年全球市场预测2026年物联网安全全球市场报告工业键盘(带轨迹球)市场:按连接类型、工业垂直应用、安装类型、材料、防护等级、分销渠道和最终用户划分,全球预测,2026-2032年
 面向物联网设备的先进网路安全市场分析及预测(至 2035 年):按类型、产品类型、服务、技术、组件、应用、部署类型、最终用户和解决方案划分2026年全球物联网智慧压力感测器市场报告
 物联网安全市场 - 全球产业规模、份额、趋势、机会及预测(按组件、部署、公司、安全类型、应用、区域和竞争格局划分),2021-2031年