


 |
市场调查报告书
商品编码
1959591
工业感测器市场机会、成长要素、产业趋势分析及2026年至2035年预测Industrial Sensor Market Opportunity, Growth Drivers, Industry Trend Analysis, and Forecast 2026 - 2035 |
||||||
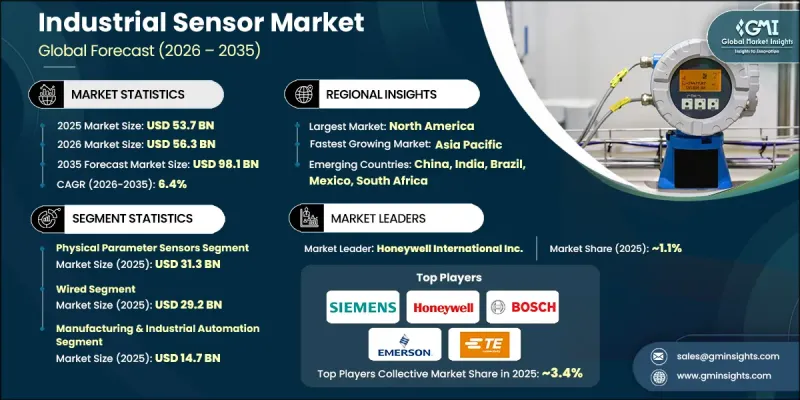
2025 年全球工业感测器市场价值为 537 亿美元,预计到 2035 年将达到 981 亿美元,年复合成长率为 6.4%。
工业感测器已成为现代製造业、能源、航太和物流运作中不可或缺的一部分,能够对机械、流程和环境状况进行精确的监控和控制。随着工业环境日益复杂和自动化,对即时数据和情境察觉的需求也日益增长。这些感测器使企业能够追踪设备性能、确保符合安全标准并维持流程效率。除了产量不断增长之外,智慧製造、工业IoT和预测性维护解决方案的日益普及也进一步推动了市场需求。如今,企业不仅依赖感测器技术来提高营运可靠性,还将其用于流程优化、早期故障检测以及与分析平台的无缝整合。对更高精度、效率和永续性的追求,持续推动全球各工业领域的创新与应用。
| 市场范围 | |
|---|---|
| 开始年份 | 2025 |
| 预测年份 | 2026-2035 |
| 起始值 | 537亿美元 |
| 预测金额 | 981亿美元 |
| 复合年增长率 | 6.4% |
预计2025年,物理参数感测器市场规模将达到313亿美元。物理参数感测器凭藉其高精度测量力、扭矩、压力、振动和温度的能力,在市场上占据领先地位。这些感测器对于防止停机、维持运作效率以及实现工业机械和生产线的预测性维护至关重要。它们在恶劣环境下的耐用性以及与自动化系统的兼容性,使其在製造业、能源和航太应用领域不可或缺。
到2025年,有线感测器市场规模将达到292亿美元。有线感测器因其可靠的数据传输、坚固耐用和抗干扰能力而备受欢迎。在工业设施、加工厂和能源企业中,有线解决方案因其能够提供不间断且准确的资料流而成为持续监控的首选。与现有自动化基础设施的兼容性确保了即使在恶劣环境下也能稳定运作。
预计到2025年,北美工业感测器市场份额将达到35.2%。这一区域成长主要得益于对智慧製造、互联工厂和工业自动化解决方案的投资。各公司正加速采用物联网、人工智慧和进阶分析技术,以优化流程、减少停机时间并提高安全性。此外,监管合规、能源效率和永续性措施也在推动高精度、特定应用感测器的应用,进一步巩固了北美在工业感测器市场的主导地位。
目录
第一章:调查方法和范围
第二章执行摘要
第三章业界考察
- 生态系分析
- 供应商情况
- 利润率分析
- 成本结构
- 每个阶段增加的价值
- 影响价值链的因素
- 中断
- 影响产业的因素
- 促进因素
- 扩大工业自动化和智慧製造的应用
- 物联网和工业物联网 (IIoT) 技术的融合
- 对预测性维护和即时监控的需求日益增长
- 拓展可再生能源和先进电力系统领域
- 严格遵守规章制度和安全标准
- 产业潜在风险与挑战
- 初始投资高且整合复杂
- 资料安全和可靠性问题
- 市场机会
- 智慧工厂和工业4.0倡议的实施
- 可再生能源和先进电力系统的扩展
- 促进因素
- 成长潜力分析
- 监管环境
- 北美洲
- 欧洲
- 亚太地区
- 拉丁美洲
- 中东和非洲
- 波特的分析
- PESTEL 分析
- 科技与创新趋势
- 当前技术趋势
- 新兴技术
- 价格趋势
- 按地区
- 副产品
- 定价策略
- 新兴经营模式
- 合规要求
- 地缘政治和贸易趋势
第四章 竞争情势
- 介绍
- 企业市占率分析
- 按地区
- 北美洲
- 欧洲
- 亚太地区
- 拉丁美洲
- 中东和非洲
- 按地区
- 主要企业的竞争标竿分析
- 财务绩效比较
- 收入
- 利润率
- 研究与开发
- 产品系列比较
- 产品线的广度
- 科技
- 创新
- 区域分布比较
- 全球扩张分析
- 服务网路覆盖
- 按地区分類的市场渗透率
- 竞争定位矩阵
- 领导企业
- 受让人
- 追踪者
- 小众玩家
- 战略展望矩阵
- 财务绩效比较
- 2022-2025 年重大发展
- 併购
- 合作伙伴关係和合资企业
- 技术进步
- 扩张和投资策略
- 数位转型计划
- 新兴/Start-Ups竞争对手的发展趋势
第五章 市场估算与预测:依感测器类型划分,2022-2035年
- 物理参数感测器
- 温度感测器
- 压力感测器
- 流量感测器
- 液位感测器
- 位置和运动感应器
- 接近感测器
- 电感式和电容式接近感测器
- 光学/光电感测器
- 环境监测感测器
- 湿度/水分感测器
- 振动/状态感测器
- 气体和化学感测器
第六章 市场估计与预测:依技术划分,2022-2035年
- 微电子机械系统(MEMS)
- 光/光子
- 电化学
- 机械的
- 电磁学
- 超音波/声学
- 其他的
第七章 市场估计与预测:以连结方式划分,2022-2035年
- 有线
- 无线的
第八章 市场估算与预测:依最终用途产业划分,2022-2035年
- 化工/石油化工
- 能源与电力
- 食品/饮料
- 製造和工业自动化
- 金属和采矿
- 石油和天然气
- 製药
- 汽车/运输设备
- 水处理和污水处理
- 其他的
第九章 市场估计与预测:依地区划分,2022-2035年
- 北美洲
- 我们
- 加拿大
- 欧洲
- 德国
- 英国
- 法国
- 西班牙
- 义大利
- 荷兰
- 亚太地区
- 中国
- 印度
- 日本
- 澳洲
- 韩国
- 拉丁美洲
- 巴西
- 墨西哥
- 阿根廷
- 中东和非洲
- 南非
- 沙乌地阿拉伯
- 阿拉伯聯合大公国
第十章:公司简介
- ABB Ltd.
- Allegro MicroSystems, Inc.
- Balluff GmbH
- Banner Engineering
- Bosch Group
- Endress+Hauser Group Services AG
- Emerson Electric Co.
- Honeywell International Inc.
- ifm electronic gmbh
- Keyence Corporation
- LEM Holding
- Melexis
- OMRON Corporation
- Panasonic Industry
- Pepperl+Fuchs SE
- Rockwell Automation, Inc.
- SICK AG
- Sensatec GmbH
- Sensata Technologies
- Schneider Electric SE
- Siemens AG
- STMicroelectronics
- TE Connectivity
- Texas Instruments
- Turck Group
The Global Industrial Sensor Market was valued at USD 53.7 billion in 2025 and is estimated to grow at a CAGR of 6.4% to reach USD 98.1 billion by 2035.
Industrial sensors have become integral to modern manufacturing, energy, aerospace, and logistics operations, enabling precise monitoring and control of machinery, processes, and environmental conditions. As industrial environments grow more complex and automated, the need for real-time data and situational awareness has intensified. These sensors allow organizations to track equipment performance, ensure safety compliance, and maintain process efficiency. Increasing production volumes, coupled with rising adoption of smart manufacturing, industrial IoT, and predictive maintenance solutions, are further boosting demand. Companies now rely on sensor technology not only for operational reliability but also for process optimization, early fault detection, and seamless integration with analytics platforms. The push for higher precision, efficiency, and sustainability continues to drive innovation and deployment across global industrial sectors.
| Market Scope | |
|---|---|
| Start Year | 2025 |
| Forecast Year | 2026-2035 |
| Start Value | $53.7 Billion |
| Forecast Value | $98.1 Billion |
| CAGR | 6.4% |
The physical parameter sensors segment generated USD 31.3 billion in 2025. Physical parameter sensors dominate due to their ability to provide high-precision measurements of force, torque, pressure, vibration, and temperature. These sensors are crucial for preventing downtime, maintaining operational efficiency, and enabling predictive maintenance in industrial machinery and production lines. Their durability in harsh conditions and compatibility with automation systems make them indispensable across manufacturing, energy, and aerospace applications.
The wired segment held USD 29.2 billion in 2025. Wired sensors remain popular due to their reliable data transmission, robustness, and resistance to interference. Industrial facilities, processing plants, and energy operations prefer wired solutions for continuous monitoring, where uninterrupted and accurate data flow is critical. Their compatibility with existing automation infrastructure ensures consistent performance in challenging environments.
North America Industrial Sensor Market accounted for 35.2% share in 2025. Growth in this region is fueled by investments in smart manufacturing, connected factories, and industrial automation solutions. Companies are increasingly implementing IoT, AI, and advanced analytics to optimize processes, reduce downtime, and improve safety. Regulatory compliance, energy efficiency, and sustainability initiatives are also driving the adoption of high-precision and application-specific sensors, strengthening North America's leadership in the industrial sensor market.
Prominent players in the Global Industrial Sensor Market include ABB Ltd., Allegro MicroSystems, Inc., Balluff GmbH, Banner Engineering, Bosch Group, Endress+Hauser Group Services AG, Emerson Electric Co., Honeywell International Inc., ifm electronic gmbh, Keyence Corporation, LEM Holding, Melexis, OMRON Corporation, Panasonic Industry, Pepperl+Fuchs SE, Rockwell Automation, Inc., SICK AG, Sensatec GmbH, Sensata Technologies, Schneider Electric SE, Siemens AG, STMicroelectronics, TE Connectivity, Texas Instruments, and Turck Group. Key strategies adopted by industrial sensor companies to strengthen market presence include expanding R&D to develop high-precision and application-specific sensors, integrating AI and IoT capabilities for predictive maintenance and process optimization, and forming partnerships with industrial automation and manufacturing solution providers. Companies focus on enhancing reliability, durability, and performance under harsh operating conditions, while also improving energy efficiency and reducing costs. Geographic expansion, targeting emerging industrial markets, and compliance with regional standards help increase global reach. Businesses are leveraging direct sales, distribution networks, and digital platforms to improve customer engagement, ensure quick deployment, and provide value-added services. Product innovation, service support, and sustainable manufacturing practices further solidify market position and long-term competitiveness.
Table of Contents
Chapter 1 Methodology and Scope
- 1.1 Market scope and definition
- 1.2 Research design
- 1.2.1 Research approach
- 1.2.2 Data collection methods
- 1.3 Data mining sources
- 1.3.1 Global
- 1.3.2 Regional/Country
- 1.4 Base estimates and calculations
- 1.4.1 Base year calculation
- 1.4.2 Key trends for market estimation
- 1.5 Primary research and validation
- 1.5.1 Primary sources
- 1.6 Forecast model
- 1.7 Research assumptions and limitations
Chapter 2 Executive Summary
- 2.1 Industry 360° synopsis, 2022 - 2035
- 2.2 Key market trends
- 2.2.1 Sensor type trends
- 2.2.2 Technology trends
- 2.2.3 Connectivity trends
- 2.2.4 End Use industry trends
- 2.2.5 Regional trends
- 2.3 TAM analysis, 2025-2035
- 2.4 CXO perspectives: Strategic imperatives
Chapter 3 Industry Insights
- 3.1 Industry ecosystem analysis
- 3.1.1 Supplier landscape
- 3.1.2 Profit margin analysis
- 3.1.3 Cost structure
- 3.1.4 Value addition at each stage
- 3.1.5 Factor affecting the value chain
- 3.1.6 Disruptions
- 3.2 Industry impact forces
- 3.2.1 Growth drivers
- 3.2.1.1 Increasing Adoption of Industrial Automation and Smart Manufacturing
- 3.2.1.2 Integration of IoT and Industrial Internet of Things (IIoT) Technologies
- 3.2.1.3 Rising Demand for Predictive Maintenance and Real-Time Monitoring
- 3.2.1.4 Expansion in Renewable Energy and Advanced Power Generation Systems
- 3.2.1.5 Stringent Regulatory Compliance and Safety Standards
- 3.2.2 Industry pitfalls and challenges
- 3.2.2.1 High Initial Investment and Integration Complexity
- 3.2.2.2 Data Security and Reliability Concerns
- 3.2.3 Market opportunities
- 3.2.3.1 Adoption of Smart Factories and Industry 4.0 Initiatives
- 3.2.3.2 Expansion in Renewable Energy and Advanced Power Systems
- 3.2.1 Growth drivers
- 3.3 Growth potential analysis
- 3.4 Regulatory landscape
- 3.4.1 North America
- 3.4.2 Europe
- 3.4.3 Asia Pacific
- 3.4.4 Latin America
- 3.4.5 Middle East & Africa
- 3.5 Porter’s analysis
- 3.6 PESTEL analysis
- 3.7 Technology and innovation landscape
- 3.7.1 Current technological trends
- 3.7.2 Emerging technologies
- 3.8 Price trends
- 3.8.1 By region
- 3.8.2 By product
- 3.9 Pricing Strategies
- 3.10 Emerging Business Models
- 3.11 Compliance Requirements
- 3.12 Geopolitical and trade dynamics
Chapter 4 Competitive Landscape, 2025
- 4.1 Introduction
- 4.2 Company market share analysis
- 4.2.1 By region
- 4.2.1.1 North America
- 4.2.1.2 Europe
- 4.2.1.3 Asia Pacific
- 4.2.1.4 Latin America
- 4.2.1.5 Middle East & Africa
- 4.2.1 By region
- 4.3 Competitive benchmarking of key players
- 4.3.1 Financial performance comparison
- 4.3.1.1 Revenue
- 4.3.1.2 Profit margin
- 4.3.1.3 R&D
- 4.3.2 Product portfolio comparison
- 4.3.2.1 Product range breadth
- 4.3.2.2 Technology
- 4.3.2.3 Innovation
- 4.3.3 Geographic presence comparison
- 4.3.3.1 Global footprint analysis
- 4.3.3.2 Service network coverage
- 4.3.3.3 Market penetration by region
- 4.3.4 Competitive positioning matrix
- 4.3.4.1 Leaders
- 4.3.4.2 Challengers
- 4.3.4.3 Followers
- 4.3.4.4 Niche players
- 4.3.5 Strategic outlook matrix
- 4.3.1 Financial performance comparison
- 4.4 Key developments, 2022-2025
- 4.4.1 Mergers and acquisitions
- 4.4.2 Partnerships and collaborations
- 4.4.3 Technological advancements
- 4.4.4 Expansion and investment strategies
- 4.4.5 Digital transformation initiatives
- 4.5 Emerging/ startup competitors landscape
Chapter 5 Market Estimates and Forecast, By Sensor Type, 2022 - 2035 (USD Billion)
- 5.1 Key trends
- 5.2 Physical Parameter Sensors
- 5.2.1 Temperature Sensors
- 5.2.2 Pressure Sensors
- 5.2.3 Flow Sensors
- 5.2.4 Level Sensors
- 5.2.5 Position & Motion Sensors
- 5.3 Proximity Sensors
- 5.3.1 Inductive & Capacitive Proximity
- 5.3.2 Optical / Photoelectric Sensors
- 5.4 Environmental Monitoring Sensors
- 5.4.1 Humidity & Moisture Sensors
- 5.4.2 Vibration & Condition Sensors
- 5.4.3 Gas & Chemical Sensors
Chapter 6 Market Estimates and Forecast, By Technology, 2022 - 2035 (USD Billion)
- 6.1 Key trends
- 6.2 MEMS (Micro-Electro-Mechanical Systems)
- 6.3 Optical/Photonic
- 6.4 Electrochemical
- 6.5 Mechanical
- 6.6 Electromagnetic
- 6.7 Ultrasonic/Acoustic
- 6.8 Others
Chapter 7 Market Estimates and Forecast, By Connectivity, 2022 - 2035 (USD Billion)
- 7.1 Key trends
- 7.2 Wired
- 7.3 Wireless
Chapter 8 Market Estimates and Forecast, By End-use Industry, 2022 - 2035 (USD Billion)
- 8.1 Key trends
- 8.2 Chemicals & Petrochemicals
- 8.3 Energy & Power
- 8.4 Food & Beverage
- 8.5 Manufacturing & Industrial Automation
- 8.6 Metals & Mining
- 8.7 Oil & Gas
- 8.8 Pharmaceuticals
- 8.9 Automotive & Transportation
- 8.10 Water & Wastewater Treatment
- 8.11 Others
Chapter 9 Market Estimates and Forecast, By Region, 2022 - 2035 (USD Billion)
- 9.1 Key trends
- 9.2 North America
- 9.2.1 U.S.
- 9.2.2 Canada
- 9.3 Europe
- 9.3.1 Germany
- 9.3.2 UK
- 9.3.3 France
- 9.3.4 Spain
- 9.3.5 Italy
- 9.3.6 Netherlands
- 9.4 Asia Pacific
- 9.4.1 China
- 9.4.2 India
- 9.4.3 Japan
- 9.4.4 Australia
- 9.4.5 South Korea
- 9.5 Latin America
- 9.5.1 Brazil
- 9.5.2 Mexico
- 9.5.3 Argentina
- 9.6 Middle East and Africa
- 9.6.1 South Africa
- 9.6.2 Saudi Arabia
- 9.6.3 UAE
Chapter 10 Company Profiles
- 10.1 ABB Ltd.
- 10.2 Allegro MicroSystems, Inc.
- 10.3 Balluff GmbH
- 10.4 Banner Engineering
- 10.5 Bosch Group
- 10.6 Endress+Hauser Group Services AG
- 10.7 Emerson Electric Co.
- 10.8 Honeywell International Inc.
- 10.9 ifm electronic gmbh
- 10.10 Keyence Corporation
- 10.11 LEM Holding
- 10.12 Melexis
- 10.13 OMRON Corporation
- 10.14 Panasonic Industry
- 10.15 Pepperl+Fuchs SE
- 10.16 Rockwell Automation, Inc.
- 10.17 SICK AG
- 10.18 Sensatec GmbH
- 10.19 Sensata Technologies
- 10.20 Schneider Electric SE
- 10.21 Siemens AG
- 10.22 STMicroelectronics
- 10.23 TE Connectivity
- 10.24 Texas Instruments
- 10.25 Turck Group
 工业感测器市场规模、份额和趋势分析报告:按感测器类型、技术、最终用途、地区和细分市场预测(2025-2033 年)
 工业感测器市场:2026-2032年全球市场预测(按感测器类型、技术、通讯协定、应用和销售管道)
 半导体气体感测器市场分析及预测至 2035 年:按类型、产品、技术、应用、材料类型、最终用户、功能和安装类型划分。工业感测器市场分析及预测(至2035年):依类型、产品类型、技术、组件、应用、最终用户、功能、安装类型、设备及解决方案划分
 中国工业感测器市场:市场占有率分析、产业趋势与统计、成长预测(2026-2031)
 日本工业自动化感测器市场规模、份额、趋势及预测(按感测器类型、类型、自动化模式、最终用户和地区划分,2026-2034年)
 2026年全球工业感测器市场报告
 半导体气体感测器市场-2026-2031年预测单单点感测器市场按技术、性别、功率、安装方式、应用和最终用户产业划分-2026-2032年全球预测按感测器类型、技术、应用、最终用户和分销管道分類的中风感测器市场—2026-2032年全球预测