


 |
市场调查报告书
商品编码
1982279
可变利率技术设备市场:成长机会、成长要素、产业趋势分析及2026-2035年预测Variable Rate Technology (VRT) Equipment Market Opportunity, Growth Drivers, Industry Trend Analysis, and Forecast 2026 - 2035 |
||||||
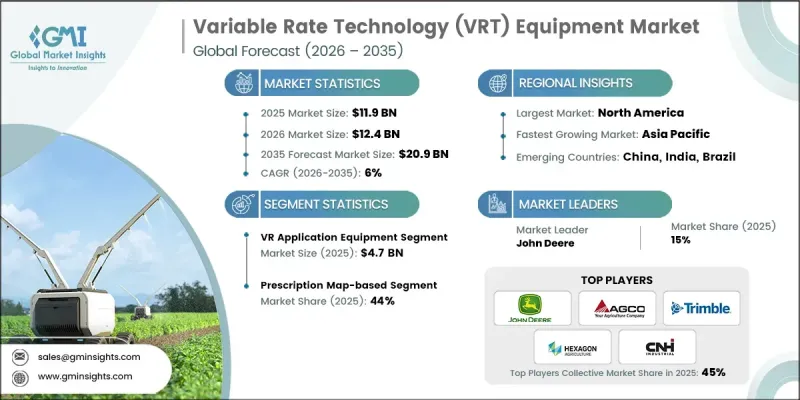
全球可变利率技术(VRT)设备市场预计到 2025 年价值 119 亿美元,预计到 2035 年将以 6% 的复合年增长率增长至 209 亿美元。
市场成长与人们逐渐意识到农地并非千篇一律,需要个人化的投入管理密切相关。农民正稳步从固定施肥量转向更具适应性的系统,以即时回应农田的变化。变数施肥技术(VRT)设备使操作人员能够根据土壤条件、作物需求和生产力区域微调投入。这种数据驱动的方法提高了作业精度和资源效率,同时支援更永续的农场管理。随着生产者对生产决策的透明度和控制力提出更高的要求,VRT解决方案正成为现代精密农业策略的关键组成部分。这个市场反映了农业系统向智慧化转型的趋势,智慧化农业系统旨在平衡生产力、成本优化和环境保护,而VRT设备正成为全球先进农业营运发展中的关键组成部分。
| 市场范围 | |
|---|---|
| 开始年份 | 2025 |
| 预测期 | 2026-2035 |
| 上市时的市场规模 | 119亿美元 |
| 预测金额 | 209亿美元 |
| 复合年增长率 | 6% |
从商业性角度来看,实用性、可靠性和无缝整合是变数施肥技术设备市场的关键考量。製造商致力于开发与现有农业机械相容的系统,使农民能够在不中断日常作业的情况下进行升级。使用者友善的介面、直觉的操作和稳定的性能仍然是购买决策的核心要素。销售合作伙伴和服务供应商透过技术指导、培训和售后服务做出重要贡献。这种协作生态系统促进了设备供应商和农业经营者之间的长期合作关係,将简单的交易转变为基于营运信任和可衡量结果的可持续伙伴关係。
预计2025年,变数施肥设备市场规模将达到47亿美元,占据变数施肥技术设备市场的最大份额。变数施肥(VRA)系统凭藉其带来的立竿见影的经济效益,正在推动市场成长。 VRA设备能够根据田间数据和数位化建议,逐块地优化关键农业投入品的施用,从而减少过度使用,同时保持或提高产量。由于投入成本在农业总支出中占比巨大,因此能够直接优化这些成本的技术具有很高的投资回报率,并正在推动精密农业平台的广泛应用。
预计到2025年,基于处方图的施药方案将占据44%的市场。处方笺图系统之所以被广泛采用,是因为它们能够提供稳定、精准的农药施用和可预测的施药效果。这些技术依赖于预先创建的数位田间地图,这些地图是透过农药数据分析产生的,用于确定不同管理区域的最佳施药量。透过在田间作业前应用数据驱动策略,农民可以更好地控制投入分配和作物产量,从而凸显精密农业框架下系统化规划的价值。
预计到2025年,美国可变速率耕作技术(VRT)设备市场将占据80%的份额,并创造约39亿美元的收入。由于精密农业技术的早期应用以及大规模商业农业企业的存在,该地区已成为VRT设备最成熟的市场。 GPS定位机械的高普及率、先进的农场管理平台以及强大的OEM生态系统,使得VRT系统能够无缝整合。这种成熟的基础设施正在加速VRT技术的普及,并巩固该地区在全球市场的主导地位。
目录
第一章:调查方法和范围
第二章执行摘要
第三章业界考察
- 生态系分析
- 供应商情况
- 利润率
- 每个阶段增加的价值
- 影响价值链的因素
- 影响产业的因素
- 促进因素
- 精密农业实践的迅速普及
- 日益增长的优化投入成本和提高资源效率的需求。
- 政府对数位农业的支持政策和奖励
- 产业潜在风险与挑战
- 高昂的初始投资和整合成本
- 技术复杂性和最终用户技能差距
- 机会
- 新兴经济体和大型农业经济体的扩张
- 与人工智慧、物联网和先进的农场管理平台集成
- 促进因素
- 成长潜力分析
- 关键市场趋势与颠覆性因素
- 未来市场趋势
- 风险及风险缓解分析
- 科技与创新趋势
- 当前技术趋势
- 新兴技术
- 价格趋势
- 按地区
- 透过装置
- 监理情势
- 标准和合规要求
- 认证标准
- 波特五力分析
- PESTEL 分析
第四章 竞争情势
- 介绍
- 企业市占率分析
- 按地区
- 企业矩阵分析
- 主要市场公司的竞争分析
- 竞争定位矩阵
- 主要进展
- 併购
- 伙伴关係与合作
- 新产品发布
- 业务拓展计划
第五章 市场估算与预测:依设备类型划分,2022-2035年
- GPS/GNSS导引与定位系统
- 变速控制器和主机
- 感测器和监控系统
- 可变容量喷雾器
- 软体和决策支援系统
第六章 市场估计与预测:依技术划分,2022-2035年
- 基于处方笺图的VRT
- 基于感测器的即时VRT
- 整合系统
第七章 市场估计与预测:依系统配置划分,2022-2035年
- 小规模家庭农场(不到600英亩)
- 中型家庭农场(600-1700英亩)
- 大型家庭农场(超过1700英亩)
第八章 市场估算与预测:依最终用途划分,2022-2035年
- 田间作物(广域农业)
- 特种作物(高价值多年生作物)
- 饲料和牧场
- 精准畜牧业
第九章 市场估计与预测:依应用领域划分,2022-2035年
- 变数施肥(VRNT)
- 可变播种/种植
- 采用可变施用量施用杀虫剂及除草剂
- 可变灌溉(VRI)
第十章 市场估价与预测:依通路划分,2022-2035年
- 直销
- 间接销售
第十一章 市场估价与预测:按地区划分,2022-2035年
- 北美洲
- 我们
- 加拿大
- 欧洲
- 德国
- 英国
- 法国
- 义大利
- 西班牙
- 亚太地区
- 中国
- 日本
- 印度
- 韩国
- 澳洲
- 马来西亚
- 印尼
- 拉丁美洲
- 巴西
- 墨西哥
- 中东和非洲
- 南非
- 沙乌地阿拉伯
- 阿拉伯聯合大公国
第十二章:公司简介
- John Deere(Deere &Company)
- Trimble Inc.
- CNH Industrial
- AGCO Corporation
- Hexagon Agriculture
- Topcon Positioning Systems
- AMAZONE
- Kverneland Group
- Rauch
- Claas
- Lindsay Corporation
- Precision Planting
- Muller-Elektronik
- Yara International
- Raven Industries
The Global Variable Rate Technology (VRT) Equipment Market was valued at USD 11.9 billion in 2025 and is estimated to grow at a CAGR of 6% to reach USD 20.9 billion by 2035.
Market growth is tied to the understanding that agricultural fields are not uniform and require tailored input management. Farmers are steadily transitioning from fixed-rate application practices to more adaptive systems that respond to real-time field variability. Variable rate technology (VRT) equipment enables operators to fine-tune input levels according to soil conditions, crop requirements, and productivity zones. This data-driven approach improves operational precision and enhances resource efficiency while supporting more sustainable farm management. As growers seek greater visibility and control over production decisions, VRT solutions are becoming integral to modern precision agriculture strategies. The market reflects a broader shift toward intelligent farming systems that balance productivity, cost optimization, and environmental stewardship, positioning VRT equipment as a critical component in the evolution of advanced agricultural operations worldwide.
| Market Scope | |
|---|---|
| Start Year | 2025 |
| Forecast Year | 2026-2035 |
| Start Value | $11.9 Billion |
| Forecast Value | $20.9 Billion |
| CAGR | 6% |
From a commercial perspective, the variable rate technology equipment market emphasizes practicality, reliability, and seamless integration. Manufacturers focus on developing systems that are compatible with existing agricultural machinery, allowing farmers to implement upgrades without disrupting routine fieldwork. User-friendly interfaces, intuitive controls, and consistent performance remain central to purchasing decisions. Distribution partners and service providers contribute significantly by delivering technical guidance, training, and post-sale support. This collaborative ecosystem fosters long-term engagement between equipment suppliers and farming operations, transforming transactions into sustained partnerships built on operational trust and measurable results.
In 2025, the variable rate application equipment segment generated USD 4.7 billion, representing the largest share of the variable rate technology equipment market. Variable Rate Application (VRA) systems lead the market because they provide immediate and quantifiable financial advantages. By enabling site-specific application of critical agricultural inputs based on field data and digital recommendations, VRA equipment helps reduce excess usage while protecting or enhancing yield performance. Since input costs represent a substantial portion of overall farm expenditure, technologies that directly optimize these expenses deliver a strong return on investment and drive widespread adoption across precision agriculture platforms.
The prescription map-based segment accounted for 44% share in 2025. Prescription-based systems are widely adopted because they deliver consistent agronomic precision and predictable results. These technologies rely on pre-developed digital field maps generated through agronomic data analysis to determine optimal application rates across different management zones. By applying data-informed strategies in advance of field operations, farmers gain greater control over input distribution and crop performance, reinforcing the value of structured planning within precision farming frameworks.
United States Variable Rate Technology (VRT) Equipment Market held 80% share in 2025, generating around USD 3.9 billion in revenue. The region represents the most established market for VRT equipment, supported by early adoption of precision agriculture practices and the presence of large-scale commercial farming enterprises. High utilization of GPS-enabled machinery, advanced farm management platforms, and strong original equipment manufacturer ecosystems enables seamless integration of VRT systems. This mature infrastructure accelerates deployment and strengthens the region's leadership position in the global market.
Key companies operating in the Global Variable Rate Technology (VRT) Equipment Market include John Deere (Deere & Company), Trimble Inc., AGCO Corporation, CNH Industrial, Hexagon Agriculture, Topcon Positioning Systems, Claas, Kverneland Group, AMAZONE, Rauch, Lindsay Corporation, Precision Planting, Muller Elektronik, Yara International, and Raven Industries. Companies in the Global Variable Rate Technology (VRT) Equipment Market are enhancing their competitive standing through continuous innovation, strategic alliances, and digital ecosystem expansion. Leading players invest heavily in research and development to improve software analytics, automation capabilities, and machine compatibility. Many manufacturers form partnerships with agronomy service providers and technology firms to deliver integrated precision farming solutions. Expanding product portfolios, strengthening dealer networks, and offering data-driven advisory services are also central strategies.
Table of Contents
Chapter 1 Methodology and Scope
- 1.1 Market scope and definition
- 1.2 Research design
- 1.2.1 Research approach
- 1.2.2 Data collection methods
- 1.3 Data mining sources
- 1.3.1 Global
- 1.3.2 Regional/Country
- 1.4 Base estimates and calculations
- 1.4.1 Base year calculation
- 1.4.2 Key trends for market estimation
- 1.5 Primary research and validation
- 1.5.1 Primary sources
- 1.6 Forecast model
- 1.7 Research assumptions and limitations
Chapter 2 Executive Summary
- 2.1 Industry 360° synopsis
- 2.2 Key market trends
- 2.2.1 regional
- 2.2.2 equipment type
- 2.2.3 farm size
- 2.2.4 end use
- 2.2.5 application
- 2.2.6 distribution channel
Chapter 3 Industry Insights
- 3.1 Industry ecosystem analysis
- 3.1.1 Supplier landscape
- 3.1.2 Profit margin
- 3.1.3 Value addition at each stage
- 3.1.4 Factor affecting the value chain
- 3.2 Industry impact forces
- 3.2.1 Growth drivers
- 3.2.1.1 Accelerated adoption of precision agriculture practices
- 3.2.1.2 Rising need for input cost optimization and resource efficiency
- 3.2.1.3 Supportive government policies and digital farming incentives
- 3.2.2 Industry pitfalls & challenges
- 3.2.2.1 High initial investment and integration costs
- 3.2.2.2 Technical complexity and skill gaps among end users
- 3.2.3 Opportunities
- 3.2.3.1 Expansion in emerging and large-scale agricultural economies
- 3.2.3.2 Integration with ai, iot, and advanced farm management platforms
- 3.2.1 Growth drivers
- 3.3 Growth potential analysis
- 3.4 Major market trends and Disruptions
- 3.5 Future market trends
- 3.6 Risk and mitigation Analysis
- 3.7 Technology and innovation landscape
- 3.7.1 Current technological trends
- 3.7.2 Emerging technologies
- 3.8 Price trends
- 3.8.1 By region
- 3.8.2 by equipment type
- 3.9 Regulatory landscape
- 3.9.1 Standards and compliance requirement
- 3.9.2 Certification standards
- 3.10 Porter's analysis
- 3.11 PESTEL analysis
Chapter 4 Competitive Landscape, 2025
- 4.1 Introduction
- 4.2 Company market share analysis
- 4.2.1 By region
- 4.2.1.1 North America
- 4.2.1.2 Europe
- 4.2.1.3 Asia Pacific
- 4.2.1.4 Latin America
- 4.2.1.5 Middle East and Africa
- 4.2.1 By region
- 4.3 Company matrix analysis
- 4.4 Competitive analysis of major market players
- 4.5 Competitive positioning matrix
- 4.6 Key developments
- 4.6.1 Mergers & acquisitions
- 4.6.2 Partnerships & collaborations
- 4.6.3 New product launches
- 4.6.4 Expansion plans
Chapter 5 Market Estimates & Forecast, By Equipment Type, 2022-2035 (USD Billion) (Tons)
- 5.1 Key trends
- 5.1.1 GPS/GNSS guidance and positioning systems
- 5.1.2 Variable rate controllers and consoles
- 5.1.3 Sensors and monitoring systems
- 5.1.4 Variable rate application equipment
- 5.1.5 Software and decision support systems
Chapter 6 Market Estimates & Forecast, By Technology Type, 2022-2035 (USD Billion) (Tons)
- 6.1 Key trends
- 6.2 Prescription map-based VRT
- 6.3 Real-time sensor-based VRT
- 6.4 Integrated systems
Chapter 7 Market Estimates & Forecast, By System Configuration, 2022-2035 (USD Billion) (Tons)
- 7.1 Key trends
- 7.2 Small family farms (<600 acres)
- 7.3 Midsize family farms (600-1,700 acres)
- 7.4 Large-scale family farms (>1,700 acres)
Chapter 8 Market Estimates & Forecast, By End Use, 2022-2035 (USD Billion) (Tons)
- 8.1 Key trends
- 8.2 Row crops (broadacre agriculture)
- 8.3 Specialty crops (high-value perennials)
- 8.4 Forage and pasture
- 8.5 Precision livestock farming
Chapter 9 Market Estimates & Forecast, By Application, 2022-2035 (USD Billion) (Tons)
- 9.1 Key trends
- 9.2 Variable rate nutrient / fertilizer application (VRNT)
- 9.3 Variable rate seeding / planting
- 9.4 Variable rate pesticide / herbicide application
- 9.5 Variable rate irrigation (VRI)
Chapter 10 Market Estimates & Forecast, By Distribution Channel, 2022-2035 (USD Billion) (Tons)
- 10.1 Key trends
- 10.2 Direct sales
- 10.3 Indirect sales
Chapter 11 Market Estimates and Forecast, By Region, 2022 - 2035 (USD Billion) (Tons)
- 11.1 Key trends
- 11.2 North America
- 11.2.1 U.S.
- 11.2.2 Canada
- 11.3 Europe
- 11.3.1 Germany
- 11.3.2 UK
- 11.3.3 France
- 11.3.4 Italy
- 11.3.5 Spain
- 11.4 Asia Pacific
- 11.4.1 China
- 11.4.2 Japan
- 11.4.3 India
- 11.4.4 South Korea
- 11.4.5 Australia
- 11.4.6 Malaysia
- 11.4.7 Indonesia
- 11.5 Latin America
- 11.5.1 Brazil
- 11.5.2 Mexico
- 11.6 Middle East and Africa
- 11.6.1 South Africa
- 11.6.2 Saudi Arabia
- 11.6.3 UAE
Chapter 12 Company Profiles
- 12.1 John Deere (Deere & Company)
- 12.2 Trimble Inc.
- 12.3 CNH Industrial
- 12.4 AGCO Corporation
- 12.5 Hexagon Agriculture
- 12.6 Topcon Positioning Systems
- 12.7 AMAZONE
- 12.8 Kverneland Group
- 12.9 Rauch
- 12.10 Claas
- 12.11 Lindsay Corporation
- 12.12 Precision Planting
- 12.13 Muller-Elektronik
- 12.14 Yara International
- 12.15 Raven Industries


