


 |
市场调查报告书
商品编码
1982339
航空衍生燃气涡轮机市场:成长机会、成长要素、产业趋势分析及 2026-2035 年预测。Aeroderivative Gas Turbine Market Opportunity, Growth Drivers, Industry Trend Analysis, and Forecast 2026 - 2035 |
||||||
全球航空衍生燃气涡轮机市场预计到 2025 年价值 73 亿美元,预计到 2035 年将达到 215 亿美元,年复合成长率为 11.3%。
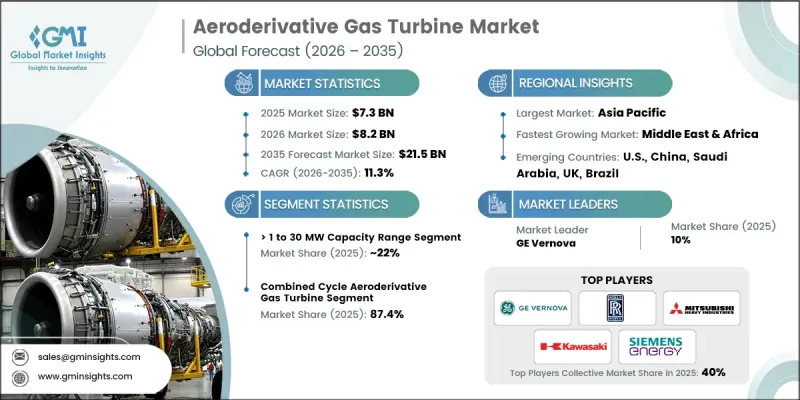
为满足日益增长的全球能源需求,天然气开采和输送领域的投资不断增加,推动了该产业的发展。微电网的扩展以及降低大型火力发电厂资本支出的努力,进一步促进了燃气涡轮机的应用。基于飞机喷射发动机的航空燃气涡轮机,集轻量化设计、高效率、模组化结构、高压缩比和快速可再生以及针对尖峰负载和备用电源运行的更严格的排放法规,正在提升市场潜力。人工智慧驱动的预测性维护、数位双胞胎整合以及与可再生能源系统的无缝连接等技术进步,正在推动产业转型。对能源安全、成本效益和长期永续性的关注,也对市场成长产生影响。
| 市场范围 | |
|---|---|
| 开始年份 | 2025 |
| 预测期 | 2026-2035 |
| 上市时的市场规模 | 73亿美元 |
| 预计金额 | 215亿美元 |
| 复合年增长率 | 11.3% |
预计到 2025 年,1-30 兆瓦容量段将占 22% 的市场份额,到 2035 年将以 11.5% 的复合年增长率成长。这些涡轮机非常适合需要高持续输出的行业,例如石油和天然气、工业製造以及扩建电网成本高或不切实际的偏远地区作业。
预计到2025年,复合迴圈和衍生燃气涡轮机市场份额将达到87.4%,到2035年市场规模将达到150亿美元。复合迴圈适用于工业园区、校园和公用事业规模计划的高效、长时运行,具有热效率低、输出连续的特性。从燃煤发电转向更清洁的替代能源进一步推动了市场成长。
预计到 2025 年,美国航空衍生燃气涡轮机市场将占据 72% 的份额。这一增长是由向先进燃气涡轮机技术的转变、减少碳排放的努力以及遵守严格的环境法规所推动的。
目录
第一章:调查方法和范围
第二章执行摘要
第三章业界考察
- 生态系分析
- 原物料供应及采购分析
- 生产能力评估
- 供应链韧性与风险因素
- 配电网路分析
- 影响产业的因素
- 促进因素
- 产业潜在风险与挑战
- 监理情势
- 成长潜力分析
- 价格趋势分析(美元/兆瓦)
- 按地区
- 按产能
- 波特的分析
- 供应商的议价能力
- 买方的议价能力
- 新进入者的威胁
- 替代品的威胁
- PESTEL 分析
- 航空衍生燃气涡轮机的成本结构分析
- 新机会和趋势
- 数位化和物联网集成
- 进入新兴市场
- 投资分析及未来展望
第四章 竞争情势
- 介绍
- 企业市占率分析:按地区划分
- 北美洲
- 欧洲
- 亚太地区
- 中东和非洲
- 拉丁美洲
- 竞争定位矩阵
- 主要进展
- 併购
- 伙伴关係与合作
- 新产品发布
- 业务拓展计划及资金筹措
第五章 市场规模及预测:依产能划分,2022-2035年
- 50 kW
- 50~500 kW
- >500 kW~1 MW
- >1~30 MW
- >30~70 MW
- >70 MW
第六章 市场规模及预测:依技术划分,2022-2035年
- 开式循环
- 复合循环
第七章 市场规模及预测:依应用领域划分,2022-2035年
- 发电厂
- 石油和天然气
- 加工厂
- 航空
- 船
- 其他的
第八章 市场规模及预测:依地区划分,2022-2035年
- 北美洲
- 我们
- 加拿大
- 墨西哥
- 欧洲
- 英国
- 法国
- 德国
- 俄罗斯
- 义大利
- 荷兰
- 丹麦
- 波兰
- 瑞典
- 亚太地区
- 中国
- 澳洲
- 日本
- 印度
- 韩国
- 印尼
- 泰国
- 马来西亚
- 中东和非洲
- 沙乌地阿拉伯
- 阿拉伯聯合大公国
- 卡达
- 科威特
- 阿曼
- 埃及
- 土耳其
- 伊拉克
- 南非
- 奈及利亚
- 阿尔及利亚
- 拉丁美洲
- 巴西
- 阿根廷
- 智利
第九章:公司简介
- Ansaldo Energia
- Baker Hughes
- Capstone Green Energy
- Collins Aerospace
- Destinus Energy
- Doosan Enerbility
- Everllence
- GE Vernova
- Harbin Electric
- Honeywell International
- IHI Corporation
- Kawasaki Heavy Industries
- Mitsubishi Heavy Industries
- Nanjing Turbine &Electric Machinery
- Pratt &Whitney
- Rolls-Royce
- Safran
- Siemens Energy
- Vericor
- Wartsila
The Global Aeroderivative Gas Turbine Market was valued at USD 7.3 billion in 2025 and is estimated to grow at a CAGR of 11.3% to reach USD 21.5 billion by 2035.
The industry is driven by increasing investments in natural gas extraction and distribution to meet growing global energy demand. Expansion of microgrids and the effort to reduce capital expenditures for large-scale thermal plants are further boosting adoption. Aeroderivative gas turbines, adapted from aircraft jet engines, combine lightweight design with high efficiency, modular construction, high compression ratios, and rapid start-up capabilities. These turbines offer broad fuel flexibility, low start-up times, and robust performance, making them suitable for both grid-connected and standalone power systems. The transition to renewable fuels and stricter emission regulations for peak load and backup operations are enhancing market potential. Advancements such as AI-powered predictive maintenance, digital twin integration, and seamless connection with renewable systems are reshaping the industry. A focus on energy security, cost efficiency, and long-term sustainability is also influencing market growth.
| Market Scope | |
|---|---|
| Start Year | 2025 |
| Forecast Year | 2026-2035 |
| Start Value | $7.3 Billion |
| Forecast Value | $21.5 Billion |
| CAGR | 11.3% |
The >1 to 30 MW capacity segment accounted for 22% share in 2025 and is projected to grow at a CAGR of 11.5% through 2035. These turbines are ideal for sectors requiring high continuous power output, including oil and gas, industrial manufacturing, and remote operations where extending the grid is costly or impractical.
The combined cycle aeroderivative gas turbine segment held an 87.4% share in 2025 and is expected to reach USD 15 billion by 2035. Combined cycle systems are favored for high-efficiency, long-duration operations in industrial parks, campuses, and utility-scale projects, offering lower heat rates and continuous output. The shift from coal-based generation to cleaner alternatives is further supporting market growth.
U.S. Aeroderivative Gas Turbine Market held a 72% share in 2025. Adoption is driven by the move toward advanced gas turbine technology, carbon reduction commitments, and compliance with stringent environmental regulations.
Key players operating in the Global Aeroderivative Gas Turbine Market include Ansaldo Energia, Destinus Energy, Capstone Green Energy, Doosan Enerbility, Everllence, GE Vernova, Harbin Electric, Honeywell International, IHI Corporation, Kawasaki Heavy Industries, Mitsubishi Heavy Industries, Nanjing Turbine & Electric Machinery, Pratt & Whitney, Rolls-Royce, Safran, Siemens Energy, Vericor, Baker Hughes, and Collins Aerospace. Companies in the Aeroderivative Gas Turbine Market are implementing multiple strategies to strengthen their foothold. They are investing in research and development to enhance turbine efficiency, fuel flexibility, and start-up speed while integrating AI and predictive maintenance solutions. Strategic partnerships and joint ventures are being formed to expand geographic reach and share development risks. Firms are diversifying portfolios by combining turbines with renewable energy systems and offering turnkey solutions for microgrid and industrial applications. Market leaders are also focusing on servicing, retrofitting, and upgrading existing installations to retain clients while acquiring new ones. Additionally, leveraging government incentives and financing programs helps reduce project costs, increasing market penetration and competitiveness.
Table of Contents
Chapter 1 Methodology & Scope
- 1.1 Research design
- 1.2 Quality commitments
- 1.2.1 GMI AI policy & data integrity commitment
- 1.2.1.1 Source consistency protocol
- 1.2.1 GMI AI policy & data integrity commitment
- 1.3 Research trail & confidence scoring
- 1.3.1 Research trail components
- 1.3.2 Scoring components
- 1.4 Data collection
- 1.4.1 Partial list of primary sources
- 1.5 Data mining sources
- 1.5.1 Paid sources
- 1.5.1.1 Sources, by region
- 1.5.1 Paid sources
- 1.6 Base estimates and calculations
- 1.6.1 Base year calculation for any one approach
- 1.7 Forecast model
- 1.7.1 Quantified market impact analysis
- 1.7.1.1 Mathematical impact of growth parameters on forecast
- 1.7.1 Quantified market impact analysis
- 1.8 Research transparency addendum
- 1.8.1 Source attribution framework
- 1.8.2 Quality assurance metrics
- 1.8.3 Our commitment to trust
- 1.9 Market definitions
Chapter 2 Executive Summary
- 2.1 Industry synopsis, 2022 - 2035
- 2.1.1 Business trends
- 2.1.2 Capacity trends
- 2.1.3 Technology trends
- 2.1.4 Application trends
- 2.1.5 Regional trends
Chapter 3 Industry Insights
- 3.1 Industry ecosystem analysis
- 3.1.1 Raw material availability & sourcing analysis
- 3.1.2 Manufacturing capacity assessment
- 3.1.3 Supply chain resilience & risk factors
- 3.1.4 Distribution network analysis
- 3.2 Industry impact forces
- 3.2.1 Growth drivers
- 3.2.2 Industry pitfalls & challenges
- 3.3 Regulatory landscape
- 3.4 Growth potential analysis
- 3.5 Price trend analysis (USD/MW)
- 3.5.1 By region
- 3.5.2 By capacity
- 3.6 Porter's analysis
- 3.6.1 Bargaining power of suppliers
- 3.6.2 Bargaining power of buyers
- 3.6.3 Threat of new entrants
- 3.6.4 Threat of substitutes
- 3.7 PESTEL analysis
- 3.7.1 Political factors
- 3.7.2 Economic factors
- 3.7.3 Social factors
- 3.7.4 Technological factors
- 3.7.5 Legal factors
- 3.7.6 Environmental factors
- 3.8 Cost structure analysis of aeroderivative gas turbines
- 3.9 Emerging opportunities & trends
- 3.9.1 Digitalization & IoT integration
- 3.9.2 Emerging market penetration
- 3.10 Investment analysis & future prospects
Chapter 4 Competitive Landscape, 2026
- 4.1 Introduction
- 4.2 Company market share analysis, by region, 2025
- 4.2.1 North America
- 4.2.2 Europe
- 4.2.3 Asia Pacific
- 4.2.4 Middle East & Africa
- 4.2.5 Latin America
- 4.3 Competitive positioning matrix
- 4.4 Key developments
- 4.4.1 Mergers & acquisitions
- 4.4.2 Partnerships & collaborations
- 4.4.3 New product launches
- 4.4.4 Expansion plans & funding
Chapter 5 Market Size and Forecast, By Capacity, 2022 - 2035 (USD Million & MW)
- 5.1 Key trends
- 5.2 50 kW
- 5.3 > 50 to 500 kW
- 5.4 > 500 kW to 1 MW
- 5.5 > 1 to 30 MW
- 5.6 > 30 to 70 MW
- 5.7 > 70 MW
Chapter 6 Market Size and Forecast, By Technology, 2022 - 2035 (USD Million & MW)
- 6.1 Key trends
- 6.2 Open cycle
- 6.3 Combined cycle
Chapter 7 Market Size and Forecast, By Application, 2022 - 2035 (USD Million & MW)
- 7.1 Key trends
- 7.2 Power plants
- 7.3 Oil & gas
- 7.4 Process plants
- 7.5 Aviation
- 7.6 Marine
- 7.7 Others
Chapter 8 Market Size and Forecast, By Region, 2022 - 2035 (USD Million & MW)
- 8.1 Key trends
- 8.2 North America
- 8.2.1 U.S.
- 8.2.2 Canada
- 8.2.3 Mexico
- 8.3 Europe
- 8.3.1 UK
- 8.3.2 France
- 8.3.3 Germany
- 8.3.4 Russia
- 8.3.5 Italy
- 8.3.6 Netherlands
- 8.3.7 Denmark
- 8.3.8 Poland
- 8.3.9 Sweden
- 8.4 Asia Pacific
- 8.4.1 China
- 8.4.2 Australia
- 8.4.3 Japan
- 8.4.4 India
- 8.4.5 South Korea
- 8.4.6 Indonesia
- 8.4.7 Thailand
- 8.4.8 Malaysia
- 8.5 Middle East & Africa
- 8.5.1 Saudi Arabia
- 8.5.2 UAE
- 8.5.3 Qatar
- 8.5.4 Kuwait
- 8.5.5 Oman
- 8.5.6 Egypt
- 8.5.7 Turkey
- 8.5.8 Iraq
- 8.5.9 South Africa
- 8.5.10 Nigeria
- 8.5.11 Algeria
- 8.6 Latin America
- 8.6.1 Brazil
- 8.6.2 Argentina
- 8.6.3 Chile
Chapter 9 Company Profiles
- 9.1 Ansaldo Energia
- 9.2 Baker Hughes
- 9.3 Capstone Green Energy
- 9.4 Collins Aerospace
- 9.5 Destinus Energy
- 9.6 Doosan Enerbility
- 9.7 Everllence
- 9.8 GE Vernova
- 9.9 Harbin Electric
- 9.10 Honeywell International
- 9.11 IHI Corporation
- 9.12 Kawasaki Heavy Industries
- 9.13 Mitsubishi Heavy Industries
- 9.14 Nanjing Turbine & Electric Machinery
- 9.15 Pratt & Whitney
- 9.16 Rolls-Royce
- 9.17 Safran
- 9.18 Siemens Energy
- 9.19 Vericor
- 9.20 Wartsila
 航空燃气涡轮机市场:2026-2032年全球市场预测(按应用、功率范围、最终用户、燃料类型、技术和安装方式划分)
 全球航空衍生燃气涡轮机市场规模、份额、趋势和成长分析报告(2026-2034)
 航空燃气涡轮机市场-全球产业规模、份额、趋势、机会与预测:产能、技术、应用、区域和竞争格局,2021-2031年
 航空衍生燃气涡轮机市场规模、份额和成长分析(按技术、循环、功率、燃料类型、应用、最终用途产业和地区划分)-2026-2033年产业预测
 复合迴圈航空衍生燃气涡轮机的全球市场
 2025-2029年全球航空衍生型燃气涡轮机市场
 航空衍生型燃气涡轮机服务市场机会、成长动力、产业趋势分析及 2025 - 2034 年预测
 航改型燃气涡轮机市场按容量(高达1 MW、1-30 MW、30-70 MW、70 MW 以上)、技术(开式循环、联合循环)、应用(发电厂、石油和天然气、加工厂、航空、船舶) 、及其他)及地区 2025-2033联合循环航改燃气涡轮机市场、机会、成长动力、产业趋势分析与预测,2024-2032开式循环航改燃气涡轮机市场- 按容量(<= 50 kW、> 50 kW 至500 kW、> 500 kW 至1 MW、> 1 至30 MW、> 30 至70 MW、> 70 MW)、依应用及预测, 2024 - 2032