


 |
市场调查报告书
商品编码
1998688
电动车充电线市场机会、成长要素、产业趋势分析及2026-2035年预测Electric Vehicle Charging Cable Market Opportunity, Growth Drivers, Industry Trend Analysis, and Forecast 2026 - 2035 |
||||||
全球电动车充电线市场预计到 2025 年将价值 19 亿美元,预计到 2035 年将以 10.6% 的复合年增长率增长至 51 亿美元。
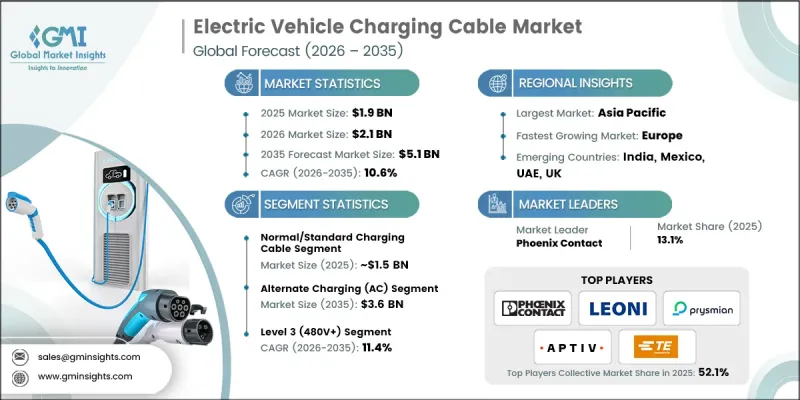
随着电动车在全球日益普及,对可靠且高效的充电基础设施的需求也稳定成长,充电线已成为电动车充电设备(EVSE)生态系统中不可或缺的一部分。这些线缆连接充电站和车辆,实现安全且有效率的能量传输。政府奖励、更严格的排放气体法规以及对电动车基础设施的投资正在推动市场成长,而高功率连接器、多车型相容性和快速充电解决方案等方面的技术进步则进一步加速了这些线缆的普及应用。随着公共和私人充电网路的快速扩张,製造商正致力于生产扩充性、耐用且用途广泛的充电解决方案,以满足全球日益增长的电动车需求。
| 市场范围 | |
|---|---|
| 开始年份 | 2025 |
| 预测期 | 2026-2035 |
| 上市时的市场规模 | 19亿美元 |
| 预计金额 | 51亿美元 |
| 复合年增长率 | 10.6% |
标准或普通充电线占80.7%的市场份额,预计到2025年市场规模将达到15亿美元。大部分充电发生在家庭或职场,这些场所主要依赖交流充电基础设施。标准充电线是购买新车或售后市场的首选,因为它们与市面上广泛使用的交流壁挂式充电桩和公共交流充电桩完全相容。与直流快充相比,交流充电桩更高的普及率也巩固了该细分市场的主导地位。
预计到2025年,交流电(AC)充电市占率将达到75.6%,到2035年将达到36亿美元。由于其成本效益高、基础设施相容性强,且适用于家庭和职场,交流电充电仍然是绝大多数电动车车主的首选。在许多地区,尤其是在新兴市场,交流电充电桩的数量远超直流快充桩,这推动了该细分市场的持续成长。
美国电动车充电线缆市场预计到2025年将达到2.044亿美元,并在2026年至2035年间以8.6%的复合年增长率成长。国内电动车充电网路的扩张、永续性以及联邦政府计画(例如旨在发展全国公共充电基础设施的NEVI Formula计画)正在推动线缆需求。高速公路沿线直流快速充电站的日益增加也进一步提升了对高功率直流电缆的需求。
目录
第一章:调查方法
第二章执行摘要
第三章业界考察
- 生态系分析
- 供应商情况
- 利润率
- 成本结构
- 每个阶段增加的价值
- 影响价值链的因素
- 中断
- 影响产业的因素
- 促进因素
- 电动车在全球范围内的迅速普及以及电气化的强制性实施
- 政府奖励和对充电基础设施的投资
- 快速充电和液冷技术的进步
- 消费者对便利充电解决方案的需求日益增长
- 产业潜在风险与挑战
- 与温度控管和散热相关的挑战
- 缺乏统一的连接器标准
- 市场机会
- 扩建超快速充电网路(350kW 或以上)
- 电动车渗透率低的新兴市场
- 轻量永续电缆材料的开发
- 促进因素
- 成长潜力分析
- 监理情势
- 北美洲
- 美国电机工程规范(NEC-NFPA 70)
- UL解决方案
- CSA集团
- SAE International
- 欧洲
- 欧洲电工标准化委员会(CENELEC)
- 国际电工委员会(IEC)
- TUV Rheinland
- DIN
- 亚太地区
- 国家市场监督管理总局(中国)
- 中国国家标准化管理委员会(SAC)
- 印度标准局(BIS)
- 日本工业标准委员会(JISC)
- 拉丁美洲
- 巴西国家计量、品质与技术研究院(INMETRO)
- 标准化和认证协会(ANCE)
- 阿根廷标准化与认证协会(IRAM)
- 中东和非洲
- 沙乌地阿拉伯标准、计量和品质组织(SASO)
- ESMA(阿联酋标准化和计量局)
- 南非标准局(SABS)
- 北美洲
- 投资与资金筹措分析
- 波特五力分析
- PESTEL 分析
- 科技与创新趋势
- 目前技术
- 交流充电线(模式 2 和模式 3)
- 直流快速充电(50kW 至 250kW)
- 智慧充电和负载管理系统
- 标准化连接器技术(CCS、CHAdeMO、GB/T)
- 新兴技术
- 超快充电线(350千瓦或更高)
- 轻巧灵活的电缆材料
- 水冷充电线
- 目前技术
- 价格分析(基于初步调查)
- 对过去价格趋势的分析
- 按业务类型分類的定价策略(溢价/价值/成本加成)
- 专利趋势(基于初步调查)
- 贸易数据分析(基于付费资料库)
- 进出口量及进口额趋势
- 主要贸易走廊及关税的影响
- 生产能力和生产趋势(基于初步调查)
- 按地区和主要製造商分類的已安装产能
- 运转率和扩张计划
- 人工智慧和生成式人工智慧对市场的影响
- 利用人工智慧改造现有经营模式
- GenAI 各细分市场的应用案例与部署蓝图
- 风险、局限性和监管考量
- 电动车製造商的策略联盟
- 交易週期分析
- 电动车充电线的平均使用寿命
- 使用模式和环境因素的影响
- 更换成本和经济因素
- 技术升级对更换週期的影响
- 案例研究
- 预测假设和情境分析(基于初步研究)
- 基本案例-驱动复合年增长率的关键宏观经济与产业变量
- 乐观情境-宏观经济与产业的顺风
- 悲观情景-宏观经济放缓或产业逆风
第四章 竞争情势
- 介绍
- 企业市占率分析
- 北美洲
- 欧洲
- 亚太地区
- 拉丁美洲
- 中东和非洲(MEA)
- 主要市场公司的竞争分析
- 竞争定位矩阵
- 主要进展
- 併购
- 伙伴关係与合作
- 新产品发布
- 业务拓展计划及资金筹措
- 企业级分层基准测试
- 层级分类标准与选择标准
- 按收入、地区和创新能力分類的层级定位矩阵。
第五章 市场估价与预测:依电缆类型划分,2022-2035年
- 标准充电线
- 高功率充电(HPC)线缆
- 标准/非冷却式高功率充电 (HPC) 线缆
- 水冷式高功率充电线
第六章 市场估算与预测:依电源类型划分,2022-2035年
- 交流电充电(AC)
- 直流充电(DC)
第七章 市场估算与预测:依充电等级划分,2022-2035年
- 1级(120V)
- 二级(240V)
- 3级(480V或更高)
第八章 市场估算与预测:依连接器类型划分,2022-2035年
- Type 1
- 类型 2
- CCS 1
- CCS 2
- CHAdeMO
- GB/T
- NACS/特斯拉
第九章 市场估计与预测:依模式划分,2022-2035年
- 模式 1 和 2
- 模式 3
- 模式 4
第十章 市场估价与预测:依直径划分,2022-2035年
- 10 mm
- 10~20 mm
- 20毫米或以上
第十一章 市场估价与预测:依形状划分,2022-2035年
- 直的
- 捲曲
第十二章 市场估计与预测:依长度划分,2022-2035年
- 小于5米
- 5-10米
- 超过10米
第十三章 市场估计与预测:依应用领域划分,2022-2035年
- 个人充电
- 公共充电
- 购物中心
- 飞机场
- 高速公路
- 商业停车场
- 其他的
第十四章 市场估价与预测:依销售管道划分,2022-2035年
- OEM
- 售后市场
第十五章 市场估计与预测:依地区划分,2022-2035年
- 北美洲
- 我们
- 加拿大
- 欧洲
- 德国
- 英国
- 法国
- 义大利
- 西班牙
- 比利时
- 俄罗斯
- 荷兰
- 亚太地区
- 中国
- 印度
- 日本
- 韩国
- 澳洲
- 新加坡
- 马来西亚
- 越南
- 泰国
- 拉丁美洲
- 巴西
- 墨西哥
- 阿根廷
- 哥伦比亚
- 中东和非洲(MEA)
- 南非
- 沙乌地阿拉伯
- 阿拉伯聯合大公国
第十六章:公司简介
- 世界公司
- Phoenix Contact
- TE Connectivity
- LEONI
- Prysmian
- Aptiv
- Huber+Suhner
- Dyden
- Coroplast
- BRUGG
- Tesla
- 当地公司
- Chengdu Khons
- Sinbon Electronics
- EV TEISON
- Guchen Electronics
- Manlon
- Pod Point
- 新兴企业
- Juice Technology
- Webasto
- Masterplug
- Zencar
The Global Electric Vehicle Charging Cable Market was valued at USD 1.9 billion in 2025 and is estimated to grow at a CAGR of 10.6% to reach USD 5.1 billion by 2035.
The rising adoption of electric vehicles worldwide is driving strong demand for reliable and efficient charging infrastructure, with charging cables serving as a critical component of the EV supply equipment (EVSE) ecosystem. These cables link charging stations to vehicles, ensuring safe and efficient energy transfer. Government incentives, stricter emission regulations, and investments in EV infrastructure are supporting market growth, while technological advancements in high-power connectors, multi-vehicle compatibility, and faster charging solutions are further enhancing the adoption of these cables. With both public and private charging networks expanding rapidly, manufacturers are focusing on producing scalable, durable, and versatile charging solutions to accommodate the growing EV population globally.
| Market Scope | |
|---|---|
| Start Year | 2025 |
| Forecast Year | 2026-2035 |
| Start Value | $1.9 Billion |
| Forecast Value | $5.1 Billion |
| CAGR | 10.6% |
The normal or standard charging cable segment held 80.7% share, generating USD 1.5 billion in 2025. Most charging sessions occur at homes or workplaces, which primarily rely on AC charging infrastructure. Standard cables are fully compatible with widely deployed AC wall boxes and public AC chargers, making them the default choice for new EVs and aftermarket purchases. The broader availability of AC chargers compared to DC fast chargers drives the dominance of this segment.
The alternate current (AC) charging segment held 75.6% share in 2025 and is expected to reach USD 3.6 billion by 2035. AC charging remains the preferred choice for most EV owners due to cost-effectiveness, widespread infrastructure compatibility, and suitability for home and workplace use. In many regions, AC charging points significantly outnumber DC fast chargers, particularly in emerging markets, supporting the sustained growth of this segment.
U.S. Electric Vehicle Charging Cable Market reached USD 204.4 million in 2025 and is projected to grow at a CAGR of 8.6% between 2026 and 2035. Expansion of domestic EV charging networks, sustainability initiatives, and federal programs like the NEVI Formula Program, which aim to establish a nationwide public charging infrastructure, are driving cable demand. The increasing deployment of DC fast charging stations along highways is further boosting the requirement for high-power DC cables.
Key players operating in the Global Electric Vehicle Charging Cable Market include Phoenix Contact, TE Connectivity, Aptiv, Huber+Suhner, Sinbon Electronics, Prysmian, BRUGG, LEONI, Dyden, and Coroplast. Key strategies adopted by companies in the Electric Vehicle Charging Cable Market include developing high-performance connectors capable of supporting next-generation fast charging and grid integration. Manufacturers are investing in R&D to produce longer-lasting, weather-resistant, and multi-vehicle compatible cables. Strategic partnerships with EV manufacturers and charging station operators allow companies to expand distribution networks and enhance adoption. Emphasis on cost optimization, scalable production, and compliance with international safety standards helps firms maintain market leadership. Companies also focus on technological innovation, including smart monitoring and adaptive power management features, to differentiate their products in a rapidly evolving market.
Table of Contents
Chapter 1 Methodology
- 1.1 Research approach
- 1.2 Quality commitments
- 1.2.1 GMI AI policy & data integrity commitment
- 1.3 Research trail & confidence scoring
- 1.3.1 Research trail components
- 1.3.2 Scoring components
- 1.4 Data collection
- 1.4.1 Partial list of primary sources
- 1.5 Data mining sources
- 1.5.1 Paid sources
- 1.6 Base estimates and calculations
- 1.6.1 Base year calculation
- 1.7 Forecast model
- 1.8 Research transparency addendum
Chapter 2 Executive Summary
- 2.1 Industry 360° synopsis
- 2.2 Key market trends
- 2.2.1 Regional
- 2.2.2 Cable
- 2.2.3 Power Supply
- 2.2.4 Charging Level
- 2.2.5 Connector
- 2.2.6 Mode
- 2.2.7 Diameter
- 2.2.8 Shape
- 2.2.9 Length
- 2.2.10 Application
- 2.2.11 Sales Channel
- 2.3 TAM analysis, 2026-2035
- 2.4 CXO perspectives: Strategic imperatives
Chapter 3 Industry Insights
- 3.1 Industry ecosystem analysis
- 3.1.1 Supplier landscape
- 3.1.2 Profit margin
- 3.1.3 Cost structure
- 3.1.4 Value addition at each stage
- 3.1.5 Factor affecting the value chain
- 3.1.6 Disruptions
- 3.2 Industry impact forces
- 3.2.1 Growth drivers
- 3.2.1.1 Rapid global EV adoption & electrification mandates
- 3.2.1.2 Government incentives & charging infrastructure investments
- 3.2.1.3 Technological advancements in fast charging & liquid cooling
- 3.2.1.4 Growing consumer demand for convenient charging solutions
- 3.2.2 Industry pitfalls and challenges
- 3.2.2.1 Thermal management & heat dissipation challenges
- 3.2.2.2 Lack of universal connector standardization
- 3.2.3 Market opportunities
- 3.2.3.1 Expansion of ultra-fast charging networks (350kW+)
- 3.2.3.2 Emerging markets with low EV penetration rates
- 3.2.3.3 Development of lightweight & sustainable cable materials
- 3.2.1 Growth drivers
- 3.3 Growth potential analysis
- 3.4 Regulatory landscape
- 3.4.1 North America
- 3.4.1.1 National Electrical Code (NEC - NFPA 70)
- 3.4.1.2 UL Solutions
- 3.4.1.3 CSA Group
- 3.4.1.4 SAE International
- 3.4.2 Europe
- 3.4.2.1 European Committee for Electrotechnical Standardization (CENELEC)
- 3.4.2.2 International Electrotechnical Commission (IEC)
- 3.4.2.3 TUV Rheinland
- 3.4.2.4 DIN
- 3.4.3 Asia Pacific
- 3.4.3.1 State Administration for Market Regulation (China)
- 3.4.3.2 Standardization Administration of China (SAC)
- 3.4.3.3 Bureau of Indian Standards (BIS)
- 3.4.3.4 Japanese Industrial Standards Committee (JISC)
- 3.4.4 Latin America
- 3.4.4.1 Instituto Nacional de Metrologia Qualidade e Tecnologia (INMETRO)
- 3.4.4.2 Asociacion de Normalizacion y Certificacion (ANCE)
- 3.4.4.3 Instituto Argentino de Normalizacion y Certificacion (IRAM)
- 3.4.5 Middle East & Africa
- 3.4.5.1 Saudi Standards Metrology and Quality Organization (SASO)
- 3.4.5.2 Emirates Authority for Standardization and Metrology (ESMA)
- 3.4.5.3 South African Bureau of Standards (SABS)
- 3.4.1 North America
- 3.5 Investment & Funding Analysis
- 3.6 Porter's analysis
- 3.7 PESTEL analysis
- 3.8 Technology and innovation landscape
- 3.8.1 Current technologies
- 3.8.1.1 AC charging cables (Mode 2 & Mode 3)
- 3.8.1.2 DC fast charging (50kW-250kW)
- 3.8.1.3 Smart charging & load management systems
- 3.8.1.4 Standardized connector technologies (CCS, CHAdeMO, GB/T)
- 3.8.2 Emerging technologies
- 3.8.2.1 Ultra-fast charging cables (350 kW+)
- 3.8.2.2 Lightweight and flexible cable materials
- 3.8.2.3 Liquid-cooled charging cables
- 3.8.1 Current technologies
- 3.9 Pricing analysis (Driven by Primary Research)
- 3.9.1 Historical Price Trend Analysis
- 3.9.2 Pricing Strategy by Player Type (Premium / Value / Cost-plus)
- 3.10 Patent landscape (Driven by Primary Research)
- 3.11 Trade Data Analysis (Driven by Paid Database)
- 3.11.1 Import/Export Volume & Value Trends
- 3.11.2 Key Trade Corridors & Tariff Impact
- 3.12 Capacity & Production Landscape (Driven by Primary Research)
- 3.12.1 Installed Capacity by Region & Key Producer
- 3.12.2 Capacity Utilization Rates & Expansion Pipelines
- 3.13 Impact of AI & Generative AI on the Market
- 3.13.1 AI-driven disruption of existing business models
- 3.13.2 GenAI use cases & adoption roadmap by segment
- 3.13.3 Risks, limitations & regulatory considerations
- 3.14 EV OEM strategy alignment
- 3.15 Replacement cycle analysis
- 3.15.1 Average lifecycle of EV charging cables
- 3.15.2 Influence of usage patterns & environmental factors
- 3.15.3 Replacement cost & economic considerations
- 3.15.4 Impact of technological upgrades on replacement cycles
- 3.16 Case studies
- 3.17 Forecast assumptions & scenario analysis (Driven by Primary Research)
- 3.17.1 Base Case - key macro & industry variables driving CAGR
- 3.17.2 Optimistic Scenarios - Favorable macro and industry tailwinds
- 3.17.3 Pessimistic Scenario - Macroeconomic slowdown or industry headwinds
Chapter 4 Competitive Landscape, 2025
- 4.1 Introduction
- 4.2 Company market share analysis
- 4.2.1 North America
- 4.2.2 Europe
- 4.2.3 Asia Pacific
- 4.2.4 LATAM
- 4.2.5 MEA
- 4.3 Competitive analysis of major market players
- 4.4 Competitive positioning matrix
- 4.5 Key developments
- 4.5.1 Mergers & acquisitions
- 4.5.2 Partnerships & collaborations
- 4.5.3 New product launches
- 4.5.4 Expansion plans and funding
- 4.6 Company tier benchmarking
- 4.6.1 Tier classification criteria & qualifying thresholds
- 4.6.2 Tier positioning matrix by revenue, geography & innovation
Chapter 5 Market Estimates & Forecast, By Cable, 2022 - 2035 ($Mn, Thousand Units)
- 5.1 Key trends
- 5.2 Normal/Standard Charging Cable
- 5.3 High-Power Charging (HPC) Cable
- 5.3.1 Standard/Uncooled High-Power Charging (HPC) Cable
- 5.3.2 Liquid-Cooled High-Power Charging Cable
Chapter 6 Market Estimates & Forecast, By Power Supply, 2022 - 2035 ($Mn, Thousand Units)
- 6.1 Key trends
- 6.2 Alternate Charging (AC)
- 6.3 Direct Charging (DC)
Chapter 7 Market Estimates & Forecast, By Charging Level, 2022 - 2035 ($Mn, Thousand Units)
- 7.1 Key trends
- 7.2 Level 1 (120V)
- 7.3 Level 2 (240V)
- 7.4 Level 3 (480V+)
Chapter 8 Market Estimates & Forecast, By Connector, 2022 - 2035 ($Mn, Thousand Units)
- 8.1 Key trends
- 8.2 Type 1
- 8.3 Type 2
- 8.4 CCS 1
- 8.5 CCS 2
- 8.6 CHAdeMO
- 8.7 GB/T
- 8.8 NACS/Tesla
Chapter 9 Market Estimates & Forecast, By Mode, 2022 - 2035 ($Mn, Thousand Units)
- 9.1 Key trends
- 9.2 Mode 1 & 2
- 9.3 Mode 3
- 9.4 Mode 4
Chapter 10 Market Estimates & Forecast, By Diameter, 2022 - 2035 ($Mn, Thousand Units)
- 10.1 Key trends
- 10.2 10 mm
- 10.3 10-20 mm
- 10.4 Above 20 mm
Chapter 11 Market Estimates & Forecast, By Shape, 2022 - 2035 ($Mn, Thousand Units)
- 11.1 Key trends
- 11.2 Straight
- 11.3 Coiled
Chapter 12 Market Estimates & Forecast, By Length, 2022 - 2035 ($Mn, Thousand Units)
- 12.1 Key trends
- 12.2 Below 5 meters
- 12.3 5-10 meters
- 12.4 Above 10 meters
Chapter 13 Market Estimates & Forecast, By Application, 2022 - 2035 ($Mn, Thousand Units)
- 13.1 Key trends
- 13.2 Private Charging
- 13.3 Public Charging
- 13.3.1 Shopping malls
- 13.3.2 Airports
- 13.3.3 Highways
- 13.3.4 Commercial Parking
- 13.3.5 Others
Chapter 14 Market Estimates & Forecast, By Sales Channel, 2022 - 2035 ($Mn, Thousand Units)
- 14.1 Key trends
- 14.2 OEM
- 14.3 Aftermarket
Chapter 15 Market Estimates & Forecast, By Region, 2022 - 2035 ($Mn, Thousand Units)
- 15.1 Key trends
- 15.2 North America
- 15.2.1 US
- 15.2.2 Canada
- 15.3 Europe
- 15.3.1 Germany
- 15.3.2 UK
- 15.3.3 France
- 15.3.4 Italy
- 15.3.5 Spain
- 15.3.6 Belgium
- 15.3.7 Russia
- 15.3.8 Netherlands
- 15.4 Asia Pacific
- 15.4.1 China
- 15.4.2 India
- 15.4.3 Japan
- 15.4.4 South Korea
- 15.4.5 Australia
- 15.4.6 Singapore
- 15.4.7 Malaysia
- 15.4.8 Vietnam
- 15.4.9 Thailand
- 15.5 Latin America
- 15.5.1 Brazil
- 15.5.2 Mexico
- 15.5.3 Argentina
- 15.5.4 Colombia
- 15.6 MEA
- 15.6.1 South Africa
- 15.6.2 Saudi Arabia
- 15.6.3 UAE
Chapter 16 Company Profiles
- 16.1 Global players
- 16.1.1 Phoenix Contact
- 16.1.2 TE Connectivity
- 16.1.3 LEONI
- 16.1.4 Prysmian
- 16.1.5 Aptiv
- 16.1.6 Huber+Suhner
- 16.1.7 Dyden
- 16.1.8 Coroplast
- 16.1.9 BRUGG
- 16.1.10 Tesla
- 16.2 Regional players
- 16.2.1 Chengdu Khons
- 16.2.2 Sinbon Electronics
- 16.2.3 EV TEISON
- 16.2.4 Guchen Electronics
- 16.2.5 Manlon
- 16.2.6 Pod Point
- 16.3 Emerging players
- 16.3.1 Juice Technology
- 16.3.2 Webasto
- 16.3.3 Masterplug
- 16.3.4 Zencar
 电动车充电线市场:按材料、相数、充电模式、车辆类型、连接器类型、额定电流和最终用户划分-2026-2032年全球市场预测
 全球电动车充电线市场规模、份额、趋势及成长分析报告(2026-2034年)
 全球液冷式电动车充电电缆市场:按电缆能量、电缆长度、电缆直径、应用、覆材、冷却剂和地区分類的2032年预测
 2026年全球USB-C充电线市场报告
 电动车充电线市场 - 全球产业规模、份额、趋势、机会、预测:按应用、长度、充电等级、电源、地区和竞争格局划分,2021-2031年
 电动车充电线市场规模、份额及成长分析(按线缆类型、充电线、连接器类型、直径、材质、长度及地区划分)-产业预测(2026-2033年)
 液冷式电动车充电线缆市场机会、成长驱动因素、产业趋势分析及预测(2025-2034年)
 全球电动汽车电缆市场全球电动车充电电缆市场
 2025-2033 年日本电动车充电电缆市场报告(按电缆长度、形状、充电水平、功率类型、应用和地区)