


 |
市场调查报告书
商品编码
1936069
全球液冷式电动车充电电缆市场:按电缆能量、电缆长度、电缆直径、应用、覆材、冷却剂和地区分類的2032年预测Liquid Cooled EV Charging Cable Market by Cable Power Capacity, Cable Length, Cable Diameter, Application, Jacket Material, Cooling Fluid, and Region - Global Forecast to 2032 |
||||||
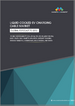
全球液冷式电动车充电电缆市场预计将从 2025 年的 5.1 亿美元成长到 2032 年的 12.8 亿美元,复合年增长率为 14.0%。
随着汽车平臺越来越多地采用 800V 电气架构,市场也不断演变。此外,更高的系统电压可以实现更快的充电速度,同时也对电缆层面的电流和温度控管提出了更高的要求。
| 调查范围 | |
|---|---|
| 调查期 | 2022-2032 |
| 基准年 | 2024 |
| 预测期 | 2025-2032 |
| 单元 | 1000套,100万美元 |
| 部分 | 电缆功率、电缆长度、电缆直径、应用、覆材、冷却剂 |
| 目标区域 | 亚太地区、欧洲、北美 |
充电基础设施营运商优先考虑能够承受反覆高功率充电且不影响安全性和易用性的电缆解决方案。液冷技术支援紧凑型电缆设计,同时在高负载下保持热稳定性。此外,充电平台标准化程度的提高简化了本地部署,而柔软性和更佳的人体工学设计则有助于在公共和商业充电设施中得到更广泛的应用。
“从应用领域来看,预计在预测期内,超快速充电细分市场将占据最大的市场份额。”
预计超快充电领域将占据液冷式电动车充电线缆市场的最大份额,这主要得益于搭乘用电动车和轻型商用车(目前占全球电动车保有量的绝大多数)即将到来的大规模需求。公共和半公共充电基础设施的规模,尤其是在高速公路和城市走廊沿线,正在迅速扩张,以满足日益增长的电动车普及需求,这为350kW以上充电站的广泛部署创造了机会。兆瓦级充电主要面向数量相对较少的重型商用车和部分豪华电动车,而超快速充电则服务于大规模的车辆群体,这些车辆需要频繁且短时间的充电,从而推动了液冷式充电线缆的持续普及。此外,高阶乘用车广泛采用800V电动车架构,也加速了对液冷式解决方案的需求,因为这些车辆能够安全且有效率地承载更高的电流。
“以电缆长度计算,预计在预测期内,5-8米长的电缆将占据最大的市场份额。”
预计在预测期内,5-8米规格的液冷式电动车充电电缆将主导市场,因为该规格电缆在高功率充电站中实现了电气性能、热控制和部署经济性之间的最佳平衡。这些电缆可最大限度地减少高电流直流充电期间的电压降和讯号衰减,同时避免长距离电缆所需的过多铜材、冷却液用量和加固成本。低压损优化了冷却液循环,即使在持续超快速充电过程中也能保持导体温度稳定。这种长度的电缆可以灵活地绕过标准充电桩和停车场布局,而无需额外的接头和连接器。这缩短了安装时间,并减少了潜在的故障点。充电桩製造商和营运商正在将此长度的电缆作为大规模公共快速充电设施最可靠、最具成本效益的选择。
“预计在预测期内,欧洲将成为成长最快的市场。”
随着公共和车队充电基础设施向高功率直流和超快充电转型,欧洲正成为液冷电动车充电电缆市场成长最快的地区。欧洲汽车製造商正积极推广800V汽车平臺,这提高了充电介面的电流密度,降低了高功率功率下风冷电缆的实用性。公共充电业者正在高速公路、都市区中心和物流走廊沿线增设150kW至350kW的充电桩,高运转率对热极限提出了更高的要求。因此,液冷电缆正成为解决温度控管、提升人体工学以及在持续使用下保持充电稳定性的首选方案。该地区的竞争格局包括全球和本地供应商,例如瑞士的HUBER+SUHNER、德国的Phoenix Contact和Leoni。
本报告研究了全球液冷电动车充电电缆市场,并深入分析了关键驱动因素和限制因素、产品开发和创新以及竞争格局。
目录
第一章 引言
第二章执行摘要
第三章 主要发现
- 液冷式电动车充电线缆市场蕴藏着巨大的机会
- 按电缆功率容量分類的液冷式电动车充电电缆市场
- 液冷式电动车充电线缆市场:依应用领域划分
- 按线缆长度分類的液冷式电动车充电线缆市场
- 以电缆直径分類的液冷式电动车充电电缆市场
- 液冷式电动车充电线缆市场:依覆材划分
- 液冷式电动车充电线缆市场:依冷却剂分类
- 按地区分類的液冷式电动车充电电缆市场
第四章 市场概览
- 市场动态
- 司机
- 抑制因素
- 机会
- 任务
- 未满足的需求和閒置频段
- 简单且维护成本低的冷却液管理
- 冷媒缺乏统一的安全和认证标准
- 适用于中功率快速充电(250-350KW)的成本最佳化解决方案
- 相互关联的市场与跨产业机会
- 液冷式电动车充电线缆市场主要参与企业的策略性倡议
第五章 产业趋势
- 波特五力分析
- 总体经济指标
- GDP趋势与预测
- 液冷式电动车充电线产业的全球趋势
- 汽车和运输业的全球趋势
- 供应链分析
- 生态系分析
- 原料和元件供应商
- 液冷式电动车充电电缆和连接器製造商
- 温度控管和冷却技术供应商
- 充电设备OEM
- 车辆原始设备製造商
- 电动车充电基础设施供应商
- 测试、认证和标准组织
- 定价分析
- 主要企业液冷式电动车充电线的平均售价
- 各地区平均销售价格趋势
- 参考价格分析:按电缆功耗
- 贸易分析
- 导入场景
- 出口方案
- 重大会议和活动(2026-2027)
- 影响客户业务的趋势和颠覆性因素
- 投资和资金筹措方案
- 案例研究分析
- 2025年美国关税的影响
- 主要关税税率
- 价格影响分析
- 对国家的影响
- 对终端用户产业的影响
- MNM的主要企业洞察
- 本地电动车充电点
第六章:技术进步、人工智慧影响、专利、创新与未来应用
- 主要新技术
- 液冷式电动车充电电缆中的氟基绝缘材料
- 连接器整合式微通道液冷
- 互补技术
- 充电器和电缆共用热感迴路集成
- 电池缓衝式超级充电
- 邻近技术
- 技术/产品蓝图
- 专利分析
- 未来应用
- 商用车辆的停车场收费
- 电池缓衝式和电网约束式充电站
- 人工智慧对液冷式电动车充电线市场的影响
- 主要应用案例和市场潜力
- 液冷式电动车充电线缆市场製造商/OEM最佳实践
- 液冷式电动车充电线市场人工智慧应用案例研究
- 相互关联的生态系统及其对市场公司的影响
- 客户对采用人工智慧驱动的液冷式电动车充电线的准备情况
第七章:监理环境
- 地方法规和合规性
- 监管机构、政府机构和其他组织
- 法规结构
- 对永续性的承诺
- 监管政策对永续性努力的影响
第八章:顾客状况与购买行为
- 决策流程
- 主要相关利益者和采购标准
- 招募障碍和内部挑战
- 维修准备与作战能力之间的差距
- 标准化和互通性的局限性
- 不确定利用率的经济学
- 各类终端用户的未满足需求
- 持续高功率,无热衰减
- 减轻电缆重量和简化操作
- 公共直流快速充电网路营运商
- 大型和商用车辆的充电服务供应商
第九章 液冷式电动车充电线市场:依应用领域划分
- 超快速充电
- 百万级充电
- 主要发现
第十章 依电缆直径分類的液冷式电动车充电电缆市场
- 小于 30 毫米
- 30~50mm
- 超过 50 毫米
- 主要发现
第十一章 依线材长度分類的液冷式电动车充电线缆市场
- 小于5米
- 5~8m
- 超过8米
- 主要发现
第十二章 液冷式电动车充电电缆市场:依冷却技术划分
- 水乙二醇
- 其他的
- 主要发现
第十三章 液冷式电动车充电线缆市场:依覆材分类
- 橡皮
- 热可塑性橡胶
- 聚氯乙烯
- 主要发现
第十四章 依电缆功率容量分類的液冷式电动车充电电缆市场
- 300~499kW
- 500~900kW
- 超过900千瓦
- 主要发现
第十五章 液冷式电动车充电线市场(按地区划分)
- 亚太地区
- 中国
- 印度
- 日本
- 韩国
- 欧洲
- 德国
- 法国
- 义大利
- 西班牙
- 英国
- 其他欧洲
- 北美洲
- 我们
- 加拿大
第十六章 竞争格局
- 概述
- 主要参与企业的策略/优势
- 主要企业市占率(2026 年)
- 主要企业的收入分析
- 公司估值和财务指标
- 品牌/产品对比
- 企业评估矩阵:主要企业(2026 年)
- 公司评估矩阵:Start-Ups/中小企业(2026 年)
- 竞争场景
第十七章:公司简介
- 主要企业
- PHOENIX CONTACT
- BRUGG GROUP AG
- SINBON ELECTRONICS CO., LTD.
- HUBER+SUHNER
- LEONI AG
- OMG EV CABLE
- KEMPOWER
- FIVER NEW ENERGY TECHNOLOGY CO., LTD
- SHANGHAI MIDA EV POWER CO., LTD.
- COROFLEX
- TE CONNECTIVITY
- ZHEJIANG YONGGUI ELECTRIC EQUIPMENT CO., LTD.
- 其他公司
- CALEDONIAN CABLES LTD.
- SAICHUAN ELECTRONIC CO., LTD.
- SUZHOU YIHANG ELECTRONIC SCIENCE & TECHNOLOGY CO., LTD.
- QINGDAO PENODA ELECTRICAL CO., LTD.
- TOTCABLES
- CPC
- ITT INC.
- TEISON ENERGY TECHNOLOGY CO., LTD.
- LS CABLE & SYSTEM LTD.
- SOUTHWIRE COMPANY, LLC
- VOSS
- SUMITOMO ELECTRIC INDUSTRIES, LTD.
- JOHNSON ELECTRIC HOLDINGS LIMITED
第十八章调查方法
第十九章附录
The liquid cooled EV charging cable market is projected to grow from USD 0.51 billion in 2025 to USD 1.28 billion by 2032, at a CAGR of 14.0%. The market is advancing as vehicle platforms are increasingly adopting 800 V electrical architectures. Additionally, high system voltages are enabling faster charging and raising current and thermal management requirements at the cable level.
| Scope of the Report | |
|---|---|
| Years Considered for the Study | 2022-2032 |
| Base Year | 2024 |
| Forecast Period | 2025-2032 |
| Units Considered | Volume (Thousand Units) and Value (USD Million) |
| Segments | Cable Power Capacity, Cable Length, Cable Diameter, Application, Jacket Material, Cooling Fluid |
| Regions covered | Asia Pacific, Europe, North America |
Charging infrastructure operators are prioritizing cable solutions that can sustain repeated high-power charging sessions without compromising safety or handling. Liquid cooling supports compact cable designs while maintaining thermal stability under elevated loads. In parallel, increasing standardization across charger platforms is simplifying deployment across regions, while improvements in flexibility and ergonomics are supporting broader adoption in public and commercial charging locations.
"By application, the ultrafast charging segment is projected to account for the largest market during the forecast period."
The ultrafast charging segment is projected to account for the largest share in the liquid cooled EV charging cable market because it addresses the immediate high-volume demand of passenger EVs and light commercial vehicles, which represent the majority of global EV fleets today. The scale of public and semi-public charging infrastructure, particularly along highways and urban corridors, is expanding rapidly to meet rising EV adoption, creating extensive deployment opportunities for 350 kW and above charging stations. Unlike megawatt charging, which targets a relatively smaller fleet of heavy-duty vehicles and select luxury EVs, ultrafast charging serves a far larger base of vehicles requiring frequent, short-duration charges, driving consistent utilization of liquid cooled cables. Additionally, the growth of 800 V EV architectures in high-end passenger vehicles is accelerating the need for liquid cooled solutions, as these vehicles can exploit higher current flows safely and efficiently.
"By cable length, the 5-8 meters segment is projected to account for the largest market during the forecast period."
The 5-8 meters segment is projected to dominate the liquid cooled EV charging cable market during the forecast period as these cables deliver the most efficient balance between electrical performance, thermal control, and deployment economics at high-power charging sites. These cables minimize voltage drop and signal dilution during high current DC charging while avoiding the excess copper, coolant volume, and reinforcement costs associated with longer cable runs. They allow optimized coolant circulation with lower pressure losses, which helps maintain stable conductor temperatures during sustained ultra-fast charging. Cables in this length range enable flexible cable routing around standard charger pedestals and vehicle parking layouts without introducing additional joints or connectors, reducing installation time and potential failure points. Charger manufacturers and operators are standardizing this length as the most reliable and cost-efficient specification for large-scale public fast charging deployments.
"Europe is projected to be the fastest-growing market during the forecast period."
Europe is emerging as the fastest-growing region in the liquid cooled EV charging cable market, as public and fleet charging infrastructure is increasingly shifting toward high-power DC and ultrafast charging. Automakers in Europe are actively deploying 800 V vehicle platforms, which are increasing current density at charging interfaces and making air-cooled cables less practical at high power levels. Public charging operators are installing more 150 kW to 350 kW chargers along highways, urban hubs, and logistics corridors, where high utilization rates are pushing thermal limits. Liquid cooled cables are therefore becoming the preferred solution to manage heat, improve ergonomics, and maintain charging consistency under continuous use. Regional competitive landscape includes global and local suppliers, such as HUBER+SUHNER (Switzerland), Phoenix Contact (Germany), and Leoni (Germany).
In-depth interviews were conducted with CEOs, marketing directors, other innovation and technology directors, and executives from various key organizations operating in this market.
- By Company Type: EV Charging Cable Manufacturers - 40%, Charging Station Providers - 40%, Others - 20%
- By Designation: CXOs - 20%, Directors - 30%, Others - 50%
- By Country: North America - 30%, Europe - 30%, Asia Pacific - 40%
The liquid cooled EV charging cable market is dominated by global players such as Phoenix Contact (Germany), HUBER+SUHNER (Switzerland), BRUGG eConnect (Switzerland), Sinbon Electronics Co., Ltd. (Taiwan), and LEONI (Germany). These companies have adopted strategies such as product launches, strategic deals, and geographic expansions to strengthen their market presence and technological capabilities.
Research Coverage:
The report covers the liquid cooled EV charging cable market by cable power capacity (300-499 kW, 500-900 kW, above 900 kW), application (ultrafast charging and megawatt charging), cable length (below 5 meters, 5-8 meters, and above 8 meters), cable diameter (below 30 mm, 30-50 mm, and above 50 mm), jacket material (rubber, thermoplastic elastomer, and polyvinyl chloride), cooling fluid (water glycol and others), and region (Asia Pacific, Europe and North America). It covers the competitive landscape and company profiles of the major players in the liquid cooled EV charging cable market ecosystem.
The study also includes an in-depth competitive analysis of the key players in the market, along with their company profiles, key observations related to product and business offerings, recent developments, and key market strategies.
Key Benefits of Buying the Report:
- This report will help market leaders/new entrants in this market with information on the closest approximations of revenue numbers for the overall testing of the liquid cooled EV charging cable ecosystem and its subsegments.
- This report will help stakeholders understand the competitive landscape and gain more insights to position their businesses better and plan suitable go-to-market strategies.
- This report will also help stakeholders understand the market's pulse and provide information on key market drivers, restraints, challenges, and opportunities.
The report provides insights into the following pointers:
- Analysis of key drivers (rising demand for ultrafast and megawatt charging, growing shift to 800 V EV Architecture, need for improved cable design with quick heat dissipation qualities), restraints (high maintenance cost, high installation and service complexity), challenges (regulatory uncertainty with coolant systems), and opportunities (advancements in dielectric coolants and material technology, growing use case for heavy duty truck charging)
- Product Development/Innovation: Detailed insights into upcoming technologies, research & development activities, and product launches in the liquid cooled EV charging cable market
- Market Development: Comprehensive information about lucrative markets across varied regions
- Market Diversification: Exhaustive information about new products, untapped geographies, recent developments, and investments in the liquid cooled EV charging cable market
- Competitive Assessment: In-depth assessment of market ranking, growth strategies, and service offerings of leading players like Phoenix Contact (Germany), HUBER+SUHNER (Switzerland), BRUGG eConnect (Switzerland), Sinbon Electronics Co., Ltd. (Taiwan), and LEONI (Germany), among others, in the liquid cooled EV charging cable market
TABLE OF CONTENTS
1 INTRODUCTION
- 1.1 STUDY OBJECTIVES
- 1.2 MARKET DEFINITION
- 1.3 STUDY SCOPE
- 1.3.1 MARKET SEGMENTATION & REGIONAL SCOPE
- 1.3.2 INCLUSIONS & EXCLUSIONS
- 1.4 YEARS CONSIDERED
- 1.5 CURRENCY CONSIDERED
- 1.6 STAKEHOLDERS
2 EXECUTIVE SUMMARY
- 2.1 MARKET HIGHLIGHTS & KEY INSIGHTS
- 2.2 KEY MARKET PARTICIPANTS: MAPPING OF STRATEGIC DEVELOPMENTS
- 2.3 DISRUPTIVE TRENDS IN LIQUID COOLED EV CHARGING CABLE MARKET
- 2.4 HIGH GROWTH SEGMENTS
- 2.5 REGIONAL SNAPSHOT: MARKET SIZE, GROWTH RATE, AND FORECAST
3 PREMIUM INSIGHTS
- 3.1 ATTRACTIVE OPPORTUNITIES FOR PLAYERS IN LIQUID COOLED EV CHARGING CABLE MARKET
- 3.2 LIQUID COOLED EV CHARGING CABLE MARKET, BY CABLE POWER CAPACITY
- 3.3 LIQUID COOLED EV CHARGING CABLE MARKET, BY APPLICATION
- 3.4 LIQUID COOLED EV CHARGING CABLE MARKET, BY CABLE LENGTH
- 3.5 LIQUID COOLED EV CHARGING CABLE MARKET, BY CABLE DIAMETER
- 3.6 LIQUID COOLED EV CHARGING CABLE MARKET, BY JACKET MATERIAL
- 3.7 LIQUID COOLED EV CHARGING CABLE MARKET, BY COOLING FLUID
- 3.8 LIQUID COOLED EV CHARGING CABLE MARKET, BY REGION
4 MARKET OVERVIEW
- 4.1 INTRODUCTION
- 4.2 MARKET DYNAMICS
- 4.2.1 DRIVERS
- 4.2.1.1 Rising demand for ultrafast and megawatt charging
- 4.2.1.2 Growing shift to 800V EV architecture
- 4.2.1.3 Need for improved cable design with fast heat dissipation qualities
- 4.2.2 RESTRAINTS
- 4.2.2.1 High maintenance cost
- 4.2.2.2 High installation and service complexity
- 4.2.3 OPPORTUNITIES
- 4.2.3.1 Advancements in dielectric coolant and material technology
- 4.2.3.2 Increasing use cases for heavy-duty truck charging
- 4.2.4 CHALLENGES
- 4.2.4.1 Regulatory uncertainty with coolant systems
- 4.2.1 DRIVERS
- 4.3 UNMET NEEDS AND WHITE SPACES
- 4.3.1 SIMPLIFIED AND LOW-MAINTENANCE COOLANT MANAGEMENT
- 4.3.2 LACK OF HARMONIZED SAFETY AND CERTIFICATION STANDARDS FOR COOLANTS
- 4.3.3 COST-OPTIMIZED SOLUTIONS FOR MID-POWER FAST CHARGING (250-350 KW)
- 4.4 INTERCONNECTED MARKETS AND CROSS-SECTOR OPPORTUNITIES
- 4.5 STRATEGIC MOVES BY KEY PLAYERS IN LIQUID COOLED EV CHARGING CABLE MARKET
5 INDUSTRY TRENDS
- 5.1 PORTER'S FIVE FORCES ANALYSIS
- 5.1.1 THREAT FROM NEW ENTRANTS
- 5.1.2 BARGAINING POWER OF SUPPLIERS
- 5.1.3 BARGAINING POWER OF BUYERS
- 5.1.4 THREAT FROM SUBSTITUTES
- 5.1.5 INTENSITY OF COMPETITIVE RIVALRY
- 5.2 MACROECONOMIC INDICATORS
- 5.2.1 INTRODUCTION
- 5.2.2 GDP TRENDS AND FORECAST
- 5.2.3 TRENDS IN GLOBAL LIQUID COOLED EV CHARGING CABLE INDUSTRY
- 5.2.4 TRENDS IN GLOBAL AUTOMOTIVE & TRANSPORTATION INDUSTRY
- 5.3 SUPPLY CHAIN ANALYSIS
- 5.4 ECOSYSTEM ANALYSIS
- 5.4.1 RAW MATERIAL AND COMPONENT SUPPLIERS
- 5.4.2 LIQUID COOLED EV CHARGING CABLE AND CONNECTOR MANUFACTURERS
- 5.4.3 THERMAL MANAGEMENT AND COOLING TECHNOLOGY PROVIDERS
- 5.4.4 CHARGING EQUIPMENT OEMS
- 5.4.5 VEHICLE OEMS
- 5.4.6 EV CHARGING INFRASTRUCTURE OPERATORS
- 5.4.7 TESTING, CERTIFICATION, AND STANDARD BODIES
- 5.5 PRICING ANALYSIS
- 5.5.1 AVERAGE SELLING PRICE FOR LIQUID COOLED EV CHARGING CABLES, BY KEY PLAYER
- 5.5.2 AVERAGE SELLING PRICE TREND, BY REGION
- 5.5.3 INDICATIVE PRICING ANALYSIS, BY CABLE POWER CAPACITY
- 5.6 TRADE ANALYSIS
- 5.6.1 IMPORT SCENARIO
- 5.6.2 EXPORT SCENARIO
- 5.7 KEY CONFERENCES & EVENTS, 2026-2027
- 5.8 TRENDS & DISRUPTIONS IMPACTING CUSTOMER BUSINESS
- 5.9 INVESTMENT & FUNDING SCENARIO
- 5.10 CASE STUDY ANALYSIS
- 5.10.1 ENABLING ULTRAFAST CHARGING THROUGH LIQUID COOLED CABLE ARCHITECTURE
- 5.10.2 SCALING HIGH-POWER CHARGING THROUGH DEPLOYMENT OF LIQUID COOLED CABLES
- 5.10.3 IMPROVING RELIABILITY OF DC FAST CHARGING CABLES THROUGH LIQUID COOLING
- 5.10.4 DEPLOYING LIQUID COOLED CHARGING CABLES TO SUPPORT RELIABLE HIGH-POWER DC CHARGING
- 5.10.5 INTEGRATION OF LIQUID COOLED CABLES IN ULTRAFAST DC CHARGING SYSTEMS
- 5.11 IMPACT OF 2025 US TARIFF
- 5.11.1 INTRODUCTION
- 5.11.2 KEY TARIFF RATES
- 5.11.3 PRICE IMPACT ANALYSIS
- 5.11.4 IMPACT ON COUNTRY/REGION
- 5.11.4.1 US
- 5.11.4.2 Europe
- 5.11.4.3 Asia Pacific
- 5.11.5 IMPACT ON END-USE INDUSTRIES
- 5.12 MNM INSIGHTS INTO KEY PLAYERS
- 5.13 EV CHARGING POINTS ACROSS REGIONS
- 5.13.1 PARC GLOBAL EV CHARGING POINTS, 2021-2024 (THOUSAND UNITS)
- 5.13.2 PARC GLOBAL EV CHARGING POINTS, 2025-2032 (THOUSAND UNITS)
6 TECHNOLOGICAL ADVANCEMENTS, AI-DRIVEN IMPACT, PATENTS, INNOVATIONS, AND FUTURE APPLICATIONS
- 6.1 KEY EMERGING TECHNOLOGIES
- 6.1.1 FLUORINATED DIELECTRICS IN LIQUID COOLED EV CHARGING CABLES
- 6.1.2 CONNECTOR-INTEGRATED MICRO-CHANNEL LIQUID COOLING
- 6.2 COMPLEMENTARY TECHNOLOGIES
- 6.2.1 SHARED THERMAL LOOP INTEGRATION BETWEEN CHARGERS AND CABLES
- 6.2.2 BATTERY-BUFFERED MEGA CHARGING
- 6.3 ADJACENT TECHNOLOGIES
- 6.3.1 SHARED THERMAL LOOP INTEGRATION BETWEEN CHARGERS AND CABLES
- 6.4 TECHNOLOGY/PRODUCT ROADMAP
- 6.5 PATENT ANALYSIS
- 6.5.1 INTRODUCTION
- 6.6 FUTURE APPLICATIONS
- 6.6.1 DEPOT CHARGING FOR COMMERCIAL FLEETS
- 6.6.2 BATTERY-BUFFERED AND GRID-CONSTRAINED CHARGING STATIONS
- 6.7 IMPACT OF AI ON LIQUID COOLED EV CHARGING CABLE MARKET
- 6.7.1 TOP USE CASES AND MARKET POTENTIAL
- 6.7.2 BEST PRACTICES FOLLOWED BY MANUFACTURERS/OEMS IN LIQUID COOLED EV CHARGING CABLE MARKET
- 6.7.3 CASE STUDIES RELATED TO IMPLEMENTATION OF AI IN LIQUID COOLED EV CHARGING CABLE MARKET
- 6.7.4 INTERCONNECTED ECOSYSTEM AND IMPACT ON MARKET PLAYERS
- 6.7.5 CLIENTS' READINESS TO ADOPT AI-INTEGRATED LIQUID COOLED EV CHARGING CABLES
7 REGULATORY LANDSCAPE
- 7.1 REGIONAL REGULATIONS AND COMPLIANCE
- 7.1.1 REGULATORY BODIES, GOVERNMENT AGENCIES, AND OTHER ORGANIZATIONS
- 7.1.2 REGULATORY FRAMEWORK
- 7.2 SUSTAINABILITY INITIATIVES
- 7.3 IMPACT OF REGULATORY POLICIES ON SUSTAINABILITY INITIATIVES
8 CUSTOMER LANDSCAPE & BUYER BEHAVIOR
- 8.1 DECISION-MAKING PROCESS
- 8.2 KEY STAKEHOLDERS & BUYING CRITERIA
- 8.2.1 KEY STAKEHOLDERS INVOLVED IN BUYING PROCESS AND EVALUATION CRITERIA
- 8.2.2 BUYING CRITERIA
- 8.3 ADOPTION BARRIERS AND INTERNAL CHALLENGES
- 8.3.1 MAINTENANCE READINESS AND OPERATIONAL CAPABILITY GAPS
- 8.3.2 STANDARDIZATION AND INTEROPERABILITY LIMITATIONS
- 8.3.3 UNCERTAIN UTILIZATION ECONOMICS
- 8.4 UNMET NEEDS OF VARIOUS END USERS
- 8.4.1 SUSTAINED ULTRA-HIGH-POWER DELIVERY WITHOUT THERMAL DERATING
- 8.4.2 REDUCTION IN CABLE WEIGHT AND HANDLING COMPLEXITY
- 8.4.3 PUBLIC DC FAST-CHARGING NETWORK OPERATORS
- 8.4.4 HEAVY DUTY AND COMMERCIAL FLEET CHARGING OPERATORS
9 LIQUID COOLED EV CHARGING CABLE MARKET, BY APPLICATION
- 9.1 INTRODUCTION
- 9.2 ULTRAFAST CHARGING
- 9.2.1 NEED FOR HIGH POWER DENSITY AND HEAT MANAGEMENT IN ULTRAFAST CHARGING TO DRIVE DEMAND
- 9.3 MEGAWATT CHARGING
- 9.3.1 HEAVY DUTY EV ELECTRIFICATION TO DRIVE DEMAND FOR MEGAWATT LIQUID COOLED CHARGING CABLES
- 9.4 KEY PRIMARY INSIGHTS
10 LIQUID COOLED EV CHARGING CABLE MARKET, BY CABLE DIAMETER
- 10.1 INTRODUCTION
- 10.2 BELOW 30 MM
- 10.2.1 LIMITED THERMAL MASS TO DRIVE HIGH-VELOCITY COOLANT FLOW IN COMPACT LIQUID COOLED CABLES
- 10.3 30-50 MM
- 10.3.1 350 KW CLASS CHARGING EVENTS TO FAVOR 30-50 MM DIAMETER DESIGNS
- 10.4 ABOVE 50 MM
- 10.4.1 MEGAWATT CHARGING REQUIREMENTS TO DRIVE ADOPTION OF ABOVE 50 MM CABLE DIAMETERS
- 10.5 KEY PRIMARY INSIGHTS
11 LIQUID COOLED EV CHARGING CABLE MARKET, BY CABLE LENGTH
- 11.1 INTRODUCTION
- 11.2 BELOW 5 METERS
- 11.2.1 SPACE-CONSTRAINED CHARGING ENVIRONMENTS TO DRIVE ADOPTION OF BELOW 5 METER LIQUID COOLED CABLES
- 11.3 5-8 METERS
- 11.3.1 NEED FOR STANDARDIZATION TO DRIVE PREFERENCE TOWARD CABLES WITH LENGTH BETWEEN 5 AND 8 METERS
- 11.4 ABOVE 8 METERS
- 11.4.1 NEED FOR ADEQUATE CABLE REACH AT COMPLEX SITES TO SUPPORT GROWTH
- 11.5 KEY PRIMARY INSIGHTS
12 LIQUID COOLED EV CHARGING CABLE MARKET, BY COOLING TECHNOLOGY
- 12.1 INTRODUCTION
- 12.2 WATER GLYCOL
- 12.2.1 NEED FOR HIGH POWER DENSITY AND HEAT MANAGEMENT TO DRIVE DEMAND FOR ULTRAFAST LIQUID COOLED CABLES
- 12.3 OTHERS
- 12.4 KEY PRIMARY INSIGHTS
13 LIQUID COOLED EV CHARGING CABLE MARKET, BY JACKET MATERIAL
- 13.1 INTRODUCTION
- 13.2 RUBBER
- 13.2.1 NEED FOR SPACE-CONSTRAINED CHARGING ENVIRONMENTS TO DRIVE MARKET
- 13.3 THERMOPLASTIC ELASTOMER
- 13.3.1 FOCUS ON HIGH DC CHARGING POWER TO INCREASE RELIANCE ON THERMOPLASTIC ELASTOMER JACKETS
- 13.4 POLYVINYL CHLORIDE
- 13.4.1 NEED FOR DEPLOYMENT OF PRICE-FOCUSED CHARGING CABLES TO SUSTAIN USE OF PVC JACKET MATERIALS
- 13.5 KEY PRIMARY INSIGHTS
14 LIQUID COOLED EV CHARGING CABLE MARKET, BY CABLE POWER CAPACITY
- 14.1 INTRODUCTION
- 14.2 300-499 KW
- 14.2.1 STANDARDIZATION OF 350 KW DC CHARGERS TO DRIVE SCALED ADOPTION OF 300-499 KW CABLE SYSTEMS
- 14.3 500-900 KW
- 14.3.1 RISING USE OF HIGH-VOLTAGE EV PLATFORMS TO ENABLE ADOPTION OF 500-900 KW CABLE SYSTEMS
- 14.4 > 900 KW
- 14.4.1 NEED FOR MEGAWATT CHARGING SYSTEMS TO PROPEL DEMAND FOR ABOVE 900 KW CABLE ARCHITECTURES
- 14.5 KEY PRIMARY INSIGHTS
15 LIQUID COOLED EV CHARGING CABLE MARKET, BY REGION
- 15.1 INTRODUCTION
- 15.2 ASIA PACIFIC
- 15.2.1 CHINA
- 15.2.1.1 Adoption of high-power EVs to drive market growth
- 15.2.2 INDIA
- 15.2.2.1 Increasing demand for chargers with power capacity of 120 kW to drive market
- 15.2.3 JAPAN
- 15.2.3.1 Stringent thermal and space constraints to drive adoption of liquid cooled high-power charging cables
- 15.2.4 SOUTH KOREA
- 15.2.4.1 Adoption of high-voltage EV platforms to drive shift toward ultrafast liquid cooled charging infrastructure
- 15.2.1 CHINA
- 15.3 EUROPE
- 15.3.1 GERMANY
- 15.3.1.1 Consumer demand for ultrafast 1 and 2 charger integration to drive growth
- 15.3.2 FRANCE
- 15.3.2.1 Focus on smart grid investments and cross-sector partnerships to drive growth
- 15.3.3 ITALY
- 15.3.3.1 Cross-sector collaboration and renewable integration to drive growth
- 15.3.4 SPAIN
- 15.3.4.1 Strategic collaborations between energy firms, technology companies, and city authorities to drive market
- 15.3.5 UK
- 15.3.5.1 Consolidation of high-power charging hubs to drive adoption of liquid cooled cables
- 15.3.6 REST OF EUROPE
- 15.3.1 GERMANY
- 15.4 NORTH AMERICA
- 15.4.1 US
- 15.4.1.1 Large-scale adoption of EVs and high-power DC charging to boost demand
- 15.4.2 CANADA
- 15.4.2.1 Expansion of high-power DC charging networks to accelerate adoption of liquid cooled cables
- 15.4.1 US
16 COMPETITIVE LANDSCAPE
- 16.1 OVERVIEW
- 16.2 KEY PLAYER STRATEGIES/RIGHT TO WIN
- 16.3 MARKET SHARE OF KEY PLAYERS, 2026
- 16.4 REVENUE ANALYSIS OF KEY PLAYERS
- 16.5 COMPANY VALUATION AND FINANCIAL METRICS
- 16.5.1 COMPANY VALUATION
- 16.5.2 FINANCIAL METRICS
- 16.6 BRAND/PRODUCT COMPARISON
- 16.7 COMPANY EVALUATION MATRIX: KEY PLAYERS, 2026
- 16.7.1 STARS
- 16.7.2 EMERGING LEADERS
- 16.7.3 PERVASIVE PLAYERS
- 16.7.4 PARTICIPANTS
- 16.7.5 COMPANY FOOTPRINT: KEY PLAYERS
- 16.7.5.1 Company footprint
- 16.7.5.2 Region footprint
- 16.7.5.3 Cable power capacity footprint
- 16.7.5.4 Cooling fluid footprint
- 16.8 COMPANY EVALUATION MATRIX: STARTUPS/SMES, 2026
- 16.8.1 PROGRESSIVE COMPANIES
- 16.8.2 RESPONSIVE COMPANIES
- 16.8.3 DYNAMIC COMPANIES
- 16.8.4 STARTING BLOCKS
- 16.8.5 COMPETITIVE BENCHMARKING
- 16.8.5.1 List of startups/SMEs
- 16.8.5.2 Competitive benchmarking of startups/SMEs
- 16.9 COMPETITIVE SCENARIO
- 16.9.1 PRODUCT LAUNCHES/DEVELOPMENTS
- 16.9.2 DEALS
- 16.9.3 EXPANSION
- 16.9.4 OTHER DEVELOPMENTS
17 COMPANY PROFILES
- 17.1 KEY PLAYERS
- 17.1.1 PHOENIX CONTACT
- 17.1.1.1 Business overview
- 17.1.1.2 Products offered
- 17.1.1.3 Recent developments
- 17.1.1.3.1 Product launches/developments
- 17.1.1.3.2 Deals
- 17.1.1.3.3 Other developments
- 17.1.1.4 MnM view
- 17.1.1.4.1 Key strengths/Right to win
- 17.1.1.4.2 Strategic choices
- 17.1.1.4.3 Weaknesses & competitive threats
- 17.1.2 BRUGG GROUP AG
- 17.1.2.1 Business overview
- 17.1.2.2 Products offered
- 17.1.2.3 MnM view
- 17.1.2.3.1 Key strengths/Right to win
- 17.1.2.3.2 Strategic choices
- 17.1.2.3.3 Weaknesses & competitive threats
- 17.1.3 SINBON ELECTRONICS CO., LTD.
- 17.1.3.1 Business overview
- 17.1.3.2 Products offered
- 17.1.3.3 Recent developments
- 17.1.3.3.1 Expansion
- 17.1.3.3.2 Other developments
- 17.1.3.4 MnM view
- 17.1.3.4.1 Key strengths/Right to win
- 17.1.3.4.2 Strategic choices
- 17.1.3.4.3 Weaknesses & competitive threats
- 17.1.4 HUBER+SUHNER
- 17.1.4.1 Business overview
- 17.1.4.2 Products offered
- 17.1.4.3 Recent developments
- 17.1.4.3.1 Product launches/developments
- 17.1.4.4 MnM view
- 17.1.4.4.1 Key strengths/Right to win
- 17.1.4.4.2 Strategic choices
- 17.1.4.4.3 Weaknesses & competitive threats
- 17.1.5 LEONI AG
- 17.1.5.1 Business overview
- 17.1.5.2 Products offered
- 17.1.5.3 Recent developments
- 17.1.5.3.1 Product launches/developments
- 17.1.5.3.2 Deals
- 17.1.5.3.3 Other developments
- 17.1.5.4 MnM view
- 17.1.5.4.1 Key strengths/Right to win
- 17.1.5.4.2 Strategic choices
- 17.1.5.4.3 Weaknesses & competitive threats
- 17.1.6 OMG EV CABLE
- 17.1.6.1 Business overview
- 17.1.6.2 Products offered
- 17.1.7 KEMPOWER
- 17.1.7.1 Business overview
- 17.1.7.2 Products offered
- 17.1.7.3 Recent developments
- 17.1.7.3.1 Product launches/developments
- 17.1.8 FIVER NEW ENERGY TECHNOLOGY CO., LTD
- 17.1.8.1 Business overview
- 17.1.8.2 Products offered
- 17.1.9 SHANGHAI MIDA EV POWER CO., LTD.
- 17.1.9.1 Business overview
- 17.1.9.2 Products offered
- 17.1.10 COROFLEX
- 17.1.10.1 Business overview
- 17.1.10.2 Products offered
- 17.1.10.3 Recent developments
- 17.1.10.3.1 Product launches/developments
- 17.1.10.3.2 Expansion
- 17.1.10.3.3 Other developments
- 17.1.11 TE CONNECTIVITY
- 17.1.11.1 Business overview
- 17.1.11.2 Products offered
- 17.1.11.3 Recent developments
- 17.1.11.3.1 Product launches/developments
- 17.1.12 ZHEJIANG YONGGUI ELECTRIC EQUIPMENT CO., LTD.
- 17.1.12.1 Business overview
- 17.1.12.2 Products offered
- 17.1.12.3 Recent developments
- 17.1.12.3.1 Product launches/developments
- 17.1.12.3.2 Deals
- 17.1.12.3.3 Expansion
- 17.1.1 PHOENIX CONTACT
- 17.2 OTHER PLAYERS
- 17.2.1 CALEDONIAN CABLES LTD.
- 17.2.2 SAICHUAN ELECTRONIC CO., LTD.
- 17.2.3 SUZHOU YIHANG ELECTRONIC SCIENCE & TECHNOLOGY CO., LTD.
- 17.2.4 QINGDAO PENODA ELECTRICAL CO., LTD.
- 17.2.5 TOTCABLES
- 17.2.6 CPC
- 17.2.7 ITT INC.
- 17.2.8 TEISON ENERGY TECHNOLOGY CO., LTD.
- 17.2.9 LS CABLE & SYSTEM LTD.
- 17.2.10 SOUTHWIRE COMPANY, LLC
- 17.2.11 VOSS
- 17.2.12 SUMITOMO ELECTRIC INDUSTRIES, LTD.
- 17.2.13 JOHNSON ELECTRIC HOLDINGS LIMITED
18 RESEARCH METHODOLOGY
- 18.1 RESEARCH DATA
- 18.1.1 SECONDARY DATA
- 18.1.1.1 List of secondary sources
- 18.1.1.2 Key data from secondary sources
- 18.1.2 PRIMARY DATA
- 18.1.2.1 Primary interviewees: Demand and supply sides
- 18.1.2.2 Key industry insights and breakdown of primary interviews
- 18.1.2.3 List of primary participants
- 18.1.1 SECONDARY DATA
- 18.2 MARKET SIZE ESTIMATION
- 18.2.1 BOTTOM-UP APPROACH
- 18.2.2 TOP-DOWN APPROACH
- 18.3 DATA TRIANGULATION
- 18.4 FACTOR ANALYSIS
- 18.5 RESEARCH ASSUMPTIONS
- 18.6 RESEARCH LIMITATIONS
- 18.7 RISK ASSESSMENT
19 APPENDIX
- 19.1 KEY INSIGHTS FROM INDUSTRY EXPERTS
- 19.2 DISCUSSION GUIDE
- 19.3 KNOWLEDGESTORE: MARKETSANDMARKETS' SUBSCRIPTION PORTAL
- 19.4 CUSTOMIZATION OPTIONS
- 19.5 RELATED REPORTS
- 19.6 AUTHOR DETAILS
List of Tables
- TABLE 1 LIQUID COOLED EV CHARGING CABLE MARKET, BY CABLE POWER CAPACITY
- TABLE 2 LIQUID COOLED EV CHARGING CABLE MARKET, BY CABLE LENGTH
- TABLE 3 LIQUID COOLED EV CHARGING CABLE MARKET, BY CABLE DIAMETER
- TABLE 4 LIQUID COOLED EV CHARGING CABLE MARKET, BY APPLICATION
- TABLE 5 LIQUID COOLED EV CHARGING CABLE MARKET, BY JACKET MATERIAL
- TABLE 6 LIQUID COOLED EV CHARGING CABLE MARKET, BY COOLING FLUID
- TABLE 7 CURRENCY EXCHANGE RATES, 2020-2025
- TABLE 8 LIQUID COOLED EV CHARGING CABLE REQUIREMENTS FOR CHARGER POWER RANGES
- TABLE 9 COMPANIES PROVIDING LIQUID COOLED EV CHARGING CABLES ABOVE 800V
- TABLE 10 COMPARISON BETWEEN AIR-COOLED AND LIQUID COOLED EV CHARGING CABLES
- TABLE 11 LIQUID COOLED EV CHARGING CABLE MARKET: IMPACT OF MARKET DYNAMICS
- TABLE 12 STRATEGIC MOVES BY KEY PLAYERS IN LIQUID COOLED EV CHARGING CABLE ECOSYSTEM
- TABLE 13 GDP PERCENTAGE CHANGE, BY COUNTRY, 2021-2030
- TABLE 14 ROLE OF PLAYERS IN ECOSYSTEM
- TABLE 15 AVERAGE SELLING PRICE OF LIQUID COOLED EV CHARGING CABLES, BY KEY PLAYER, 2026 (USD THOUSAND)
- TABLE 16 AVERAGE SELLING PRICE TREND, BY REGION, 2023-2025 (USD THOUSAND)
- TABLE 17 INDICATIVE PRICING ANALYSIS, BY CABLE POWER CAPACITY, 2024-2026 (USD THOUSAND)
- TABLE 18 IMPORT DATA FOR HS CODE 8544-COMPLIANT PRODUCTS, BY COUNTRY, 2020-2024 (USD BILLION)
- TABLE 19 EXPORT DATA FOR HS CODE 8544-COMPLIANT PRODUCTS, BY COUNTRY, 2020-2024 (USD BILLION)
- TABLE 20 KEY CONFERENCES & EVENTS, 2026-2027
- TABLE 21 RECIPROCAL TARIFF RATES ADJUSTED BY US
- TABLE 22 PRODUCT-RELATED TARIFF SET BY US FOR LIQUID COOLING EV CHARGING CABLES
- TABLE 23 NUMBER OF PRODUCTS OFFERED BY MANUFACTURERS OF LIQUID COOLED EV CHARGING CABLES
- TABLE 24 PARC GLOBAL EV CHARGING POINTS, 2021-2024 (THOUSAND UNITS)
- TABLE 25 PARC GLOBAL EV CHARGING POINTS, 2025-2032 (THOUSAND UNITS)
- TABLE 26 KEY PATENTS IN LIQUID COOLED EV CHARGING CABLE MARKET, 2021-2025
- TABLE 27 IMPLEMENTATION OF AI: BEST PRACTICES FOLLOWED BY MANUFACTURERS/OEMS
- TABLE 28 USE OF AI-BASED TEMPERATURE PREDICTION MODELS TO ADDRESS RISING THERMAL STRESS IN HIGH-POWER EV CHARGING CABLES
- TABLE 29 USE OF AI-ENABLED INFRASTRUCTURE OPTIMIZATION TO IMPROVE CHARGING EFFICIENCY
- TABLE 30 IMPACT OF ECOSYSTEM PARTICIPANTS ON LIQUID COOLED EV CHARGING MARKET
- TABLE 31 NORTH AMERICA: REGULATORY BODIES, GOVERNMENT AGENCIES, AND OTHER ORGANIZATIONS
- TABLE 32 EUROPE: REGULATORY BODIES, GOVERNMENT AGENCIES, AND OTHER ORGANIZATIONS
- TABLE 33 ASIA PACIFIC: REGULATORY BODIES, GOVERNMENT AGENCIES, AND OTHER ORGANIZATIONS
- TABLE 34 GLOBAL REGULATORY STANDARDS
- TABLE 35 NORTH AMERICA: REGULATORY STANDARDS
- TABLE 36 EUROPE: REGULATORY STANDARDS
- TABLE 37 ASIA PACIFIC: REGULATORY STANDARDS
- TABLE 38 POLICY INITIATIVES IMPACTING LIQUID COOLED EV CHARGING CABLE MARKET
- TABLE 39 INFLUENCE OF STAKEHOLDERS ON BUYING PROCESS, BY CABLE LENGTH
- TABLE 40 KEY BUYING CRITERIA, BY CABLE LENGTH
- TABLE 41 LIQUID COOLED EV CHARGING CABLE MARKET, BY APPLICATION, 2022-2024 (THOUSAND UNITS)
- TABLE 42 LIQUID COOLED EV CHARGING CABLE MARKET, BY APPLICATION, 2025-2032 (THOUSAND UNITS)
- TABLE 43 LIQUID COOLED EV CHARGING CABLE MARKET, BY APPLICATION, 2022-2024 (USD MILLION)
- TABLE 44 LIQUID COOLED EV CHARGING CABLE MARKET, BY APPLICATION, 2025-2032 (USD MILLION)
- TABLE 45 ULTRAFAST CHARGING: LIQUID COOLED EV CHARGING CABLE MARKET, BY REGION, 2022-2024 (THOUSAND UNITS)
- TABLE 46 ULTRAFAST CHARGING: LIQUID COOLED EV CHARGING CABLE MARKET, BY REGION, 2025-2032 (THOUSAND UNITS)
- TABLE 47 ULTRAFAST CHARGING: LIQUID COOLED EV CHARGING CABLE MARKET, BY REGION, 2022-2024 (USD MILLION)
- TABLE 48 ULTRAFAST CHARGING: LIQUID COOLED EV CHARGING CABLE MARKET, BY REGION, 2025-2032 (USD MILLION)
- TABLE 49 MEGAWATT CHARGING: LIQUID COOLED EV CHARGING CABLE MARKET, BY REGION, 2022-2024 (THOUSAND UNITS)
- TABLE 50 MEGAWATT CHARGING: LIQUID COOLED EV CHARGING CABLE MARKET, BY REGION, 2025-2032 (THOUSAND UNITS)
- TABLE 51 MEGAWATT CHARGING: LIQUID COOLED EV CHARGING CABLE MARKET, BY REGION, 2022-2024 (USD MILLION)
- TABLE 52 MEGAWATT CHARGING: LIQUID COOLED EV CHARGING CABLE MARKET, BY REGION, 2025-2032 (USD MILLION)
- TABLE 53 LIQUID COOLED EV CHARGING CABLE MARKET, BY CABLE DIAMETER, 2022-2024 (THOUSAND UNITS)
- TABLE 54 LIQUID COOLED EV CHARGING CABLE MARKET, BY CABLE DIAMETER, 2025-2032 (THOUSAND UNITS)
- TABLE 55 BELOW 30 MM: LIQUID COOLED EV CHARGING CABLE MARKET, BY REGION, 2022-2024 (THOUSAND UNITS)
- TABLE 56 BELOW 30 MM: LIQUID COOLED EV CHARGING CABLE MARKET, BY REGION, 2025-2032 (THOUSAND UNITS)
- TABLE 57 30-50 MM: LIQUID COOLED EV CHARGING CABLE MARKET, BY REGION, 2022-2024 (THOUSAND UNITS)
- TABLE 58 30-50 MM: LIQUID COOLED EV CHARGING CABLE MARKET, BY REGION, 2025-2032 (THOUSAND UNITS)
- TABLE 59 ABOVE 50 MM: LIQUID COOLED EV CHARGING CABLE MARKET, BY REGION, 2025-2032 (THOUSAND UNITS)
- TABLE 60 LIQUID COOLED EV CHARGING CABLE MARKET, BY CABLE LENGTH, 2022-2024 (THOUSAND UNITS)
- TABLE 61 LIQUID COOLED EV CHARGING CABLE MARKET, BY CABLE LENGTH, 2025-2032 (THOUSAND UNITS)
- TABLE 62 BELOW 5 METERS: LIQUID COOLED EV CHARGING CABLE MARKET, BY REGION, 2022-2024 (THOUSAND UNITS)
- TABLE 63 BELOW 5 METERS: LIQUID COOLED EV CHARGING CABLE MARKET, BY REGION, 2025-2032 (THOUSAND UNITS)
- TABLE 64 5-8 METERS: LIQUID COOLED EV CHARGING CABLE MARKET, BY REGION, 2022-2024 (THOUSAND UNITS)
- TABLE 65 5-8 METERS: LIQUID COOLED EV CHARGING CABLE MARKET, BY REGION, 2025-2032 (THOUSAND UNITS)
- TABLE 66 ABOVE 8 METERS: LIQUID COOLED EV CHARGING CABLE MARKET, BY REGION, 2022-2024 (THOUSAND UNITS)
- TABLE 67 ABOVE 8 METERS: LIQUID COOLED EV CHARGING CABLE MARKET, BY REGION, 2025-2032 (THOUSAND UNITS)
- TABLE 68 LIQUID COOLED EV CHARGING CABLE MARKET, BY COOLING TECHNOLOGY, 2022-2024 (THOUSAND UNITS)
- TABLE 69 LIQUID COOLED EV CHARGING CABLE MARKET, BY COOLING TECHNOLOGY, 2025-2032 (THOUSAND UNITS)
- TABLE 70 WATER GLYCOL: LIQUID COOLED EV CHARGING CABLE MARKET, BY REGION, 2022-2024 (THOUSAND UNITS)
- TABLE 71 WATER GLYCOL: LIQUID COOLED EV CHARGING CABLE MARKET, BY REGION, 2025-2032 (THOUSAND UNITS)
- TABLE 72 OTHERS: LIQUID COOLED EV CHARGING CABLE MARKET, BY REGION, 2022-2024 (THOUSAND UNITS)
- TABLE 73 OTHERS: LIQUID COOLED EV CHARGING CABLE MARKET, BY REGION, 2025-2032 (THOUSAND UNITS)
- TABLE 74 LIQUID COOLED EV CHARGING CABLE MARKET, BY JACKET MATERIAL, 2022-2024 (THOUSAND UNITS)
- TABLE 75 LIQUID COOLED EV CHARGING CABLE MARKET, BY JACKET MATERIAL, 2025-2032 (THOUSAND UNITS)
- TABLE 76 RUBBER: LIQUID COOLED EV CHARGING CABLE MARKET, BY REGION, 2022-2024 (THOUSAND UNITS)
- TABLE 77 RUBBER: LIQUID COOLED EV CHARGING CABLE MARKET, BY REGION, 2025-2032 (THOUSAND UNITS)
- TABLE 78 THERMOPLASTIC ELASTOMER: LIQUID COOLED EV CHARGING CABLE MARKET, BY REGION, 2022-2024 (THOUSAND UNITS)
- TABLE 79 THERMOPLASTIC ELASTOMER: LIQUID COOLED EV CHARGING CABLE MARKET, BY REGION, 2025-2032 (THOUSAND UNITS)
- TABLE 80 POLYVINYL CHLORIDE: LIQUID COOLED EV CHARGING CABLE MARKET, BY REGION, 2022-2024 (THOUSAND UNITS)
- TABLE 81 POLYVINYL CHLORIDE: LIQUID COOLED EV CHARGING CABLE MARKET, BY REGION, 2025-2032 (THOUSAND UNITS)
- TABLE 82 LIQUID COOLED EV CHARGING CABLE MARKET, BY CABLE POWER CAPACITY, 2022-2024 (THOUSAND UNITS)
- TABLE 83 LIQUID COOLED EV CHARGING CABLE MARKET, BY CABLE POWER CAPACITY, 2025-2032 (THOUSAND UNITS)
- TABLE 84 LIQUID COOLED EV CHARGING CABLE MARKET, BY CABLE POWER CAPACITY, 2022-2024 (USD MILLION)
- TABLE 85 LIQUID COOLED EV CHARGING CABLE MARKET, BY CABLE POWER CAPACITY, 2025-2032 (USD MILLION)
- TABLE 86 300-499 KW: LIQUID COOLED EV CHARGING CABLE MARKET, BY REGION, 2022-2024 (THOUSAND UNITS)
- TABLE 87 300-499 KW: LIQUID COOLED EV CHARGING CABLE MARKET, BY REGION, 2025-2032 (THOUSAND UNITS)
- TABLE 88 300-499 KW: LIQUID COOLED EV CHARGING CABLE MARKET, BY REGION, 2022-2024 (USD MILLION)
- TABLE 89 300-499 KW: LIQUID COOLED EV CHARGING CABLE MARKET, BY REGION, 2025-2032 (USD MILLION)
- TABLE 90 500-900 KW: LIQUID COOLED EV CHARGING CABLE MARKET, BY REGION, 2022-2024 (THOUSAND UNITS)
- TABLE 91 500-900 KW: LIQUID COOLED EV CHARGING CABLE MARKET, BY REGION, 2025-2032 (THOUSAND UNITS)
- TABLE 92 500-900 KW: LIQUID COOLED EV CHARGING CABLE MARKET, BY REGION, 2022-2024 (USD MILLION)
- TABLE 93 500-900 KW: LIQUID COOLED EV CHARGING CABLE MARKET, BY REGION, 2025-2032 (USD MILLION)
- TABLE 94 > 900 KW: LIQUID COOLED EV CHARGING CABLE MARKET, BY REGION, 2022-2024 (THOUSAND UNITS)
- TABLE 95 > 900 KW: LIQUID COOLED EV CHARGING CABLE MARKET, BY REGION, 2025-2032 (THOUSAND UNITS)
- TABLE 96 > 900 KW: LIQUID COOLED EV CHARGING CABLE MARKET, BY REGION, 2022-2024 (USD MILLION)
- TABLE 97 > 900 KW: LIQUID COOLED EV CHARGING CABLE MARKET, BY REGION, 2025-2032 (USD MILLION)
- TABLE 98 LIQUID COOLED EV CHARGING CABLE MARKET, BY REGION, 2022-2024 (THOUSAND UNITS)
- TABLE 99 LIQUID COOLED EV CHARGING CABLE MARKET, BY REGION, 2025-2032 (THOUSAND UNITS)
- TABLE 100 LIQUID COOLED EV CHARGING CABLE MARKET, BY REGION, 2022-2024 (USD MILLION)
- TABLE 101 LIQUID COOLED EV CHARGING CABLE MARKET, BY REGION, 2025-2032 (USD MILLION)
- TABLE 102 ASIA PACIFIC: LIQUID COOLED EV CHARGING CABLE MARKET, BY COUNTRY, 2022-2024 (THOUSAND UNITS)
- TABLE 103 ASIA PACIFIC: LIQUID COOLED EV CHARGING CABLE MARKET, BY COUNTRY, 2025-2032 (THOUSAND UNITS)
- TABLE 104 ASIA PACIFIC: LIQUID COOLED EV CHARGING CABLE MARKET, BY COUNTRY, 2022-2024 (USD MILLION)
- TABLE 105 ASIA PACIFIC: LIQUID COOLED EV CHARGING CABLE MARKET, BY COUNTRY, 2025-2032 (USD MILLION)
- TABLE 106 CHINA: LIQUID COOLED EV CHARGING CABLE MARKET, BY CABLE POWER CAPACITY, 2022-2024 (THOUSAND UNITS)
- TABLE 107 CHINA: LIQUID COOLED EV CHARGING CABLE MARKET, BY CABLE POWER CAPACITY, 2025-2032 (THOUSAND UNITS)
- TABLE 108 CHINA: LIQUID COOLED EV CHARGING CABLE MARKET, BY CABLE POWER CAPACITY, 2022-2024 (USD MILLION)
- TABLE 109 CHINA: LIQUID COOLED EV CHARGING CABLE MARKET, BY CABLE POWER CAPACITY, 2025-2032 (USD MILLION)
- TABLE 110 INDIA: LIQUID COOLED EV CHARGING CABLE MARKET, BY CABLE POWER CAPACITY, 2025-2032 (THOUSAND UNITS)
- TABLE 111 INDIA: LIQUID COOLED EV CHARGING CABLE MARKET, BY CABLE POWER CAPACITY, 2025-2032 (USD MILLION)
- TABLE 112 JAPAN: LIQUID COOLED EV CHARGING CABLE MARKET, BY CABLE POWER CAPACITY, 2025-2032 (THOUSAND UNITS)
- TABLE 113 JAPAN: LIQUID COOLED EV CHARGING CABLE MARKET, BY CABLE POWER CAPACITY, 2025-2032 (USD MILLION)
- TABLE 114 SOUTH KOREA: LIQUID COOLED EV CHARGING CABLE MARKET, BY CABLE POWER CAPACITY, 2022-2024 (THOUSAND UNITS)
- TABLE 115 SOUTH KOREA: LIQUID COOLED EV CHARGING CABLE MARKET, BY CABLE POWER CAPACITY, 2025-2032 (THOUSAND UNITS)
- TABLE 116 SOUTH KOREA: LIQUID COOLED EV CHARGING CABLE MARKET, BY CABLE POWER CAPACITY, 2022-2024 (USD MILLION)
- TABLE 117 SOUTH KOREA: LIQUID COOLED EV CHARGING CABLE MARKET, BY CABLE POWER CAPACITY, 2025-2032 (USD MILLION)
- TABLE 118 EUROPE: LIQUID COOLED EV CHARGING CABLE MARKET, BY COUNTRY, 2022-2024 (THOUSAND UNITS)
- TABLE 119 EUROPE: LIQUID COOLED EV CHARGING CABLE MARKET, BY COUNTRY, 2025-2032 (THOUSAND UNITS)
- TABLE 120 EUROPE: LIQUID COOLED EV CHARGING CABLE MARKET, BY COUNTRY, 2022-2024 (USD MILLION)
- TABLE 121 EUROPE: LIQUID COOLED EV CHARGING CABLE MARKET, BY COUNTRY, 2025-2032 (USD MILLION)
- TABLE 122 GERMANY: LIQUID COOLED EV CHARGING CABLE MARKET, BY CABLE POWER CAPACITY, 2022-2024 (THOUSAND UNITS)
- TABLE 123 GERMANY: LIQUID COOLED EV CHARGING CABLE MARKET, BY CABLE POWER CAPACITY, 2025-2032 (THOUSAND UNITS)
- TABLE 124 GERMANY: LIQUID COOLED EV CHARGING CABLE MARKET, BY CABLE POWER CAPACITY, 2022-2024 (USD MILLION)
- TABLE 125 GERMANY: LIQUID COOLED EV CHARGING CABLE MARKET, BY CABLE POWER CAPACITY, 2025-2032 (USD MILLION)
- TABLE 126 FRANCE: LIQUID COOLED EV CHARGING CABLE MARKET, BY CABLE POWER CAPACITY, 2022-2024 (THOUSAND UNITS)
- TABLE 127 FRANCE: LIQUID COOLED EV CHARGING CABLE MARKET, BY CABLE POWER CAPACITY, 2025-2032 (THOUSAND UNITS)
- TABLE 128 FRANCE: LIQUID COOLED EV CHARGING CABLE MARKET, BY CABLE POWER CAPACITY, 2022-2024 (USD MILLION)
- TABLE 129 FRANCE: LIQUID COOLED EV CHARGING CABLE MARKET, BY CABLE POWER CAPACITY, 2025-2032 (USD MILLION)
- TABLE 130 ITALY: LIQUID COOLED EV CHARGING CABLE MARKET, BY CABLE POWER CAPACITY, 2022-2024 (THOUSAND UNITS)
- TABLE 131 ITALY: LIQUID COOLED EV CHARGING CABLE MARKET, BY CABLE POWER CAPACITY, 2025-2032 (THOUSAND UNITS)
- TABLE 132 ITALY: LIQUID COOLED EV CHARGING CABLE MARKET, BY CABLE POWER CAPACITY, 2022-2024 (USD MILLION)
- TABLE 133 ITALY: LIQUID COOLED EV CHARGING CABLE MARKET, BY CABLE POWER CAPACITY, 2025-2032 (USD MILLION)
- TABLE 134 SPAIN: LIQUID COOLED EV CHARGING CABLE MARKET, BY CABLE POWER CAPACITY, 2022-2024 (THOUSAND UNITS)
- TABLE 135 SPAIN: LIQUID COOLED EV CHARGING CABLE MARKET, BY CABLE POWER CAPACITY, 2025-2032 (THOUSAND UNITS)
- TABLE 136 SPAIN: LIQUID COOLED EV CHARGING CABLE MARKET, BY CABLE POWER CAPACITY, 2022-2024 (USD MILLION)
- TABLE 137 SPAIN: LIQUID COOLED EV CHARGING CABLE MARKET, BY CABLE POWER CAPACITY, 2025-2032 (USD MILLION)
- TABLE 138 UK: LIQUID COOLED EV CHARGING CABLE MARKET, BY CABLE POWER CAPACITY, 2022-2024 (THOUSAND UNITS)
- TABLE 139 UK: LIQUID COOLED EV CHARGING CABLE MARKET, BY CABLE POWER CAPACITY, 2025-2032 (THOUSAND UNITS)
- TABLE 140 UK: LIQUID COOLED EV CHARGING CABLE MARKET, BY CABLE POWER CAPACITY, 2022-2024 (USD MILLION)
- TABLE 141 UK: LIQUID COOLED EV CHARGING CABLE MARKET, BY CABLE POWER CAPACITY, 2025-2032 (USD MILLION)
- TABLE 142 REST OF EUROPE: LIQUID COOLED EV CHARGING CABLE MARKET, BY CABLE POWER CAPACITY, 2022-2024 (THOUSAND UNITS)
- TABLE 143 REST OF EUROPE: LIQUID COOLED EV CHARGING CABLE MARKET, BY CABLE POWER CAPACITY, 2025-2032 (THOUSAND UNITS)
- TABLE 144 REST OF EUROPE: LIQUID COOLED EV CHARGING CABLE MARKET, BY CABLE POWER CAPACITY, 2022-2024 (USD MILLION)
- TABLE 145 REST OF EUROPE: LIQUID COOLED EV CHARGING CABLE MARKET, BY CABLE POWER CAPACITY, 2025-2032 (USD MILLION)
- TABLE 146 NORTH AMERICA: LIQUID COOLED EV CHARGING CABLE MARKET, BY COUNTRY, 2022-2024 (THOUSAND UNITS)
- TABLE 147 NORTH AMERICA: LIQUID COOLED EV CHARGING CABLE MARKET, BY COUNTRY, 2025-2032 (THOUSAND UNITS)
- TABLE 148 NORTH AMERICA: LIQUID COOLED EV CHARGING CABLE MARKET, BY COUNTRY, 2022-2024 (USD MILLION)
- TABLE 149 NORTH AMERICA: LIQUID COOLED EV CHARGING CABLE MARKET, BY COUNTRY, 2025-2032 (USD MILLION)
- TABLE 150 US: LIQUID COOLED EV CHARGING CABLE MARKET, BY CABLE POWER CAPACITY, 2022-2024 (THOUSAND UNITS)
- TABLE 151 US: LIQUID COOLED EV CHARGING CABLE MARKET, BY CABLE POWER CAPACITY, 2025-2032 (THOUSAND UNITS)
- TABLE 152 US: LIQUID COOLED EV CHARGING CABLE MARKET, BY CABLE POWER CAPACITY, 2022-2024 (USD MILLION)
- TABLE 153 US: LIQUID COOLED EV CHARGING CABLE MARKET, BY CABLE POWER CAPACITY, 2025-2032 (USD MILLION)
- TABLE 154 CANADA: LIQUID COOLED EV CHARGING CABLE MARKET, BY CABLE POWER CAPACITY, 2022-2024 (THOUSAND UNITS)
- TABLE 155 CANADA: LIQUID COOLED EV CHARGING CABLE MARKET, BY CABLE POWER CAPACITY, 2025-2032 (THOUSAND UNITS)
- TABLE 156 CANADA: LIQUID COOLED EV CHARGING CABLE MARKET, BY CABLE POWER CAPACITY, 2022-2024 (USD MILLION)
- TABLE 157 CANADA: LIQUID COOLED EV CHARGING CABLE MARKET, BY CABLE POWER CAPACITY, 2025-2032 (USD MILLION)
- TABLE 158 KEY PLAYER STRATEGIES/RIGHT TO WIN, JANUARY 2021-DECEMBER 2025
- TABLE 159 LIQUID COOLED EV CHARGING CABLE MARKET: REGION FOOTPRINT
- TABLE 160 LIQUID COOLED EV CHARGING CABLE MARKET: CABLE POWER CAPACITY FOOTPRINT
- TABLE 161 LIQUID COOLED EV CHARGING CABLE MARKET: COOLING FLUID FOOTPRINT
- TABLE 162 EV CHARGING STATION MARKET: LIST OF STARTUPS/SMES
- TABLE 163 COMPETITIVE BENCHMARKING OF KEY STARTUPS/SMES
- TABLE 164 LIQUID COOLED EV CHARGING CABLE MARKET: PRODUCT LAUNCHES/DEVELOPMENTS, JANUARY 2021-DECEMBER 2025
- TABLE 165 LIQUID COOLED EV CHARGING CABLE MARKET: DEALS, JANUARY 2021-DECEMBER 2025
- TABLE 166 LIQUID COOLED EV CHARGING CABLE MARKET: EXPANSION, JANUARY 2021-DECEMBER 2025
- TABLE 167 LIQUID COOLED EV CHARGING CABLE MARKET: OTHER DEVELOPMENTS, JANUARY 2021-DECEMBER 2025
- TABLE 168 PHOENIX CONTACT: COMPANY OVERVIEW
- TABLE 169 PHOENIX CONTACT: PRODUCTS OFFERED
- TABLE 170 PHOENIX CONTACT: PRODUCT LAUNCHES/DEVELOPMENTS
- TABLE 171 PHOENIX CONTACT: DEALS
- TABLE 172 PHOENIX CONTACT: OTHER DEVELOPMENTS
- TABLE 173 BRUGG ECONNECT: COMPANY OVERVIEW
- TABLE 174 BRUGG ECONNECT: MAJOR PRODUCTS OFFERED ACROSS CATEGORIES
- TABLE 175 BRUGG ECONNECT: PRODUCTS OFFERED
- TABLE 176 SINBON ELECTRONICS CO., LTD.: COMPANY OVERVIEW
- TABLE 177 SINBON ELECTRONICS CO., LTD.: PRODUCTS OFFERED
- TABLE 178 SINBON ELECTRONICS CO., LTD.: EXPANSION
- TABLE 179 SINBON ELECTRONICS CO., LTD.: OTHER DEVELOPMENTS
- TABLE 180 HUBER+SUHNER: COMPANY OVERVIEW
- TABLE 181 HUBER+SUHNER: PRODUCTS OFFERED
- TABLE 182 HUBER+SUHNER: PRODUCT LAUNCHES/DEVELOPMENTS
- TABLE 183 LEONI AG: COMPANY OVERVIEW
- TABLE 184 LEONI AG: PRODUCTS OFFERED
- TABLE 185 LEONI AG: PRODUCT LAUNCHES/DEVELOPMENTS
- TABLE 186 LEONI AG: DEALS
- TABLE 187 LEONI AG: OTHER DEVELOPMENTS
- TABLE 188 OMG EV CABLE: COMPANY OVERVIEW
- TABLE 189 OMG EV CABLE: PRODUCTS OFFERED
- TABLE 190 KEMPOWER: COMPANY OVERVIEW
- TABLE 191 KEMPOWER: PRODUCTS OFFERED
- TABLE 192 KEMPOWER: PRODUCT LAUNCHES/DEVELOPMENTS
- TABLE 193 FIVER NEW ENERGY TECHNOLOGY CO., LTD: COMPANY OVERVIEW
- TABLE 194 FIVER NEW ENERGY TECHNOLOGY CO., LTD: PRODUCTS OFFERED
- TABLE 195 SHANGHAI MIDA EV POWER CO., LTD.: COMPANY OVERVIEW
- TABLE 196 SHANGHAI MIDA EV POWER CO., LTD.: PRODUCTS OFFERED
- TABLE 197 COROFLEX: COMPANY OVERVIEW
- TABLE 198 COROFLEX: PRODUCTS OFFERED
- TABLE 199 COROFLEX: PRODUCT LAUNCHES/DEVELOPMENTS
- TABLE 200 COROFLEX: EXPANSION
- TABLE 201 COROFLEX: OTHER DEVELOPMENTS
- TABLE 202 TE CONNECTIVITY: COMPANY OVERVIEW
- TABLE 203 TE CONNECTIVITY: PRODUCTS OFFERED
- TABLE 204 TE CONNECTIVITY: PRODUCT LAUNCHES/DEVELOPMENTS
- TABLE 205 ZHEJIANG YONGGUI ELECTRIC EQUIPMENT CO., LTD.: COMPANY OVERVIEW
- TABLE 206 ZHEJIANG YONGGUI ELECTRIC EQUIPMENT CO., LTD.: PRODUCTS OFFERED
- TABLE 207 ZHEJIANG YONGGUI ELECTRIC EQUIPMENT CO., LTD.: PRODUCT LAUNCHES/DEVELOPMENTS
- TABLE 208 ZHEJIANG YONGGUI ELECTRIC EQUIPMENT CO., LTD.: DEALS
- TABLE 209 ZHEJIANG YONGGUI ELECTRIC EQUIPMENT CO., LTD.: EXPANSION
- TABLE 210 CALEDONIAN CABLES LTD.: COMPANY OVERVIEW
- TABLE 211 SAICHUAN ELECTRONIC CO., LTD.: COMPANY OVERVIEW
- TABLE 212 SUZHOU YIHANG ELECTRONIC SCIENCE & TECHNOLOGY CO., LTD.: COMPANY OVERVIEW
- TABLE 213 QINGDAO PENODA ELECTRICAL CO., LTD.: COMPANY OVERVIEW
- TABLE 214 TOTCABLES: COMPANY OVERVIEW
- TABLE 215 CPC: COMPANY OVERVIEW
- TABLE 216 ITT INC.: COMPANY OVERVIEW
- TABLE 217 TEISON ENERGY TECHNOLOGY CO., LTD.: COMPANY OVERVIEW
- TABLE 218 LS CABLE & SYSTEM LTD.: COMPANY OVERVIEW
- TABLE 219 SOUTHWIRE COMPANY, LLC: COMPANY OVERVIEW
- TABLE 220 VOSS: COMPANY OVERVIEW
- TABLE 221 SUMITOMO ELECTRIC INDUSTRIES, LTD.: COMPANY OVERVIEW
- TABLE 222 JOHNSON ELECTRIC HOLDINGS LIMITED: COMPANY OVERVIEW
List of Figures
- FIGURE 1 MARKET SCENARIO
- FIGURE 2 LIQUID COOLED EV CHARGING CABLE MARKET, 2022-2032 (USD MILLION)
- FIGURE 3 MAJOR STRATEGIES ADOPTED BY KEY PLAYERS IN LIQUID COOLED EV CHARGING CABLE MARKET, 2020-2025
- FIGURE 4 DISRUPTIONS INFLUENCING GROWTH OF LIQUID COOLED EV CHARGING CABLE MARKET
- FIGURE 5 MEGAWATT CHARGING TO ACHIEVE HIGHER CAGR THAN ULTRAFAST CHARGING APPLICATION SEGMENT DURING FORECAST PERIOD
- FIGURE 6 ASIA PACIFIC TO REGISTER HIGHEST GROWTH DURING FORECAST PERIOD
- FIGURE 7 RISING DEPLOYMENT OF ULTRAFAST DC CHARGING SYSTEMS TO DRIVE DEMAND FOR LIQUID COOLED EV CHARGING CABLES
- FIGURE 8 500-900 KW SEGMENT TO LEAD MARKET DURING FORECAST PERIOD
- FIGURE 9 ULTRAFAST CHARGING SEGMENT TO LEAD MARKET BY 2032
- FIGURE 10 5-8 METERS SEGMENT TO ACCOUNT FOR LARGEST SHARE BY 2032
- FIGURE 11 30-50 MM SEGMENT TO LEAD MARKET DURING FORECAST PERIOD
- FIGURE 12 THERMOPLASTIC ELASTOMER SEGMENT TO ACCOUNT FOR LARGEST SHARE BY 2032
- FIGURE 13 WATER GLYCOL SEGMENT TO ACCOUNT FOR LARGEST SHARE DURING FORECAST PERIOD
- FIGURE 14 ASIA PACIFIC TO ACCOUNT FOR LARGEST SHARE IN 2025
- FIGURE 15 LIQUID COOLED EV CHARGING CABLE MARKET: DRIVERS, RESTRAINTS, OPPORTUNITIES, AND CHALLENGES
- FIGURE 16 CABLE WITH IMMERSION COOLING FOR ULTRAFAST CHARGING
- FIGURE 17 PORTER'S FIVE FORCES ANALYSIS
- FIGURE 18 SUPPLY CHAIN ANALYSIS
- FIGURE 19 ECOSYSTEM ANALYSIS
- FIGURE 20 AVERAGE SELLING PRICE TREND, BY REGION, 2024-2026 (USD THOUSAND)
- FIGURE 21 INDICATIVE PRICING ANALYSIS, BY CABLE POWER CAPACITY, 2024-2026 (USD THOUSAND)
- FIGURE 22 IMPORT DATA FOR HS CODE 8544-COMPLIANT PRODUCTS, BY COUNTRY, 2021-2024 (USD BILLION)
- FIGURE 23 EXPORT DATA FOR HS CODE 8544-COMPLIANT PRODUCTS, BY COUNTRY, 2020-2024 (USD BILLION)
- FIGURE 24 TRENDS & DISRUPTIONS IMPACTING CUSTOMER BUSINESS
- FIGURE 25 INVESTMENT & FUNDING SCENARIO, 2022-2025 (USD BILLION)
- FIGURE 26 IMPACT OF FLUORINATED DIELECTRIC-BASED LIQUID COOLED EV CHARGING CABLES
- FIGURE 27 MICRO-CHANNEL AND DIRECT LIQUID COOLING IMPACT ON HPC CABLES
- FIGURE 28 INTEGRATED COOLING LOOP DESIGN FOR HIGH-POWER EV CHARGER AND LIQUID COOLED CABLE
- FIGURE 29 BATTERY-BUFFERED DC FAST CHARGING
- FIGURE 30 TEMPERATURE SENSORS
- FIGURE 31 LIQUID COOLED EV CHARGING CABLE TECHNOLOGY AND PRODUCT ROADMAP
- FIGURE 32 PATENT ANALYSIS
- FIGURE 33 INTERCONNECTED ECOSYSTEM OF LIQUID COOLED EV CHARGING CABLES AND MARKET IMPACT
- FIGURE 34 INFLUENCE OF STAKEHOLDERS ON BUYING PROCESS, BY CABLE LENGTH
- FIGURE 35 KEY BUYING CRITERIA, BY CABLE LENGTH
- FIGURE 36 ULTRAFAST CHARGING SEGMENT TO DOMINATE MARKET DURING FORECAST PERIOD
- FIGURE 37 30-50 MM SEGMENT TO LEAD MARKET DURING FORECAST PERIOD
- FIGURE 38 5-8 METERS SEGMENT TO DOMINATE MARKET DURING FORECAST PERIOD
- FIGURE 39 WATER GLYCOL SEGMENT TO LEAD MARKET DURING FORECAST PERIOD
- FIGURE 40 THERMOPLASTIC ELASTOMER SEGMENT TO LEAD MARKET DURING FORECAST PERIOD
- FIGURE 41 500-900 KW SEGMENT TO LEAD MARKET DURING FORECAST PERIOD
- FIGURE 42 LIQUID COOLED EV CHARGING CABLE MARKET, BY REGION, 2025 VS. 2032 (USD MILLION)
- FIGURE 43 ASIA PACIFIC: LIQUID COOLED EV CHARGING CABLE MARKET SNAPSHOT
- FIGURE 44 EUROPE: LIQUID COOLED EV CHARGING CABLE MARKET SNAPSHOT
- FIGURE 45 NORTH AMERICA: LIQUID COOLED EV CHARGING CABLE MARKET SNAPSHOT
- FIGURE 46 MARKET SHARE ANALYSIS OF TOP FIVE PLAYERS, 2026
- FIGURE 47 MARKET RANKING ANALYSIS OF TOP FIVE PLAYERS, 2026
- FIGURE 48 REVENUE ANALYSIS OF KEY PLAYERS, 2021-2025 (USD BILLION)
- FIGURE 49 COMPANY VALUATION OF KEY PLAYERS, 2025 (USD BILLION)
- FIGURE 50 FINANCIAL METRICS OF KEY PLAYERS, 2025
- FIGURE 51 BRAND/PRODUCT COMPARISON
- FIGURE 52 LIQUID COOLED EV CHARGING CABLE MARKET: COMPANY EVALUATION MATRIX (KEY PLAYERS), 2026
- FIGURE 53 LIQUID COOLED EV CHARGING CABLE MARKET: COMPANY FOOTPRINT
- FIGURE 54 LIQUID COOLED EV CHARGING CABLE MARKET: COMPANY EVALUATION MATRIX (STARTUPS/SMES), 2026
- FIGURE 55 BRUGG GROUP: SUBSIDIARIES
- FIGURE 56 BRUGG ECONNECT: COMPANY SNAPSHOT
- FIGURE 57 HUBER+SUHNER: COMPANY SNAPSHOT
- FIGURE 58 KEMPOWER: COMPANY SNAPSHOT
- FIGURE 59 TE CONNECTIVITY: COMPANY SNAPSHOT
- FIGURE 60 LIQUID COOLED EV CHARGING CABLE MARKET: RESEARCH DESIGN
- FIGURE 61 RESEARCH DESIGN MODEL
- FIGURE 62 KEY INDUSTRY INSIGHTS
- FIGURE 63 BREAKDOWN OF PRIMARY INTERVIEWS
- FIGURE 64 RESEARCH METHODOLOGY: HYPOTHESIS BUILDING
- FIGURE 65 BOTTOM-UP APPROACH
- FIGURE 66 TOP-DOWN APPROACH
- FIGURE 67 DATA TRIANGULATION
- FIGURE 68 MARKET GROWTH PROJECTIONS FROM SUPPLY-SIDE DRIVERS
 电动车充电线市场:按材料、相数、充电模式、车辆类型、连接器类型、额定电流和最终用户划分-2026-2032年全球市场预测
 电动车充电线市场机会、成长要素、产业趋势分析及2026-2035年预测
 全球电动车充电线市场规模、份额、趋势及成长分析报告(2026-2034年)
 2026年全球USB-C充电线市场报告
 电动车充电线市场 - 全球产业规模、份额、趋势、机会、预测:按应用、长度、充电等级、电源、地区和竞争格局划分,2021-2031年
 电动车充电线市场规模、份额及成长分析(按线缆类型、充电线、连接器类型、直径、材质、长度及地区划分)-产业预测(2026-2033年)液冷式电动车充电线缆市场机会、成长驱动因素、产业趋势分析及预测(2025-2034年)
 全球电动汽车电缆市场全球电动车充电电缆市场
 2025-2033 年日本电动车充电电缆市场报告(按电缆长度、形状、充电水平、功率类型、应用和地区)