


 |
市场调查报告书
商品编码
1998713
轮胎翻新市场机会、成长要素、产业趋势分析及2026-2035年预测Tire Retreading Market Opportunity, Growth Drivers, Industry Trend Analysis, and Forecast 2026 - 2035 |
||||||
全球轮胎翻新市场预计到 2025 年价值 103 亿美元,预计到 2035 年将以 6% 的复合年增长率增长至 184 亿美元。
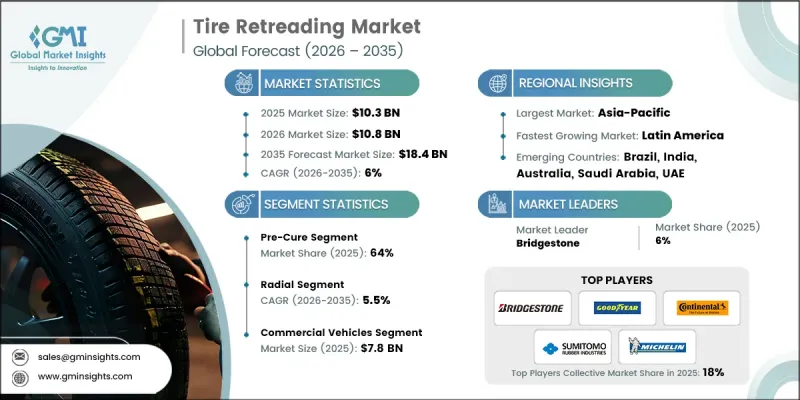
随着製造商和车队营运商逐渐意识到翻新轮胎的成本节约和环保优势,并加大对现代化翻新工厂的投资,市场正经历强劲成长。自动化正在革新生产方式,透过引入先进的检测、抛光和胎面贴合设备,提高营运效率和一致性,从而提升精度和生产效率。在亚太地区,中国和印度等国家物流基础设施的快速发展以及大规模商用车队的扩张,推动了该地区最大的市场份额。 RFID追踪、预测性维护和自动化检测线等技术创新,正将轮胎翻新从单纯的成本节约措施转变为支援车队优化的数据驱动型服务。在欧洲,对用于采矿和基础设施计划的非公路轮胎的投资,以及欧盟循环经济行动计画下促进轮胎再利用的法规,进一步提升了市场渗透率。
| 市场范围 | |
|---|---|
| 开始年份 | 2025 |
| 预测期 | 2026-2035 |
| 上市时的市场规模 | 103亿美元 |
| 预计金额 | 184亿美元 |
| 复合年增长率 | 6% |
到2025年,预硫化轮胎的市占率将达到64%,预计到2035年将以5.7%的复合年增长率成长。预硫化翻新是将预硫化胎麵条贴合到抛光轮胎胎体上的工艺,可缩短生产週期、降低资本投入,并实现可预测的翻新效果。这种经济高效且灵活的方法深受追求效率和扩充性的独立翻新商和大规模车队营运商的青睐。由于其诸多营运优势,预硫化翻新仍将是应用最广泛的翻新技术。
预计到2025年,子午线轮胎市占率将达到59%,并在2026年至2035年间以5.5%的复合年增长率成长。子午线轮胎翻新之所以占据主导地位,是因为其结构优势,例如钢丝带束层结构和柔性胎侧,这些优势提高了轮胎的耐久性、燃油效率和散热性能。这些特性使得子午线轮胎可以多次翻新,从而降低车队的整体营运成本,使其成为商用车、巴士和货运车辆的理想选择。
预计2025年,中国轮胎翻新市场规模将达21亿美元。受翻新轮胎成本效益和永续性的推动,中国成熟的翻新轮胎产业持续扩张。从生产到回收的整个翻新轮胎生命週期都得到了广泛应用。在山东和青岛等地区,预硫化和热成型工艺均已广泛应用,实现了高效生产,并满足了商用车车队日益增长的需求。
目录
第一章:调查方法和范围
第二章执行摘要
第三章业界考察
- 生态系分析
- 供应商情况
- 成本结构
- 利润率
- 每个阶段增加的价值
- 垂直整合趋势
- 颠覆者
- 影响因素
- 促进因素
- 翻新轮胎可以减少对天然橡胶的需求,延长轮胎寿命,并支持循环经济。
- 商业企业采用翻新轮胎来降低轮胎总支出。
- 透过预固化、模内固化和自动化检测来改进翻新技术。
- 在新兴市场,物流成本上升正在加速这一趋势的普及。
- 产业潜在风险与挑战
- 乘用车用户仍不愿使用翻新轮胎。
- 翻新设备及装置的初始投资成本较高。
- 市场机会
- 公共汽车、飞机和越野车翻新轮胎市场的成长
- 互联车队和预测性维护的日益普及推动了对翻新轮胎的需求。
- 促进因素
- 技术趋势与创新生态系统
- 目前技术
- 新兴技术
- 成长潜力分析
- 监理情势
- 北美洲
- 美国联邦机动车辆安全标准(FMVSS 109 - 汽车新型充气轮胎)
- 加拿大机动车辆安全法规(CMVSR - 轮胎标准 SOR/2007-102)
- 欧洲
- 联合国欧洲经济委员会第108号条例(商用车辆用再生轮胎)
- 欧盟轮胎标籤法规((EC) No. 1222/2009 号法规)
- 亚太地区
- AIS-142(印度汽车行业标准 - 再生轮胎)
- 中国 GB/T 1791-2018(再生轮胎标准)
- 拉丁美洲
- ABNT NBR 13671(巴西 - 再生轮胎标准)
- NOM-116-SCFI-2016(墨西哥 - 轮胎翻新标准)
- 中东和非洲
- SASO 2888/2018(沙乌地阿拉伯 - 再生轮胎)
- SANS 1737(南非 - 翻新轮胎规范)
- 北美洲
- 波特五力分析
- PESTEL 分析
- 价格分析(基于初步调查)
- 对过去价格趋势的分析
- 按业务类型分類的定价策略(溢价/价值/成本加成)
- 专利分析(基于初步研究)
- 用例
- 适用于长途卡车运输和物流车辆
- 矿业和越野设备的轮胎管理
- 飞机轮胎翻新计划
- 市政和废弃物管理车辆的运营
- 延长农业机械轮胎的使用寿命
- 永续性和环境方面
- 永续倡议
- 减少废弃物策略
- 生产中的能源效率
- 具有环保意识的倡议
- 关于碳足迹的考量
- 人工智慧(AI)的影响
- 利用人工智慧改造现有经营模式
- GenAI 各细分市场的应用案例与部署蓝图
- 风险、局限性和监管考量
- 独立翻新轮胎公司取得技术的障碍
- 生产能力和生产趋势(基于初步调查)
- 按地区和主要製造商分類的产能
- 运转率和扩张计划
- 预测假设和情境分析(基于初步研究)
- 基本案例-驱动复合年增长率的关键宏观经济与产业变量
- 乐观情境-宏观经济与产业的顺风
- 悲观情景-宏观经济放缓或产业逆风
第四章 竞争情势
- 介绍
- 企业市占率分析
- 北美洲
- 欧洲
- 亚太地区
- 拉丁美洲
- 中东和非洲
- 主要市场公司的竞争分析
- 竞争定位矩阵
- 主要进展
- 併购
- 伙伴关係与合作
- 新产品发布
- 业务拓展计划及资金筹措
第五章 市场估价与预测:依製程划分,2022-2035年
- 预固化
- 模内固化
第六章 市场估价与预测:依轮胎类型划分,2022-2035年
- 子午线轮胎
- 偏见
- 坚硬的
第七章 市场估价与预测:依车辆类型划分,2022-2035年
- 搭乘用车
- 轿车
- 掀背车
- SUV
- 商用车辆
- 轻型商用车
- 中型商用车
- 大型商用车辆
- 工业车辆
- 建筑和采矿
- 农业
- 军事/国防
- 其他的
第八章 市场估计与预测:依应用领域划分,2022-2035年
- 道路
- 越野
第九章 市场估计与预测:依最终用途划分,2022-2035年
- OEM服务供应商
- 独立翻新轮胎公司
第十章 市场估价与预测:依地区划分,2022-2035年
- 北美洲
- 我们
- 加拿大
- 欧洲
- 英国
- 德国
- 法国
- 义大利
- 西班牙
- 比利时
- 荷兰
- 瑞典
- 俄罗斯
- 亚太地区
- 中国
- 印度
- 日本
- 澳洲
- 新加坡
- 韩国
- 越南
- 印尼
- 拉丁美洲
- 巴西
- 墨西哥
- 阿根廷
- 中东和非洲(MEA)
- 南非
- 沙乌地阿拉伯
- 阿拉伯聯合大公国
第十一章:公司简介
- 世界公司
- Bridgestone
- Continental
- Marangoni
- Michelin
- MRF
- Pirelli &C
- Sumitomo Rubber Industries
- The Goodyear Tire &Rubber
- Yokohama Rubber Company
- 当地公司
- Best-One Tire
- Kal Tire
- Oliver Rubber Company
- Parrish Tire Company
- Southern Tire Mart
- Vipal Rubber
- 新兴企业
- AcuTread
- Hankook Tire
- Qingdao Doublestar
- Redburn Tire Company
- TreadWright
The Global Tire Retreading Market was valued at USD 10.3 billion in 2025 and is estimated to grow at a CAGR of 6% to reach USD 18.4 billion by 2035.
The market is witnessing strong growth as manufacturers and fleet operators increasingly invest in modern retreading plants, recognizing both the financial savings and environmental benefits of retreaded tires. Automation is revolutionizing production by streamlining operations and improving consistency, with advanced machinery for inspection, buffing, and tread application, enhancing precision and throughput. In the Asia-Pacific region, rapid growth in logistics infrastructure and large commercial fleets in countries such as China and India is driving the highest market share. Technological innovations like RFID tracking, predictive maintenance, and automated inspection lines are transforming tire retreading from a cost-saving measure into a data-driven service that supports fleet optimization. In Europe, investment in off-road tire applications for mining and infrastructure projects, coupled with regulations promoting tire reuse under the EU Circular Economy Action Plan, is further boosting market adoption.
| Market Scope | |
|---|---|
| Start Year | 2025 |
| Forecast Year | 2026-2035 |
| Start Value | $10.3 Billion |
| Forecast Value | $18.4 Billion |
| CAGR | 6% |
The pre-cure segment held a 64% share in 2025 and is expected to grow at a CAGR of 5.7% through 2035. Pre-cure retreading involves applying pre-vulcanized tread strips to buffed tire casings, enabling shorter cycle times, lower capital investments, and predictable outcomes. This cost-effective and flexible method appeals to independent retreaders and large fleet operators seeking efficiency and scalability. It is anticipated to remain the most widely deployed retreading technique due to its operational advantages.
The radial tires segment accounted for 59% share in 2025 and is projected to grow at a CAGR of 5.5% between 2026 and 2035. Radial retreads dominate due to their structural benefits, including steel-belted construction and flexible sidewalls, which enhance durability, fuel efficiency, and heat dissipation. These properties allow radial tires to be retreaded multiple times, reducing overall fleet operating costs and making them highly attractive for commercial vehicles, buses, and freight transport.
China Tire Retreading Market reached USD 2.1 billion in 2025. The country's well-established retreading industry continues to expand, driven by the cost-effectiveness and sustainability of retreaded tires. The full retreading lifecycle, from production to recycling, is widely implemented. Both pre-cure and hot mold techniques are extensively utilized in provinces such as Shandong and Qingdao, enabling efficient production and meeting the growing demand from commercial fleets.
Key players operating in the Global Tire Retreading Market include Michelin, Sumitomo Rubber Industries, Southern Tire Mart, Pirelli & C, Yokohama Rubber Company, Bridgestone, Continental, Marangoni, The Goodyear Tire & Rubber, and MRF. Companies in the Tire Retreading Market are adopting strategies to strengthen their presence by investing in advanced automation technologies, including robotic inspection, buffing, and tread application systems, to increase production efficiency and product quality. Strategic partnerships with fleet operators and logistics companies allow manufacturers to expand service networks and enhance recurring demand for retreaded tires. Firms are also focusing on sustainability initiatives, promoting environmentally responsible practices, and leveraging regulatory incentives to boost adoption. Additionally, continuous R&D to improve tire longevity, fuel efficiency, and performance, combined with predictive maintenance solutions and digital monitoring platforms, helps companies maintain competitiveness and expand market share.
Table of Contents
Chapter 1 Methodology & Scope
- 1.1 Research approach
- 1.2 Quality Commitments
- 1.2.1 GMI AI policy & data integrity commitment
- 1.2.1.1 Source consistency protocol
- 1.2.1 GMI AI policy & data integrity commitment
- 1.3 Research Trail & Confidence Scoring
- 1.3.1 Research Trail Components
- 1.3.2 Scoring Components
- 1.4 Data Collection
- 1.4.1 Partial list of primary sources
- 1.5 Data mining sources
- 1.5.1 Paid sources
- 1.5.1.1 Sources, by region
- 1.5.1 Paid sources
- 1.6 Base estimates and calculations
- 1.6.1 Base year calculation for any one approach
- 1.7 Forecast
- 1.7.1 Quantified market impact analysis
- 1.7.1.1 Mathematical impact of growth parameters on forecast
- 1.7.1 Quantified market impact analysis
- 1.8 Research transparency addendum
- 1.8.1 Source attribution framework
- 1.8.2 Quality assurance metrics
- 1.8.3 Our commitment to trust
Chapter 2 Executive Summary
- 2.1 Industry 360° synopsis
- 2.2 Key market trends
- 2.2.1 Regional
- 2.2.2 Process
- 2.2.3 Tire
- 2.2.4 Vehicle
- 2.2.5 Application
- 2.2.6 End Use
- 2.3 TAM Analysis, 2026-2035
- 2.4 CXO perspectives: Strategic imperatives
Chapter 3 Industry Insights
- 3.1 Industry ecosystem analysis
- 3.1.1 Supplier landscape
- 3.1.2 Cost structure
- 3.1.3 Profit margin
- 3.1.4 Value addition at each stage
- 3.1.5 Vertical integration trends
- 3.1.6 Disruptors
- 3.2 Impact on forces
- 3.2.1 Growth drivers
- 3.2.1.1 Retreading reduces raw rubber demand, extends tire life, and supports circular economy
- 3.2.1.2 Commercial operators adopted retreaded tires to lower total tire expenditure
- 3.2.1.3 Pre-cure and mold-cure retreading improvements and automated inspection.
- 3.2.1.4 Emerging markets see accelerated adoption due to rising logistics.
- 3.2.2 Industry pitfalls & challenges
- 3.2.2.1 Passenger vehicle users remain hesitant to adopt retreads
- 3.2.2.2 High setup costs for retreading plants and equipment
- 3.2.3 Market opportunities
- 3.2.3.1 Growth in bus, aviation, and off-road vehicle retreading
- 3.2.3.2 Connected fleets and predictive maintenance adoption increase retread
- 3.2.1 Growth drivers
- 3.3 Technology trends & innovation ecosystem
- 3.3.1 Current technologies
- 3.3.2 Emerging technologies
- 3.4 Growth potential analysis
- 3.5 Regulatory landscape
- 3.5.1 North America
- 3.5.1.1 U.S. Federal Motor Vehicle Safety Standards (FMVSS 109 - New Pneumatic Tires for Motor Vehicles)
- 3.5.1.2 Canadian Motor Vehicle Safety Regulations (CMVSR - Tires Standard SOR/2007-102)
- 3.5.2 Europe
- 3.5.2.1 UNECE Regulation No. 108 (Retreaded Tires for Commercial Vehicles)
- 3.5.2.2 EU Tyre Labelling Regulation (Regulation (EC) No 1222/2009)
- 3.5.3 Asia-Pacific
- 3.5.3.1 AIS-142 (Automotive Industry Standard - Retreaded Tires, India)
- 3.5.3.2 China GB/T 1791-2018 (Retreaded Tires Specification)
- 3.5.4 Latin America
- 3.5.4.1 ABNT NBR 13671 (Brazil - Retreaded Tire Standards)
- 3.5.4.2 NOM-116-SCFI-2016 (Mexico - Tire Retreading Standard)
- 3.5.5 Middle East & Africa
- 3.5.5.1 SASO 2888/2018 (Saudi Arabia - Retreaded Tires)
- 3.5.5.2 SANS 1737 (South Africa - Retreaded Tire Specification)
- 3.5.1 North America
- 3.6 Porter's analysis
- 3.7 PESTEL analysis
- 3.8 Price analysis (Driven by Primary Research)
- 3.8.1 Historical Price Trend Analysis
- 3.8.2 Pricing Strategy by Player Type (Premium / Value / Cost-plus)
- 3.9 Patent analysis (Driven by Primary Research)
- 3.10 Use cases
- 3.10.1 Long-haul trucking & logistics fleet applications
- 3.10.2 Mining & off-road equipment tire management
- 3.10.3 Aviation tire retreading programs
- 3.10.4 Municipal & waste management fleet operations
- 3.10.5 Agricultural equipment tire lifecycle extension
- 3.11 Sustainability and environmental aspects
- 3.11.1 Sustainable practices
- 3.11.2 Waste reduction strategies
- 3.11.3 Energy efficiency in production
- 3.11.4 Eco-friendly initiatives
- 3.11.5 Carbon footprint considerations
- 3.12 Impact of Artificial Intelligence (AI)
- 3.12.1 AI-Driven Disruption of Existing Business Models
- 3.12.2 GenAI Use Cases & Adoption Roadmap by Segment
- 3.12.3 Risks, Limitations & Regulatory Considerations
- 3.12.4 Technology Access Barriers for Independent Retreaders
- 3.13 Capacity & production landscape (Driven by Primary Research)
- 3.13.1 Installed capacity by region & key producer
- 3.13.2 Capacity utilization rates & expansion pipelines
- 3.14 Forecast assumptions & scenario analysis (Driven by Primary Research)
- 3.14.1 Base Case - key macro & industry variables driving CAGR
- 3.14.2 Optimistic Scenarios - Favorable macro and industry tailwinds
- 3.14.3 Pessimistic Scenario - Macroeconomic slowdown or industry headwinds
Chapter 4 Competitive Landscape, 2025
- 4.1 Introduction
- 4.2 Company market share analysis
- 4.2.1 North America
- 4.2.2 Europe
- 4.2.3 Asia-Pacific
- 4.2.4 Latin America
- 4.2.5 Middle East & Africa
- 4.3 Competitive analysis of major market players
- 4.4 Competitive positioning matrix
- 4.5 Key developments
- 4.5.1 Mergers & acquisitions
- 4.5.2 Partnerships & collaborations
- 4.5.3 New product launches
- 4.5.4 Expansion plans and funding
Chapter 5 Market Estimates & Forecast, By Process, 2022 - 2035 ($ Bn, Units)
- 5.1 Key trends
- 5.2 Pre-Cure
- 5.3 Mold-Cure
Chapter 6 Market Estimates & Forecast, By Tire, 2022 - 2035 ($ Bn, Units)
- 6.1 Key trends
- 6.2 Radial
- 6.3 Bias
- 6.4 Solid
Chapter 7 Market Estimates & Forecast, By Vehicle, 2022 - 2035 ($ Bn, Units)
- 7.1 Key trends
- 7.2 Passenger Vehicle
- 7.2.1 Sedan
- 7.2.2 Hatchback
- 7.2.3 SUV
- 7.3 Commercial Vehicle
- 7.3.1 Light Commercial Vehicle
- 7.3.2 Medium Commercial Vehicle
- 7.3.3 Heavy Commercial Vehicle
- 7.4 Industrial Vehicles
- 7.4.1 Construction & Mining
- 7.4.2 Agriculture
- 7.4.3 Military & Defense
- 7.4.4 Others
Chapter 8 Market Estimates & Forecast, By Application, 2022 - 2035 ($ Bn, Units)
- 8.1 Key trends
- 8.2 On-Road
- 8.3 Off-Road
Chapter 9 Market Estimates & Forecast, By End Use, 2022 - 2035 ($ Bn, Units)
- 9.1 Key trends
- 9.2 OEM service providers
- 9.3 Independent retreaders
Chapter 10 Market Estimates & Forecast, By Region, 2022 - 2035 ($ Bn, Units)
- 10.1 North America
- 10.1.1 US
- 10.1.2 Canada
- 10.2 Europe
- 10.2.1 UK
- 10.2.2 Germany
- 10.2.3 France
- 10.2.4 Italy
- 10.2.5 Spain
- 10.2.6 Belgium
- 10.2.7 Netherlands
- 10.2.8 Sweden
- 10.2.9 Russia
- 10.3 Asia Pacific
- 10.3.1 China
- 10.3.2 India
- 10.3.3 Japan
- 10.3.4 Australia
- 10.3.5 Singapore
- 10.3.6 South Korea
- 10.3.7 Vietnam
- 10.3.8 Indonesia
- 10.4 Latin America
- 10.4.1 Brazil
- 10.4.2 Mexico
- 10.4.3 Argentina
- 10.5 MEA
- 10.5.1 South Africa
- 10.5.2 Saudi Arabia
- 10.5.3 UAE
Chapter 11 Company Profiles
- 11.1 Global players
- 11.1.1 Bridgestone
- 11.1.2 Continental
- 11.1.3 Marangoni
- 11.1.4 Michelin
- 11.1.5 MRF
- 11.1.6 Pirelli & C
- 11.1.7 Sumitomo Rubber Industries
- 11.1.8 The Goodyear Tire & Rubber
- 11.1.9 Yokohama Rubber Company
- 11.2 Regional players
- 11.2.1 Best-One Tire
- 11.2.2 Kal Tire
- 11.2.3 Oliver Rubber Company
- 11.2.4 Parrish Tire Company
- 11.2.5 Southern Tire Mart
- 11.2.6 Vipal Rubber
- 11.3 Emerging players
- 11.3.1 AcuTread
- 11.3.2 Hankook Tire
- 11.3.3 Qingdao Doublestar
- 11.3.4 Redburn Tire Company
- 11.3.5 TreadWright
 2035年再生轮胎市场分析及预测:按类型、产品类型、服务、技术、组件、应用、材质、製造流程和最终用户划分
 轮胎翻新:市占率分析、产业趋势与统计、成长预测(2026-2031)
 2026年全球轮胎翻新市场报告
 2025-2029年全球汽车轮胎翻新服务市场
 全球翻新轮胎市场-按车辆类型、翻新製程、地区和竞争格局分類的产业规模、份额、趋势、机会和预测(2021-2031年)
 汽车轮胎胎面感测器:全球市场份额和排名、总收入和需求预测(2025-2031年)
 轮胎翻新市场,按轮胎类型、按工艺、按车辆类型、按最终用户、按销售管道、按国家/地区划分 - 2025 年至 2032 年全球行业分析、市场规模、市场份额及预测
 2025-2029年全球汽车翻新轮胎市场汽车翻新轮胎市场报告:2030 年趋势、预测与竞争分析
 全球汽车翻新轮胎市场:按製程类型、销售通路、车型和地区进行预测(截至2030年)