


 |
市场调查报告书
商品编码
1998758
2026 年至 2035 年饮料罐市场的商业机会、成长要素、产业趋势分析与预测。Beverage Cans Market Opportunity, Growth Drivers, Industry Trend Analysis, and Forecast 2026 - 2035 |
||||||
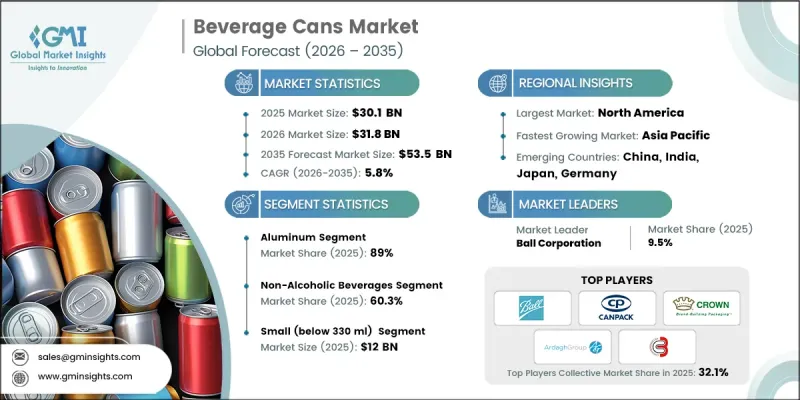
预计到 2025 年,全球饮料罐市场价值将达到 301 亿美元,并预计以 5.8% 的复合年增长率成长,到 2035 年达到 535 亿美元。
全球对便利单份饮料的需求不断增长,以及能量饮料和机能饮料的快速发展,共同推动了这个市场扩张。饮料製造商加大永续性力度,以及监管机构推行可回收包装,进一步促进了市场成长。此外,高阶包装的差异化、新兴市场产能的扩张,以及多个饮料类别从宝特瓶转向铝罐,也是推动市场成长的重要因素。同时,轻量化设计的创新、回收基础设施的完善以及家庭消费趋势的兴起,也促进了环保包装解决方案的普及,使饮料公司能够在优化供应链的同时,提供环保的包装选择。
| 市场范围 | |
|---|---|
| 开始年份 | 2025 |
| 预测期 | 2026-2035 |
| 上市时的市场规模 | 301亿美元 |
| 预测金额 | 535亿美元 |
| 复合年增长率 | 5.8% |
碳酸饮料、啤酒和机能饮料中铝罐饮料消费量的成长是市场成长的主要驱动力。对高速罐装生产线的投资、能量饮料和即饮酒精饮料产品线的拓展以及轻量化罐体生产技术的改进,都在推动市场渗透。铝罐凭藉其可回收性、轻盈性和有效的阻光阻氧性能而占据市场主导地位,这些特性延长了产品的保质期,并符合循环经济的原则。
到2025年,铝製包装将占据89%的市场。其广泛应用得益于其卓越的可回收性、与碳酸饮料和机能饮料的兼容性以及降低运输成本的轻质特性。铝的特性使其能够在保证产品品质的同时实现高品质的印刷和标籤,这进一步增强了其吸引力。全球高回收率和对永续包装的持续监管支持,也促成了铝製包装在全球饮料製造领域的统治地位。
预计到2025年,小罐装(330毫升以下)市场规模将达120亿美元。消费者对单份装和定量包装饮料的偏好日益增长,推动了小罐装饮料市场的发展。这种规格的饮料适用于能量饮料、机能饮料和高端碳酸饮料,目标客户是注重便利性和经常购买的消费者。小罐装饮料便于在都市区进行多包装销售,也便于在自动贩卖机上销售,并能促进衝动消费。製造商透过确保零售店、便利商店和娱乐场所等管道的广泛分销,以及在主要市场提供稳定的产品供应,来保持其竞争力。
预计到2025年,北美饮料罐市占率将达到36%。这一增长得益于健全的永续性法规、完善的回收体係以及宝特瓶向铝罐的转变。美国多个州和加拿大多个省份实施的押金返还计划正在加强铝的回收和闭合迴路供应链。主要企业正在扩大产能,并投资先进的轻量化罐体製造技术,以满足碳酸饮料、能量饮料和即饮酒精饮料日益增长的需求。罐体製造技术的进步和永续实践的结合,确保了该地区在全球饮料包装市场中保持主导地位。
目录
第一章:调查方法和范围
第二章执行摘要
第三章业界考察
- 生态系分析
- 供应商情况
- 利润率
- 成本结构
- 每个阶段增加的价值
- 影响价值链的因素
- 中断
- 影响产业的因素
- 促进因素
- 全球饮料业铝消费量增加
- 精酿啤酒和即饮鸡尾酒的优质化
- 高可回收性支援强制采用循环包装。
- 品牌从PET材质过渡到可无限循环利用的罐装材质
- 能量饮料和机能饮料的扩张
- 产业潜在风险与挑战
- 铝捲价格波动给利润率带来了压力。
- 旺季需求期间产能受限
- 市场机会
- 苗条而精緻的成长可以塑造
- 瓶装水领域的普及率不断提高
- 促进因素
- 成长潜力分析
- 监理情势
- 波特五力分析
- PESTEL 分析
- 科技与创新趋势
- 当前技术趋势
- 新兴技术
- 价格趋势
- 按地区
- 副产品
- 定价策略
- 新兴经营模式
- 合规要求
- 专利和智慧财产权分析
第四章 竞争情势
- 介绍
- 企业市占率分析
- 按地区
- 市场集中度分析
- 主要企业的竞争标竿分析
- 财务绩效比较
- 销售量
- 利润率
- 研究与发展(R&D)
- 产品系列比较
- 产品线宽度
- 科技
- 创新
- 区域扩张比较
- 全球扩张分析
- 服务网路覆盖
- 按地区分類的市场渗透率
- 竞争定位矩阵
- 领导者
- 挑战者
- 追踪者
- 小众玩家
- 战略展望矩阵
- 财务绩效比较
- 主要进展
- 併购
- 伙伴关係与合作
- 技术进步
- 业务拓展与投资策略
- 数位转型计划
- 新兴/Start-Ups竞争对手的发展趋势
第五章 市场估计与预测:依材料划分,2022-2035年
- 铝
- 钢
第六章 市场估算与预测:依产品类型划分,2022-2035年
- 1 件装
- 两件套罐
- 三件组罐
第七章 市场估计与预测:依产能划分,2022-2035年
- 小容量(小于330毫升)
- 中等容量(330毫升至500毫升)
- 大容量(超过500毫升)
第八章 市场估计与预测:依应用领域划分,2022-2035年
- 酒精饮料
- 不含酒精的饮料
- 碳酸饮料
- 果菜汁
- 其他的
第九章 市场估计与预测:依地区划分,2022-2035年
- 北美洲
- 我们
- 加拿大
- 欧洲
- 德国
- 英国
- 法国
- 西班牙
- 义大利
- 荷兰
- 亚太地区
- 中国
- 印度
- 日本
- 澳洲
- 韩国
- 拉丁美洲
- 巴西
- 墨西哥
- 阿根廷
- 中东和非洲
- 南非
- 沙乌地阿拉伯
- 阿拉伯聯合大公国
第十章:公司简介
- 主要企业
- Ball Corporation
- Crown Holdings
- Ardagh Group
- Novelis
- Canpack
- 按地区分類的主要企业
- 北美洲
- G3 Enterprises, Inc.
- GZI Industries
- Envases Group
- 亚太地区
- Ceylon Beverage Can
- Showa Aluminum-Can Co., Ltd.
- Toyo Seikan
- Thai Beverage Can
- Orora Packaging
- Tata Steel
- Visy
- 欧洲
- Baixicans
- Speira GmbH
- Scan Holdings
- Nampak
- 北美洲
The Global Beverage Cans Market was valued at USD 30.1 billion in 2025 and is estimated to grow at a CAGR of 5.8% to reach USD 53.5 billion by 2035.
The market's expansion is fueled by rising global demand for convenient, single-serve beverages and the rapid growth of energy drinks and functional beverages. Increasing sustainability commitments by beverage manufacturers, along with regulatory initiatives promoting recyclable packaging, are further supporting the market. Premium packaging differentiation, expanding production capacity in emerging economies, and the shift from plastic bottles to aluminum cans in several beverage segments are also driving growth. Additionally, innovations in lightweight design, enhanced recycling infrastructure, and at-home consumption trends have strengthened adoption, allowing beverage companies to optimize supply chains while maintaining environmentally responsible packaging solutions.
| Market Scope | |
|---|---|
| Start Year | 2025 |
| Forecast Year | 2026-2035 |
| Start Value | $30.1 Billion |
| Forecast Value | $53.5 Billion |
| CAGR | 5.8% |
Rising aluminum beverage consumption across carbonated drinks, beer, and functional beverages is a key driver of market growth. Investments in high-speed canning lines, expansion of energy drink and ready-to-drink alcoholic beverage product lines, and improvements in lightweight can production have bolstered penetration. Aluminum cans dominate the market due to their recyclability, light weight, and ability to create effective barriers against light and oxygen, which extends product shelf life and aligns with circular economy principles.
The aluminum segment held 89% share in 2025. Its widespread adoption is driven by superior recyclability, compatibility with carbonated and functional beverages, and lightweight properties that reduce transportation costs. Aluminum's ability to maintain product integrity while supporting premium printing and labeling further enhances its appeal. High global recycling rates and ongoing regulatory support for sustainable packaging help maintain aluminum's dominance in beverage manufacturing worldwide.
The small-size cans segment (below 330 ml) reached USD 12 billion in 2025. The growing preference for single-serve and portion-controlled beverages has fueled demand for compact cans. These sizes cater to energy drinks, functional beverages, and premium carbonated drinks, targeting convenience-oriented consumers and frequent purchase occasions. Compact cans support multipack sales, vending machine compatibility, and impulse buying in urban environments. Manufacturers maintain competitive positioning by ensuring wide distribution through retail, convenience, and entertainment channels, ensuring consistent product availability across key markets.
North America Beverage Cans Market accounted for 36% share in 2025. Growth in this region is supported by strong sustainability regulations, established recycling frameworks, and the substitution of plastic bottles with aluminum cans. Deposit return schemes in multiple U.S. states and Canadian provinces strengthen aluminum recycling and closed-loop supply chains. Leading players are investing in capacity expansion and advanced lightweight canning technologies to meet increasing demand from carbonated beverages, energy drinks, and ready-to-drink alcoholic products. Technological advancements in can production, combined with sustainable practices, help the region maintain its leadership in global beverage packaging.
Key players operating in the Global Beverage Cans Market include Ball Corporation, Crown Holdings, Ardagh Group, Canpack, Showa Aluminum-Can Co., Ltd., Novelis, G3 Enterprises, Inc., Ceylon Beverage Can, Tata Steel, Visy, Baixicans, Envases Group, Scan Holdings, Toyo Seikan, GZI Industries, Orora Packaging, Speira GmbH, and Thai Beverage Can. Companies in the Global Beverage Cans Market are leveraging multiple strategies to strengthen their market position and growth. Investments in research and development focus on lightweight and eco-friendly aluminum designs to enhance recyclability while reducing carbon footprints. Expansion of production facilities and high-speed canning lines in emerging markets ensures capacity meets growing demand. Firms are collaborating with beverage manufacturers to offer customized, branded, and limited-edition cans that differentiate products on the shelf. Sustainability initiatives, such as closed-loop recycling partnerships and the adoption of low-carbon production practices, reinforce compliance with regulatory requirements.
Table of Contents
Chapter 1 Methodology and Scope
- 1.1 Market scope and definition
- 1.2 Research design
- 1.2.1 Research approach
- 1.2.2 Data collection methods
- 1.3 Data mining sources
- 1.3.1 Global
- 1.3.2 Regional/Country
- 1.4 Base estimates and calculations
- 1.4.1 Base year calculation
- 1.4.2 Key trends for market estimation
- 1.5 Primary research and validation
- 1.5.1 Primary sources
- 1.6 Forecast model
- 1.7 Research assumptions and limitations
Chapter 2 Executive Summary
- 2.1 Industry 360° synopsis, 2022 - 2035
- 2.2 Key market trends
- 2.2.1 Material trends
- 2.2.2 Product type trends
- 2.2.3 Capacity trends
- 2.2.4 Application trends
- 2.2.5 Regional trends
- 2.3 TAM Analysis, 2026-2035
- 2.4 CXO perspectives: Strategic imperatives
Chapter 3 Industry Insights
- 3.1 Industry ecosystem analysis
- 3.1.1 Supplier Landscape
- 3.1.2 Profit Margin
- 3.1.3 Cost structure
- 3.1.4 Value addition at each stage
- 3.1.5 Factor affecting the value chain
- 3.1.6 Disruptions
- 3.2 Industry impact forces
- 3.2.1 Growth drivers
- 3.2.1.1 Rising global aluminum beverage consumption volumes
- 3.2.1.2 Premiumization of craft beer and RTD cocktails
- 3.2.1.3 High recyclability supporting circular packaging mandates
- 3.2.1.4 Brand shift from PET to infinitely recyclable cans
- 3.2.1.5 Expansion of energy drink and functional beverages
- 3.2.2 Industry pitfalls and challenges
- 3.2.2.1 Volatile aluminum coil pricing pressures margins
- 3.2.2.2 Capacity constraints during peak seasonal demand
- 3.2.3 Market opportunities
- 3.2.3.1 Growth in slim and sleek can formats
- 3.2.3.2 Increasing adoption in bottled water segment
- 3.2.1 Growth drivers
- 3.3 Growth potential analysis
- 3.4 Regulatory landscape
- 3.4.1 North America
- 3.4.2 Europe
- 3.4.3 Asia Pacific
- 3.4.4 Latin America
- 3.4.5 Middle East & Africa
- 3.5 Porter's analysis
- 3.6 PESTEL analysis
- 3.7 Technology and Innovation landscape
- 3.7.1 Current technological trends
- 3.7.2 Emerging technologies
- 3.8 Price trends
- 3.8.1 By region
- 3.8.2 By product
- 3.9 Pricing Strategies
- 3.10 Emerging Business Models
- 3.11 Compliance Requirements
- 3.12 Patent and IP analysis
Chapter 4 Competitive Landscape, 2025
- 4.1 Introduction
- 4.2 Company market share analysis
- 4.2.1 By region
- 4.2.1.1 North America
- 4.2.1.2 Europe
- 4.2.1.3 Asia Pacific
- 4.2.1.4 Latin America
- 4.2.1.5 Middle East & Africa
- 4.2.2 Market concentration analysis
- 4.2.1 By region
- 4.3 Competitive benchmarking of key players
- 4.3.1 Financial performance comparison
- 4.3.1.1 Revenue
- 4.3.1.2 Profit margin
- 4.3.1.3 R&D
- 4.3.2 Product portfolio comparison
- 4.3.2.1 Product range breadth
- 4.3.2.2 Technology
- 4.3.2.3 Innovation
- 4.3.3 Geographic presence comparison
- 4.3.3.1 Global footprint analysis
- 4.3.3.2 Service network coverage
- 4.3.3.3 Market penetration by region
- 4.3.4 Competitive positioning matrix
- 4.3.4.1 Leaders
- 4.3.4.2 Challengers
- 4.3.4.3 Followers
- 4.3.4.4 Niche players
- 4.3.5 Strategic outlook matrix
- 4.3.1 Financial performance comparison
- 4.4 Key developments
- 4.4.1 Mergers and acquisitions
- 4.4.2 Partnerships and collaborations
- 4.4.3 Technological advancements
- 4.4.4 Expansion and investment strategies
- 4.4.5 Digital transformation initiatives
- 4.5 Emerging/ startup competitors landscape
Chapter 5 Market Estimates and Forecast, By Material, 2022 - 2035 (USD Million)
- 5.1 Key trends
- 5.2 Aluminum
- 5.3 Steel
Chapter 6 Market Estimates and Forecast, By Product Type, 2022 - 2035 (USD Million)
- 6.1 Key trends
- 6.2 1-piece cans
- 6.3 2-piece cans
- 6.4 3-piece cans
Chapter 7 Market Estimates and Forecast, By Capacity, 2022 - 2035 (USD Million)
- 7.1 Key trends
- 7.2 Small (below 330 ml)
- 7.3 Medium (330 ml - 500 ml)
- 7.4 Large (above 500 ml)
Chapter 8 Market Estimates and Forecast, By Application, 2022 - 2035 (USD Million)
- 8.1 Key trends
- 8.2 Alcoholic beverages
- 8.3 Non-alcoholic beverages
- 8.3.1 Carbonated soft drinks
- 8.3.2 Fruit & vegetable juices
- 8.3.3 Others
Chapter 9 Market Estimates and Forecast, By Region, 2022 - 2035 (USD Million)
- 9.1 Key trends
- 9.2 North America
- 9.2.1 U.S.
- 9.2.2 Canada
- 9.3 Europe
- 9.3.1 Germany
- 9.3.2 UK
- 9.3.3 France
- 9.3.4 Spain
- 9.3.5 Italy
- 9.3.6 Netherlands
- 9.4 Asia Pacific
- 9.4.1 China
- 9.4.2 India
- 9.4.3 Japan
- 9.4.4 Australia
- 9.4.5 South Korea
- 9.5 Latin America
- 9.5.1 Brazil
- 9.5.2 Mexico
- 9.5.3 Argentina
- 9.6 Middle East and Africa
- 9.6.1 South Africa
- 9.6.2 Saudi Arabia
- 9.6.3 UAE
Chapter 10 Company Profiles
- 10.1 Global Key Players
- 10.1.1 Ball Corporation
- 10.1.2 Crown Holdings
- 10.1.3 Ardagh Group
- 10.1.4 Novelis
- 10.1.5 Canpack
- 10.2 Regional key players
- 10.2.1 North America
- 10.2.1.1 G3 Enterprises, Inc.
- 10.2.1.2 GZI Industries
- 10.2.1.3 Envases Group
- 10.2.2 Asia Pacific
- 10.2.2.1 Ceylon Beverage Can
- 10.2.2.2 Showa Aluminum-Can Co., Ltd.
- 10.2.2.3 Toyo Seikan
- 10.2.2.4 Thai Beverage Can
- 10.2.2.5 Orora Packaging
- 10.2.2.6 Tata Steel
- 10.2.2.7 Visy
- 10.2.3 Europe
- 10.2.3.1 Baixicans
- 10.2.3.2 Speira GmbH
- 10.2.3.3 Scan Holdings
- 10.2.3.4 Nampak
- 10.2.1 North America
 饮料罐市场:2026-2032年全球市场预测(依材质、罐体尺寸、製造流程、应用及销售管道)
 2026年全球铝瓶市场报告
 铝瓶市场规模、份额、成长及全球产业分析:按类型、应用和区域划分,预测2026-2034年全球饮料罐市场规模、份额、趋势和成长分析报告(2026-2034)2026年全球饮料罐市场报告
 饮料罐市场规模、份额和成长分析(按材料、应用和地区划分)-2026-2033年产业预测
 全球饮料罐市场
 铝饮料罐市场报告:趋势、预测和竞争分析(至 2031 年)
 2025-2029 年全球饮料罐市场
 美国铝饮料罐:市场占有率分析、产业趋势与成长预测(2025-2030)