


 |
市场调查报告书
商品编码
1998768
2026 年至 2035 年电动商用车的市场机会、成长要素、产业趋势分析与预测。Electric Commercial Vehicle Market Opportunity, Growth Drivers, Industry Trend Analysis, and Forecast 2026 - 2035 |
||||||
预计到 2025 年,全球电动商用车市场规模将达到 842 亿美元,并预计以 10.1% 的复合年增长率成长,到 2035 年达到 2,220 亿美元。
这一强劲增长得益于车辆电气化进程的加速、电池成本的下降、日益严格的排放气体法规以及政府大力支持零排放交通的奖励措施。电动商用车(ECV)因其整体拥有成本更低、维护需求更少以及零排放等优势,正日益被物流、公共交通、市政服务和工业领域所采用。电池能量密度、电力电子技术和快速充电基础设施的进步显着提升了车辆的续航里程、有效载荷能力和运营效率,使电动商用车在都市区和乡村应用中都更加实用化。此外,企业永续发展要求和ESG合规目标正促使车主逐步淘汰柴油车,进一步推动了市场的长期成长。
| 市场范围 | |
|---|---|
| 开始年份 | 2025 |
| 预测期 | 2026-2035 |
| 上市时的市场规模 | 842亿美元 |
| 预计金额 | 2220亿美元 |
| 复合年增长率 | 10.1% |
预计到2025年,厢型车市占率将达到37%,并在2026年至2035年间以9.5%的复合年增长率成长。电动厢型车因其车身紧凑、操控灵活、能够高效应对拥堵路况等优势,正日益受到关注,成为都市区营运的理想解决方案。随着电子商务和当日达服务需求的不断增长,物流和配送公司也越来越青睐电动厢型车。与柴油厢型车相比,电动厢型车的燃料和维护成本更低,为企业带来长期的成本节约和营运效率的提升。
到2025年,101-250kWh电池组的市占率将达到28%,预计2026年至2035年将以8.2%的复合年增长率成长。此容量范围内的中檔电池能够实现高效的电力消耗和更快的充电速度,无论是在家中或公共快充站都能快速充电。这些电池与大多数现有的充电基础设施相容,能够快速为电动商用车充电,同时确保日常营运的最佳便利性和性能。
预计2025年,中国电动商用车市场规模将达375亿美元。由于国产商用车具有成本效益,中国电动车产业正快速发展。中国对电动车供应链拥有强大的控制力,电池生产和原料采购都在国内完成。这种垂直整合降低了生产成本,减少了对海外供应商的依赖,使中国电动商用车在全球范围内极具竞争力。此外,不同地区的製造商正在拓展企业发展在不同市场的细分电动商用车业务,进一步推动市场成长。
目录
第一章:调查方法和范围
第二章执行摘要
第三章业界考察
- 生态系分析
- 供应商情况
- 电池製造商
- 零件供应商
- OEM(原始设备製造商)
- 销售代理商/经销商
- 5 个最终用户
- 成本结构
- 利润率
- 每个阶段增加的价值
- 垂直整合趋势
- 颠覆者
- 供应商情况
- 影响因素
- 促进因素
- 严格执行排放法规
- 电子商务和最后一公里需求的成长
- 公司车辆强制电气化
- 改善都市区空气品质的努力
- 产业潜在风险与挑战
- 充电基础设施发展不足
- 原料和电池供不应求
- 市场机会
- 引入高功率快速充电
- 降低电池成本的进展
- 可扩展模组化汽车平臺
- V2G和储能集成
- 促进因素
- 技术趋势与创新生态系统
- 目前技术
- 新兴技术
- 成长潜力分析
- 监理情势
- 北美洲
- 美国联邦机动车安全标准
- 加拿大电动车安全法规
- 欧洲
- 联合国欧洲经济委员会规章
- 欧盟电动车标籤法规
- 亚太地区
- AIS-142(印度汽车工业标准)
- 中国 GB
- 拉丁美洲
- ABNT NBR
- NOM-116-SCFI-2016
- 中东和非洲
- SASO 2888/2018
- SANS 1737
- 北美洲
- 波特五力分析
- PESTEL 分析
- 专利分析(基于初步研究)
- 价格分析(基于初步调查)
- 对过去价格趋势的分析
- 按玩家类型分類的定价策略
- 贸易统计(基于付费资料库)
- 生产基地
- 消费中心
- 进出口
- 永续性和环境方面
- 永续倡议
- 减少废弃物策略
- 生产中的能源效率
- 具有环保意识的倡议
- 碳足迹考量
- 人工智慧和生成式人工智慧对市场的影响
- 利用人工智慧改造现有经营模式
- 预测性维护和营运优化
- 自动化设计最佳化
- 用于需求预测的供应链人工智慧
- GenAI 各细分市场的应用案例与部署蓝图
- 胎面花纹设计与生成
- 客户服务聊天机器人和技术支援
- 行销内容创作
- 风险、限制和监管考量
- 物联网智慧产品中的资料隐私
- 人工智慧演算法的透明度要求
- 人工智慧驱动的产品故障责任
- 利用人工智慧改造现有经营模式
- 预测假设和情境分析(基于初步研究)
- 基本案例-驱动复合年增长率的关键宏观经济与产业变量
- 乐观情境-有利的宏观经济和产业利好因素
- 悲观情景-宏观经济放缓或产业逆风
第四章 竞争情势
- 介绍
- 企业市占率分析
- 北美洲
- 欧洲
- 亚太地区
- 拉丁美洲
- 中东和非洲
- 主要市场公司的竞争分析
- 竞争定位矩阵
- 企业级分层基准测试
- 层级分类标准与选择标准
- 按销售额、地区和创新能力分類的层级定位矩阵。
- 主要进展
- 併购
- 伙伴关係和联盟
- 新产品发布
- 业务拓展计划及资金筹措
第五章 市场估价与预测:依车辆类型划分,2022-2035年
- 皮卡车
- 小型电动皮卡
- 大型和小型电动皮卡
- 范
- 紧凑型电动货车
- 中型电动货车
- 全尺寸电动货车
- 追踪
- 中型电动卡车
- 大型电动卡车
- 巴士和长途汽车
- 电动巴士
- 电动长途巴士
- 电动校车
第六章 市场估价与预测:依电池容量划分,2022-2035年
- 小于100度
- 101~250 kWh
- 251~400 kWh
- 401~550 kWh
- 超过550度
第七章 市场估计与预测:依驱动因素划分,2022-2035年
- 电池式电动车(BEV)
- 燃料电池电动车(FCEV)
- 插电式混合动力汽车(PHEV)
第八章 市场估计与预测:依应用领域划分,2022-2035年
- 最后一公里配送
- 现场服务
- 配送服务
- 长途
- 其他的
第九章 市场估计与预测:依地区划分,2022-2035年
- 北美洲
- 我们
- 加拿大
- 欧洲
- 英国
- 德国
- 法国
- 义大利
- 西班牙
- 比利时
- 荷兰
- 瑞典
- 俄罗斯
- 亚太地区
- 中国
- 印度
- 日本
- 澳洲
- 新加坡
- 韩国
- 越南
- 印尼
- 拉丁美洲
- 巴西
- 墨西哥
- 阿根廷
- 中东和非洲(MEA)
- 南非
- 沙乌地阿拉伯
- 阿拉伯聯合大公国
第十章:公司简介
- 世界公司
- BYD Company
- Mercedes-Benz
- Volvo
- Tesla
- Yutong Bus
- Ford Motor Company
- Scania
- Daimler Truck
- PACCAR
- 本地球员
- Tata Motors
- Dongfeng Motor
- Renault Trucks
- Proterra
- Arrival
- VinFast Auto
- Lion Electric
- 新兴企业
- Rivian Automotive
- Nikola
- Workhorse
- VDL Groep
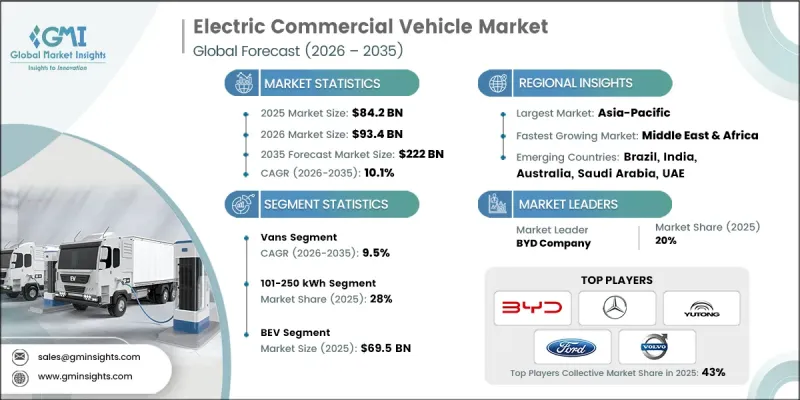
The Global Electric Commercial Vehicle Market was valued at USD 84.2 billion in 2025 and is estimated to grow at a CAGR of 10.1% to reach USD 222 billion by 2035.
The robust growth is driven by accelerating fleet electrification, declining battery costs, stringent emission regulations, and strong government incentives supporting zero-emission transportation. Electric commercial vehicles (ECVs) are increasingly adopted across logistics, public transportation, municipal services, and industrial operations due to their lower total cost of ownership, reduced maintenance requirements, and zero tailpipe emissions. Advancements in battery energy density, power electronics, and fast-charging infrastructure are significantly improving vehicle range, payload capacity, and operational efficiency, making electric commercial vehicles viable across both urban and regional applications. In addition, corporate sustainability mandates and ESG compliance goals are compelling fleet operators to transition away from diesel-powered vehicles, further reinforcing long-term market growth.
| Market Scope | |
|---|---|
| Start Year | 2025 |
| Forecast Year | 2026-2035 |
| Start Value | $84.2 Billion |
| Forecast Value | $222 Billion |
| CAGR | 10.1% |
The vans segment held 37% share in 2025 and is estimated to grow at a CAGR of 9.5% from 2026 to 2035. Electric vans are increasingly seen as ideal solutions for urban operations due to their compact size, high maneuverability, and ability to navigate congested streets efficiently. Logistics and delivery companies favor electric vans because of the rising demand for e-commerce and same-day delivery services. Compared to diesel vans, electric vans offer lower fuel and maintenance costs, providing operators with long-term cost savings and improved operational efficiency.
The 101-250 kWh battery segment held a 28% share in 2025 and is expected to grow at a CAGR of 8.2% from 2026 to 2035. Mid-sized batteries in this range deliver efficient power consumption and faster charging, whether at home or at public fast-charging stations. These batteries are compatible with most existing charging infrastructure, allowing electric commercial vehicles to recharge quickly while ensuring optimal usability and performance for daily operations.
China Electric Commercial Vehicle Market reached USD 37.5 billion in 2025. The country's EV industry is rapidly growing due to the cost-effectiveness of locally produced commercial vehicles. China maintains strong control over its EV supply chain, producing batteries and sourcing raw materials domestically. This vertical integration lowers production costs and reduces reliance on international suppliers, making Chinese electric commercial vehicles highly competitive globally. Regional manufacturers are also expanding their footprint in niche electric commercial vehicle segments across different markets, driving further growth.
Key players operating in the Global Electric Commercial Vehicle Market include AB Volvo, BYD, Daimler Truck Holding AG, Ford Motor Company, Hyundai Motor Company, Tesla Inc., PACCAR Inc., Rivian Automotive, Traton SE, Zhengzhou Yutong Bus Co., Ltd., Tata Motors, Ashok Leyland, and NFI Group, among others. Companies in the Electric Commercial Vehicle Market are strengthening their market presence through a combination of product innovation, strategic partnerships, and capacity expansion. Leading manufacturers are investing heavily in advanced battery technologies, modular electric platforms, and ultra-fast charging capabilities to enhance vehicle performance and reduce total ownership costs. Partnerships with battery suppliers, charging infrastructure providers, and logistics operators enable faster commercialization and large-scale fleet deployments. Many players are expanding regional manufacturing facilities to localize production, reduce costs, and comply with government localization policies.
Table of Contents
Chapter 1 Methodology & Scope
- 1.1 Research approach
- 1.2 Quality Commitments
- 1.2.1 GMI AI policy & data integrity commitment
- 1.2.1.1 Source consistency protocol
- 1.2.1 GMI AI policy & data integrity commitment
- 1.3 Research Trail & Confidence Scoring
- 1.3.1 Research Trail Components
- 1.3.2 Scoring Components
- 1.4 Data Collection
- 1.4.1 Partial list of primary sources
- 1.5 Data mining sources
- 1.5.1 Paid sources
- 1.5.1.1 Sources, by region
- 1.5.1 Paid sources
- 1.6 Base estimates and calculations
- 1.6.1 Base year calculation for any one approach
- 1.7 Forecast
- 1.7.1 Quantified market impact analysis
- 1.7.1.1 Mathematical impact of growth parameters on forecast
- 1.7.1 Quantified market impact analysis
- 1.8 Research transparency addendum
- 1.8.1 Source attribution framework
- 1.8.2 Quality assurance metrics
- 1.8.3 Our commitment to trust
Chapter 2 Executive Summary
- 2.1 Industry 360° synopsis
- 2.2 Key market trends
- 2.2.1 Regional
- 2.2.2 Vehicle
- 2.2.3 Battery capacity
- 2.2.4 Propulsion
- 2.2.5 Application
- 2.3 TAM Analysis, 2026-2035
- 2.4 CXO perspectives: Strategic imperatives
Chapter 3 Industry Insights
- 3.1 Industry ecosystem analysis
- 3.1.1 Supplier landscape
- 3.1.1.1 Battery Manufacturer
- 3.1.1.2 Component Supplier
- 3.1.1.3 OEM (Original Equipment Manufacturer)
- 3.1.1.4 Distributor / Dealer
- 3.1.1. 5 End user
- 3.1.2 Cost structure
- 3.1.3 Profit margin
- 3.1.4 Value addition at each stage
- 3.1.5 Vertical integration trends
- 3.1.6 Disruptors
- 3.1.1 Supplier landscape
- 3.2 Impact on forces
- 3.2.1 Growth drivers
- 3.2.1.1 Strict emission regulations enforcement
- 3.2.1.2 E-commerce and last-mile demand growth
- 3.2.1.3 Corporate fleet electrification mandates
- 3.2.1.4 Urban air quality improvement initiatives
- 3.2.2 Industry pitfalls & challenges
- 3.2.2.1 Insufficient charging infrastructure coverage
- 3.2.2.2 Raw material and battery shortages
- 3.2.3 Market opportunities
- 3.2.3.1 High-power fast charging deployment
- 3.2.3.2 Battery cost reduction advances
- 3.2.3.3 Scalable modular vehicle platforms
- 3.2.3.4 V2G and energy storage integration
- 3.2.1 Growth drivers
- 3.3 Technology trends & innovation ecosystem
- 3.3.1 Current technologies
- 3.3.2 Emerging technologies
- 3.4 Growth potential analysis
- 3.5 Regulatory landscape
- 3.5.1 North America
- 3.5.1.1 U.S. Federal Motor Vehicle Safety Standards
- 3.5.1.2 Canadian Electric Vehicle Safety Regulations
- 3.5.2 Europe
- 3.5.2.1 UNECE Regulation
- 3.5.2.2 EU EV Labelling Regulation
- 3.5.3 Asia-Pacific
- 3.5.3.1 AIS-142 (Automotive Industry Standard, India)
- 3.5.3.2 China GB
- 3.5.4 Latin America
- 3.5.4.1 ABNT NBR
- 3.5.4.2 NOM-116-SCFI-2016
- 3.5.5 Middle East & Africa
- 3.5.5.1 SASO 2888/2018
- 3.5.5.2 SANS 1737
- 3.5.1 North America
- 3.6 Porter's analysis
- 3.7 PESTEL analysis
- 3.8 Patent analysis (Driven by Primary Research)
- 3.9 Pricing Analysis (Driven by Primary Research)
- 3.9.1 Historical Price Trend Analysis
- 3.9.2 Pricing Strategy by Player Type
- 3.10 Trade statistics (Driven by Paid Database)
- 3.10.1 Production hubs
- 3.10.2 Consumption hubs
- 3.10.3 Export and import
- 3.11 Sustainability and environmental aspects
- 3.11.1 Sustainable practices
- 3.11.2 Waste reduction strategies
- 3.11.3 Energy efficiency in production
- 3.11.4 Eco-friendly initiatives
- 3.11.5 Carbon footprint considerations
- 3.12 Impact of AI & generative AI on the market
- 3.12.1 AI-driven disruption of existing business models
- 3.12.1.1 Predictive Maintenance & Operations Optimization
- 3.12.1.2 Automated design optimization
- 3.12.1.3 Supply chain AI for demand forecasting
- 3.12.1.4 GenAI use cases & adoption roadmap by segment
- 3.12.1.4.1 Tread pattern design generation
- 3.12.1.4.2 Customer service chatbots & technical support
- 3.12.1.4.3 Marketing content creation
- 3.12.1.4.4 Risks, limitations & regulatory considerations
- 3.12.1.4.4.1 Data privacy in IoT-enabled smart products
- 3.12.1.4.4.2 AI algorithm transparency requirements
- 3.12.1.4.4.3 Liability in AI-driven product failures
- 3.12.1 AI-driven disruption of existing business models
- 3.13 Forecast assumptions & scenario analysis (Driven by Primary Research)
- 3.13.1 Base Case - key macro & industry variables driving CAGR
- 3.13.2 Optimistic Scenarios - Favorable Macro and Industry Tailwinds
- 3.13.3 Pessimistic Scenario - Macroeconomic slowdown or industry headwinds
Chapter 4 Competitive Landscape, 2025
- 4.1 Introduction
- 4.2 Company market share analysis
- 4.2.1 North America
- 4.2.2 Europe
- 4.2.3 Asia-Pacific
- 4.2.4 Latin America
- 4.2.5 Middle East & Africa
- 4.3 Competitive analysis of major market players
- 4.4 Competitive positioning matrix
- 4.5 Company Tier Benchmarking
- 4.5.1 Tier Classification Criteria & Qualifying Thresholds
- 4.5.2 Tier Positioning Matrix by Revenue, Geography & Innovation
- 4.6 Key developments
- 4.6.1 Mergers & acquisitions
- 4.6.2 Partnerships & collaborations
- 4.6.3 New product launches
- 4.6.4 Expansion plans and funding
Chapter 5 Market Estimates & Forecast, By Vehicle, 2022 - 2035 ($ Bn, Units)
- 5.1 Key trends
- 5.2 Pickup Trucks
- 5.2.1 Light-Duty Electric Pickups
- 5.2.2 Heavy Light-Duty Electric Pickups
- 5.3 Vans
- 5.3.1 Compact Electric Vans
- 5.3.2 Mid-Size Electric Vans
- 5.3.3 Full-Size Electric Vans
- 5.4 Trucks
- 5.4.1 Medium-Duty Electric Trucks
- 5.4.2 Heavy-Duty Electric Trucks
- 5.5 Buses & Coaches
- 5.5.1 Electric Transit Buses
- 5.5.2 Electric Intercity Coaches
- 5.5.3 Electric School Buses
Chapter 6 Market Estimates & Forecast, By Battery Capacity, 2022 - 2035 ($ Bn, Units)
- 6.1 Key trends
- 6.2 Less than 100 kWh
- 6.3 101-250 kWh
- 6.4 251-400 kWh
- 6.5 401-550 kWh
- 6.6 More than 550 kWh
Chapter 7 Market Estimates & Forecast, By Propulsion, 2022 - 2035 ($ Bn, Units)
- 7.1 Key trends
- 7.2 Battery Electric Vehicle (BEV)
- 7.3 Fuel Cell Electric Vehicle (FCEV)
- 7.4 Plug-in Hybrid Electric Vehicle (PHEV)
Chapter 8 Market Estimates & Forecast, By Application, 2022 - 2035 ($ Bn, Units)
- 8.1 Key trends
- 8.2 Last-Mile Delivery
- 8.3 Field Services
- 8.4 Distribution Services
- 8.5 Long-Haul Transportation
- 8.6 Others
Chapter 9 Market Estimates & Forecast, By Region, 2022 - 2035 ($ Bn, Units)
- 9.1 North America
- 9.1.1 US
- 9.1.2 Canada
- 9.2 Europe
- 9.2.1 UK
- 9.2.2 Germany
- 9.2.3 France
- 9.2.4 Italy
- 9.2.5 Spain
- 9.2.6 Belgium
- 9.2.7 Netherlands
- 9.2.8 Sweden
- 9.2.9 Russia
- 9.3 Asia Pacific
- 9.3.1 China
- 9.3.2 India
- 9.3.3 Japan
- 9.3.4 Australia
- 9.3.5 Singapore
- 9.3.6 South Korea
- 9.3.7 Vietnam
- 9.3.8 Indonesia
- 9.4 Latin America
- 9.4.1 Brazil
- 9.4.2 Mexico
- 9.4.3 Argentina
- 9.5 MEA
- 9.5.1 South Africa
- 9.5.2 Saudi Arabia
- 9.5.3 UAE
Chapter 10 Company Profiles
- 10.1 Global players
- 10.1.1 BYD Company
- 10.1.2 Mercedes-Benz
- 10.1.3 Volvo
- 10.1.4 Tesla
- 10.1.5 Yutong Bus
- 10.1.6 Ford Motor Company
- 10.1.7 Scania
- 10.1.8 Daimler Truck
- 10.1.9 PACCAR
- 10.2 Regional players
- 10.2.1 Tata Motors
- 10.2.2 Dongfeng Motor
- 10.2.3 Renault Trucks
- 10.2.4 Proterra
- 10.2.5 Arrival
- 10.2.6 VinFast Auto
- 10.2.7 Lion Electric
- 10.3 Emerging players
- 10.3.1 Rivian Automotive
- 10.3.2 Nikola
- 10.3.3 Workhorse
- 10.3.4 VDL Groep
 电动商用车市场:2026-2032年全球市场预测(按车辆类型、充电基础设施、推进系统、驱动系统、车速、应用和最终用途产业划分)
 电动商用车市场规模、份额、成长及全球产业分析:按类型、应用和地区划分,并预测至2026-2034年全球工业电动车市场规模、份额、趋势和成长分析报告(2026-2034年)全球电动商用车市场规模、份额、趋势和成长分析报告(2026-2034年)
 电动商用车市场-全球产业规模、份额、趋势、机会及预测(按车辆类型、动力系统、续航里程、地区及竞争格局划分,2021-2031年)电动商用车零件市场-全球产业规模、份额、趋势、机会及预测(依车辆类型、需求类别、零件类型、地区及竞争格局划分,2021-2031年)新能源商用车地板市场按动力类型、电池容量、充电方式、车辆类型和应用领域划分,全球预测(2026-2032)纯电动自装式垃圾车市场:按电池类型、有效载荷、功率输出、车速、应用和销售管道的全球预测(2026-2032)
 日本商用电动车市场规模、份额、趋势及预测(按车辆类型、驱动方式、应用领域、电池类型、电池容量和地区划分)(2026-2034 年)
 全球电动商用车市场:预测(至2032年)-按车辆类型、推进系统、零件、电池容量、续航里程、应用和地区进行分析