


 |
市场调查报告书
商品编码
2019176
瓜尔胶复合物市场机会、成长要素、产业趋势分析及2026-2035年预测Guar Complex Market Opportunity, Growth Drivers, Industry Trend Analysis, and Forecast 2026 - 2035 |
||||||
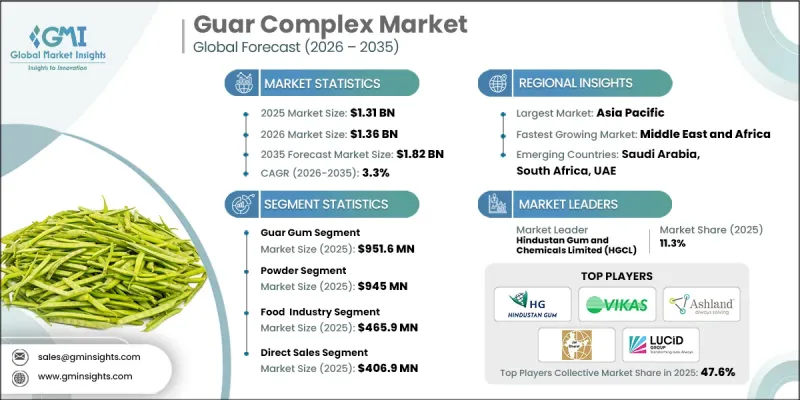
预计到 2025 年,全球瓜尔胶复合物市场价值将达到 13.1 亿美元,年复合成长率为 3.3%,到 2035 年将达到 18.2 亿美元。
瓜尔胶复合市场涵盖了一条完整的价值链,从瓜尔豆的种植和供应开始,一直延伸到瓜尔胶、瓜尔豆片和瓜尔豆粉等衍生产品的加工。由于瓜尔豆需水量低且能耐受恶劣的气候条件,因此主要种植在半干旱地区,从而保证了原料的稳定供应。瓜尔胶复合产业因其作为天然增稠剂和粘合剂的功能,在多个行业中发挥着至关重要的作用。瓜尔胶衍生产品因其能够调节配方黏度、提高稳定性并增强保水性而广受认可。这些功能优势使其在各种工业应用中广泛应用。近年来,加工技术的进步显着提高了产品品质和营运效率。製造商越来越多地采用最新的研磨、精炼和黏度控制技术,以满足特定应用的需求。自动化和先进的品质监控系统也有助于减少废弃物并提高品质一致性。人们对植物来源和可生物降解材料日益增长的兴趣,进一步推动了瓜尔胶复合市场的需求成长。
| 市场范围 | |
|---|---|
| 开始年份 | 2025 |
| 预测期 | 2026-2035 |
| 上市时的市场规模 | 13.1亿美元 |
| 预测金额 | 18.2亿美元 |
| 复合年增长率 | 3.3% |
预计到2025年,瓜尔胶市场规模将达到9.516亿美元。瓜尔胶具有优异的增稠和稳定性能,应用广泛,适用于许多工业领域的各种用途。市场趋势日益关注产品性能的稳定性、特定应用的功能性以及洁净标示的要求。此外,瓜尔胶的营养价值和成本效益使其在饲料相关应用领域持续保持强劲的需求。瓜尔豆的种植和加工与下游产品的可靠性密切相关,这些产品能够确保各个终端使用者领域稳定的供应和应用效能。
预计到2025年,食品领域市场规模将达到4.659亿美元。该领域的需求主要源于产品配方中对有效质地控制、稳定性和水分管理的需求。製造商越来越注重实现均匀一致的稠度和可靠的加工效果。黏度控制、结构稳定性和耐温性等功能性要求是产品开发的重要考量。在加工和储存过程中保持产品特性的一致性至关重要,这也持续推动着瓜尔胶衍生原料的应用。在确保稳定性和均匀性的同时提升配方性能的能力,仍然是推动食品相关应用采用瓜尔胶的关键因素。
预计北美瓜尔胶复合物市场规模将从2025年的2.494亿美元成长至2035年的3.191亿美元,并在整个预测期内保持稳定成长。这一区域成长主要得益于食品加工、工业和个人护理行业的持续需求。可靠的供应链、稳定的产品品质和技术支援是推动市场动态的因素。消费者对检验性能标准的植物来源材料的日益偏好也影响市场需求。在美国,买家优先考虑黏度稳定、符合既定品质标准并能保证及时交货的产品。稳定的筹资策略和库存管理有助于维持市场平衡,而对加工产品的持续需求则支撑着瓜尔胶复合物市场的整体成长。
目录
第一章:调查方法和范围
第二章执行摘要
第三章业界考察
- 生态系分析
- 供应商情况
- 利润率
- 每个阶段增加的价值
- 影响价值链的因素
- 中断
- 影响产业的因素
- 促进因素
- 整个产业对天然增稠剂的需求日益增长
- 扩大油田应用以支持瓜尔豆消费成长
- 消费者对植物来源功能性成分的偏好日益增长。
- 陷阱与挑战
- 由于季节性供应变化导致的价格波动频繁发生。
- 储存基础设施不足正在影响原材料的品质水准。
- 机会
- 它在加工食品中的应用正在全球范围内稳步扩大。
- 产品客製化以满足不同工业应用的需求。
- 促进因素
- 成长潜力分析
- 监理情势
- 波特五力分析
- PESTEL 分析
- 科技与创新趋势
- 当前技术趋势
- 新兴技术
- 价格趋势
- 按地区
- 按类型
- 未来市场趋势
- 科技与创新趋势
- 当前技术趋势
- 新兴技术
- 专利趋势
- 贸易统计(HS编码)
- 主要进口国
- 主要出口国
- 永续性和环境方面
- 永续倡议
- 减少废弃物策略
- 生产中的能源效率
- 环保意识的倡议
- 考虑碳足迹
第四章 竞争情势
- 介绍
- 企业市占率分析
- 按地区
- 北美洲
- 欧洲
- 亚太地区
- 拉丁美洲
- 中东和非洲
- 按地区
- 企业矩阵分析
- 主要市场公司的竞争分析
- 竞争定位矩阵
- 主要进展
- 併购
- 伙伴关係与合作
- 新产品发布
- 业务拓展计划
第五章 市场估计与预测:依类型划分,2022-2035年
- 瓜尔胶
- 瓜米尔
- 瓜尔豆
第六章 市场估计与预测:依类型划分,2022-2035年
- 粉末
- 颗粒
- 液体
第七章 市场估计与预测:依应用领域划分,2022-2035年
- 食品工业
- 麵包糖果甜点
- 乳製品和冷冻甜点
- 调味酱料
- 饮料业
- 其他的
第八章 市场估算与预测:依通路划分,2022-2035年
- 直销
- 间接销售
- 线上零售
- 专卖店
- 超级市场/大卖场
- 其他的
第九章 市场估计与预测:依地区划分,2022-2035年
- 北美洲
- 我们
- 加拿大
- 欧洲
- 德国
- 英国
- 法国
- 西班牙
- 义大利
- 其他欧洲地区
- 亚太地区
- 中国
- 印度
- 日本
- 澳洲
- 韩国
- 亚太其他地区
- 拉丁美洲
- 巴西
- 墨西哥
- 阿根廷
- 其他拉丁美洲地区
- 中东和非洲
- 沙乌地阿拉伯
- 南非
- 阿拉伯聯合大公国
- 其他中东和非洲地区
第十章:公司简介
- Agro Gums
- Ashland Global Holdings Inc.
- Dabur India Ltd.
- Hindustan Gum and Chemicals Limited(HGCL)
- Vikas WSP Limited
- Guar Resources LLC
- India Glycols Limited
- Jai Bharat Gum and Chemicals Ltd.
- Lamberti SpA
- Lucid Group
- Neelkanth Polymers
The Global Guar Complex Market was valued at USD 1.31 billion in 2025 and is estimated to grow at a CAGR of 3.3% to reach USD 1.82 billion by 2035.
The guar complex market encompasses a structured value chain that begins with the cultivation and supply of guar seeds and extends to the processing of derivatives such as guar gum, splits, and powder. The crop is primarily cultivated in semi-arid regions due to its low water requirements and ability to withstand harsh climatic conditions, which supports consistent raw material availability. The guar complex industry plays a vital role across multiple sectors due to its functionality as a natural thickening and binding agent. Guar-derived products are widely recognized for their ability to regulate viscosity, improve stability, and enhance water retention in formulations. These functional benefits support their widespread use across diverse industrial applications. In recent years, advancements in processing technologies have significantly improved product quality and operational efficiency. Manufacturers are increasingly adopting modern milling, purification, and viscosity control techniques to meet application-specific requirements. Automation and enhanced quality monitoring systems are also contributing to reduced waste and improved consistency. Growing emphasis on plant-based and biodegradable materials is further accelerating demand within the guar complex market.
| Market Scope | |
|---|---|
| Start Year | 2025 |
| Forecast Year | 2026-2035 |
| Start Value | $1.31 Billion |
| Forecast Value | $1.82 Billion |
| CAGR | 3.3% |
The guar gum segment accounted for USD 951.6 million in 2025. Its widespread utilization is driven by its strong thickening and stabilizing properties, making it suitable for a variety of applications across multiple industries. Market trends are increasingly focused on achieving consistent product performance, tailored functional attributes, and alignment with clean-label requirements. In addition, guar meals continue to generate demand due to their nutritional profile and cost-effectiveness, supporting their use in feed-related applications. The cultivation and processing of guar crops remain closely linked to the need for reliable downstream products that support consistent supply and application performance across different end-use sectors.
The food segment reached USD 465.9 million in 2025. Demand within this segment is driven by the need for effective texture control, stabilization, and moisture management in product formulations. Manufacturers are increasingly focusing on achieving uniform consistency and reliable processing outcomes. Functional requirements such as viscosity control, structural stability, and resistance to temperature variations are key considerations in product development. Maintaining consistent product characteristics during processing and storage is essential, which continues to support the use of guar-based ingredients. The ability to enhance formulation performance while ensuring stability and uniformity remains a key factor driving adoption across food-related applications.
North America Guar Complex Market is projected to grow from USD 249.4 million in 2025 to USD 319.1 million by 2035, reflecting steady expansion over the forecast period. Growth in the region is supported by sustained demand across food processing, industrial applications, and personal care sectors. Market dynamics are influenced by the need for reliable supply chains, consistent product quality, and technical support. Demand is also shaped by increasing preference for plant-based materials with verified performance standards. In the United States, buyers prioritize products that maintain consistent viscosity, meet defined quality specifications, and ensure timely delivery. Stable sourcing strategies and inventory management practices are contributing to balanced market conditions, while continued demand for processed goods supports overall growth in the guar complex market.
Key companies operating in the Global Guar Complex Market include Agro Gums, Ashland Global Holdings Inc., Dabur India Ltd., Hindustan Gum and Chemicals Limited (HGCL), Vikas WSP Limited, Guar Resources LLC, India Glycols Limited, Jai Bharat Gum and Chemicals Ltd., Lamberti S.p.A., Lucid Group, and Neelkanth Polymers. Companies in the guar complex market are focusing on strengthening their market position through investments in advanced processing technologies and quality enhancement initiatives. Many players are prioritizing product innovation to develop customized solutions that meet specific industry requirements. Strategic collaborations and long-term supply agreements are being used to secure raw material availability and expand market reach. Companies are also improving operational efficiency by adopting automation and advanced quality control systems. In addition, there is a growing emphasis on sustainable practices, including the promotion of plant-based and biodegradable products. Expanding distribution networks and maintaining consistent product standards are further supporting customer retention and long-term growth.
Table of Contents
Chapter 1 Methodology & Scope
- 1.1 Market scope and definition
- 1.2 Research design
- 1.2.1 Research approach
- 1.2.2 Data collection methods
- 1.3 Data mining sources
- 1.3.1 Global
- 1.3.2 Regional/Country
- 1.4 Base estimates and calculations
- 1.4.1 Base year calculation
- 1.4.2 Key trends for market estimation
- 1.5 Primary research and validation
- 1.5.1 Primary sources
- 1.6 Forecast model
- 1.7 Research assumptions and limitations
Chapter 2 Executive Summary
- 2.1 Industry 360° synopsis
- 2.2 Key market trends
- 2.2.1 Type
- 2.2.2 Form
- 2.2.3 Application
- 2.2.4 Distribution Channel
- 2.2.5 Regional
- 2.3 TAM Analysis, 2026-2035
- 2.4 CXO perspectives: Strategic imperatives
- 2.5 Future outlook and strategic recommendations
Chapter 3 Industry Insights
- 3.1 Industry ecosystem analysis
- 3.1.1 Supplier landscape
- 3.1.2 Profit margin
- 3.1.3 Value addition at each stage
- 3.1.4 Factor affecting the value chain
- 3.1.5 Disruptions
- 3.2 Industry impact forces
- 3.2.1 Growth drivers
- 3.2.1.1 Growing demand for natural thickening agents across industries
- 3.2.1.2 Expansion of oilfield applications supporting guar consumption growth
- 3.2.1.3 Increasing preference for plant based functional ingredients
- 3.2.2 Pitfalls/challenge
- 3.2.2.1 Price volatility due to seasonal supply variations frequently
- 3.2.2.2 Limited storage infrastructure impacting raw material quality levels
- 3.2.3 Opportunities
- 3.2.3.1 Growing use in processed food applications worldwide steadily
- 3.2.3.2 Product customization for diverse industrial application requirements needs
- 3.2.1 Growth drivers
- 3.3 Growth potential analysis
- 3.4 Regulatory landscape
- 3.4.1 North America
- 3.4.2 Europe
- 3.4.3 Asia Pacific
- 3.4.4 Latin America
- 3.4.5 Middle East & Africa
- 3.5 Porter's analysis
- 3.6 PESTEL analysis
- 3.7 Technology and innovation landscape
- 3.7.1 Current technological trends
- 3.7.2 Emerging technologies
- 3.8 Price trends
- 3.8.1 By region
- 3.8.2 By type
- 3.9 Future market trends
- 3.10 Technology and innovation landscape
- 3.10.1 Current technological trends
- 3.10.2 Emerging technologies
- 3.11 Patent landscape
- 3.12 Trade statistics (HS code)
- 3.12.1 Major importing countries
- 3.12.2 Major exporting countries
- 3.13 Sustainability and environmental aspects
- 3.13.1 Sustainable practices
- 3.13.2 Waste reduction strategies
- 3.13.3 Energy efficiency in production
- 3.13.4 Eco-friendly initiatives
- 3.14 Carbon footprint consideration
Chapter 4 Competitive Landscape, 2025
- 4.1 Introduction
- 4.2 Company market share analysis
- 4.2.1 By region
- 4.2.1.1 North America
- 4.2.1.2 Europe
- 4.2.1.3 Asia Pacific
- 4.2.1.4 LATAM
- 4.2.1.5 MEA
- 4.2.1 By region
- 4.3 Company matrix analysis
- 4.4 Competitive analysis of major market players
- 4.5 Competitive positioning matrix
- 4.6 Key developments
- 4.6.1 Mergers & acquisitions
- 4.6.2 Partnerships & collaborations
- 4.6.3 New product launches
- 4.6.4 Expansion plans
Chapter 5 Market Estimates and Forecast, By Type, 2022-2035 (USD Million) (Kilo Tons)
- 5.1 Key trends
- 5.2 Guar gum
- 5.3 Guar meal
- 5.4 Guar seeds
Chapter 6 Market Estimates and Forecast, By Form, 2022-2035 (USD Million) (Kilo Tons)
- 6.1 Key trends
- 6.2 Powder
- 6.3 Granules
- 6.4 Liquid
Chapter 7 Market Estimates and Forecast, By Application, 2022-2035 (USD Million) (Kilo Tons)
- 7.1 Key trends
- 7.2 Food Industry
- 7.3 Bakery & Confectionery
- 7.4 Dairy & Frozen Desserts
- 7.5 Sauces & Dressings
- 7.6 Beverages Industry
- 7.7 Others
Chapter 8 Market Estimates and Forecast, By Distribution Channel, 2022-2035 (USD Million) (Kilo Tons)
- 8.1 Key trends
- 8.2 Direct sales
- 8.3 Indirect sales
- 8.4 Online retail
- 8.5 Specialty stores
- 8.6 Supermarkets/hypermarkets
- 8.7 Others
Chapter 9 Market Estimates and Forecast, By Region, 2022-2035 (USD Million) (Kilo Tons)
- 9.1 Key trends
- 9.2 North America
- 9.2.1 U.S.
- 9.2.2 Canada
- 9.3 Europe
- 9.3.1 Germany
- 9.3.2 UK
- 9.3.3 France
- 9.3.4 Spain
- 9.3.5 Italy
- 9.3.6 Rest of Europe
- 9.4 Asia Pacific
- 9.4.1 China
- 9.4.2 India
- 9.4.3 Japan
- 9.4.4 Australia
- 9.4.5 South Korea
- 9.4.6 Rest of Asia Pacific
- 9.5 Latin America
- 9.5.1 Brazil
- 9.5.2 Mexico
- 9.5.3 Argentina
- 9.5.4 Rest of Latin America
- 9.6 Middle East and Africa
- 9.6.1 Saudi Arabia
- 9.6.2 South Africa
- 9.6.3 UAE
- 9.6.4 Rest of Middle East and Africa
Chapter 10 Company Profiles
- 10.1 Agro Gums
- 10.2 Ashland Global Holdings Inc.
- 10.3 Dabur India Ltd.
- 10.4 Hindustan Gum and Chemicals Limited (HGCL)
- 10.5 Vikas WSP Limited
- 10.6 Guar Resources LLC
- 10.7 India Glycols Limited
- 10.8 Jai Bharat Gum and Chemicals Ltd.
- 10.9 Lamberti S.p.A.
- 10.10 Lucid Group
- 10.11 Neelkanth Polymers


