


 |
市场调查报告书
商品编码
2019214
2026 年至 2035 年酿造添加剂的市场机会、成长要素、产业趋势分析与预测。Brewing Additives Market Opportunity, Growth Drivers, Industry Trend Analysis, and Forecast 2026 - 2035 |
||||||
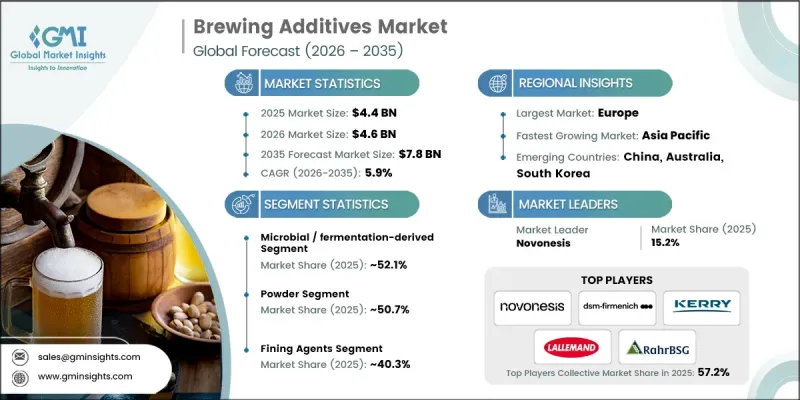
2025年全球酿造添加剂市场价值44亿美元,预计2035年将以5.9%的复合年增长率成长至78亿美元。
消费者对高品质啤酒和葡萄酒的需求日益增长,这些产品口感更佳、澄清度更高、保质期更长,从而推动了这个市场的发展。精酿和高端酒精饮料的日益普及促使生产商优化生产效率并采用创新添加剂来提高产品品质稳定性。消费者强烈偏好天然、永续和洁净标示的原料,这推动了环保酿造解决方案的发展。澄清剂、稳定剂、消泡剂和固色剂酿造添加剂对于改善饮料的澄清度、风味和稳定性至关重要。商业啤酒厂和家庭酿酒师都依赖这些原料来酿造始终如一的高品质饮品。酿造技术的进步以及低酒精和无酒精饮料需求的成长进一步促进了这一成长,从而形成了一个以产品创新为中心的竞争环境。
| 市场范围 | |
|---|---|
| 开始年份 | 2025 |
| 预测期 | 2026-2035 |
| 初始市场规模 | 44亿美元 |
| 预测金额 | 78亿美元 |
| 复合年增长率 | 5.9% |
到2025年,微生物和发酵衍生的配料将占据52.1%的市场。这些天然、永续且用途广泛的添加剂备受青睐,因为它们能够加速发酵、增强风味,并满足消费者对洁净标示产品的需求。随着酿酒商不断追求卓越的发酵性能和风味稳定性,这一领域正推动着产品的持续创新。
预计到 2025 年,澄清剂市占率将达到 40.3%,到 2035 年将以 6.1% 的复合年增长率成长。这些添加剂对于去除不需要的颗粒、蛋白质和多酚,保持饮料的澄清度和稳定性,以及生产外观吸引人、高品质的最终产品至关重要。
预计2026年至2035年,北美酿造添加剂市场将以5.6%的复合年增长率成长。在精酿啤酒和高级啤酒日益增长的推动下,酿酒商正在采用创新添加剂来增强风味、延长保质期并提高产品稳定性。该地区正经历活跃的产品研发,製造商致力于提供独特的味觉体验和现代化的酿造解决方案。
目录
第一章:调查方法和范围
第二章执行摘要
第三章业界考察
- 生态系分析
- 供应商情况
- 利润率
- 每个阶段增加的价值
- 影响价值链的因素
- 中断
- 影响产业的因素
- 促进因素
- 高端和精酿饮品的需求不断增长
- 酿造製程的技术进步
- 家庭酿造和精酿啤酒厂的发展
- 产业潜在风险与挑战
- 原料供应波动
- 市场机会
- 消费者对天然和有机成分的偏好日益增长
- 扩大具有功能性和健康促进作用的酿造添加剂的种类
- 促进因素
- 成长潜力分析
- 监理情势
- 北美洲
- 欧洲
- 亚太地区
- 拉丁美洲
- 中东和非洲
- 波特五力分析
- PESTEL 分析
- 价格趋势
- 按地区
- 按类型
- 未来市场趋势
- 科技与创新趋势
- 当前技术趋势
- 新兴技术
- 专利趋势
- 贸易统计(HS编码)
- 主要进口国
- 主要出口国
- 永续性和环境方面
- 永续倡议
- 减少废弃物策略
- 生产中的能源效率
- 环保意识的倡议
- 考虑碳足迹
第四章 竞争情势
- 介绍
- 企业市占率分析
- 按地区
- 北美洲
- 欧洲
- 亚太地区
- 拉丁美洲
- 中东和非洲
- 按地区
- 主要市场公司的竞争分析
- 竞争定位矩阵
- 主要进展
- 併购
- 伙伴关係与合作
- 新产品发布
- 业务拓展计划
第五章 市场估计与预测:依来源划分,2022-2035年
- 微生物来源/发酵来源
- 植物来源
- 动物源性
- 合成/化学
第六章 市场估计与预测:依类型划分,2022-2035年
- 液体
- 粉末
- 药片
- 凝胶
第七章 市场估计与预测:依类型划分,2022-2035年
- 澄清剂
- 消泡剂
- 稳定器
- 固色剂
- 其他的
第八章 市场估计与预测:依应用领域划分,2022-2035年
- 葡萄酒
- 啤酒
- 其他的
第九章 市场估计与预测:依地区划分,2022-2035年
- 北美洲
- 我们
- 加拿大
- 欧洲
- 德国
- 英国
- 法国
- 西班牙
- 义大利
- 其他欧洲地区
- 亚太地区
- 中国
- 印度
- 日本
- 澳洲
- 韩国
- 亚太其他地区
- 拉丁美洲
- 巴西
- 墨西哥
- 阿根廷
- 其他拉丁美洲地区
- 中东和非洲
- 沙乌地阿拉伯
- 南非
- 阿拉伯聯合大公国
- 其他中东和非洲地区
第十章:公司简介
- AEB Brewing
- Agrovin
- ATPGroup
- DSM-Firmenich
- Enartis Srl
- General Filtration
- Kerry Group
- Lallemand Brewing
- Novonesis
- RahrBSG
- White Labs
The Global Brewing Additives Market was valued at USD 4.4 billion in 2025 and is estimated to grow at a CAGR of 5.9% to reach USD 7.8 billion by 2035.
The market is benefiting from growing consumer demand for high-quality beers and wines that offer superior taste, improved visual clarity, and longer shelf life. The increasing popularity of craft beverages and premium alcoholic drinks is prompting manufacturers to adopt innovative additives that optimize production efficiency and enhance product consistency. Consumers are showing a strong preference for natural, sustainable, and clean-label ingredients, driving the development of eco-friendly brewing solutions. Brewing additives, including fining agents, stabilizers, antifoaming agents, and color enhancers, are critical for improving beverage clarity, flavor, and stability. Both commercial breweries and home brewers rely on these ingredients to deliver consistent, high-quality beverages. The growth is further supported by advancements in brewing technologies and the rising demand for low-alcohol and non-alcoholic options, creating a competitive environment focused on product innovation.
| Market Scope | |
|---|---|
| Start Year | 2025 |
| Forecast Year | 2026-2035 |
| Start Value | $4.4 Billion |
| Forecast Value | $7.8 Billion |
| CAGR | 5.9% |
The microbial and fermentation-derived ingredients segment held a 52.1% share in 2025. These natural, sustainable, and versatile additives are preferred for their ability to enhance fermentation, improve taste, and meet consumer demand for clean-label products. The segment drives ongoing product innovation as brewers seek superior fermentation performance and flavor consistency.
The fining agents segment accounted for 40.3% share in 2025 and is expected to grow at a CAGR of 6.1% through 2035. These additives are essential for maintaining beverage clarity and stability by removing unwanted particles, proteins, and polyphenols, producing visually appealing and high-quality final products.
North America Brewing Additives Market is projected to grow at a CAGR of 5.6% from 2026 to 2035. Rising interest in craft and premium beers is encouraging brewers to adopt innovative additives that enhance flavor, extend shelf life, and improve product stability. The region is seeing active product development as manufacturers focus on delivering unique taste experiences and modern brewing solutions.
Key players in the Global Brewing Additives Market include White Labs, DSM-Firmenich, Novonesis, Lallemand Brewing, RahrBSG, General Filtration, AEB Brewing, Agrovin, Enartis S.r.l., Kerry Group, and ATPGroup. Companies in the brewing additives market are strengthening their presence by investing in research and development to create natural, sustainable, and versatile additives that align with consumer demand for clean-label beverages. Strategic partnerships with breweries and beverage producers help expand market reach, while innovation in flavor, clarity, and stability solutions improves product differentiation. Manufacturers are also focusing on eco-friendly production methods, improving quality control, and offering technical support to enhance customer satisfaction, maintain brand loyalty, and establish a strong foothold in competitive global markets.
Table of Contents
Chapter 1 Methodology & Scope
- 1.1 Market scope and definition
- 1.2 Research design
- 1.2.1 Research approach
- 1.2.2 Data collection methods
- 1.3 Data mining sources
- 1.3.1 Global
- 1.3.2 Regional/Country
- 1.4 Base estimates and calculations
- 1.4.1 Base year calculation
- 1.4.2 Key trends for market estimation
- 1.5 Primary research and validation
- 1.5.1 Primary sources
- 1.6 Forecast model
- 1.7 Research assumptions and limitations
Chapter 2 Executive Summary
- 2.1 Industry 360° synopsis
- 2.2 Key market trends
- 2.2.1 Regional
- 2.2.2 Source
- 2.2.3 Form
- 2.2.4 Type
- 2.2.5 Application
- 2.3 TAM Analysis, 2026-2035
- 2.4 CXO perspectives: Strategic imperatives
Chapter 3 Industry Insights
- 3.1 Industry ecosystem analysis
- 3.1.1 Supplier landscape
- 3.1.2 Profit margin
- 3.1.3 Value addition at each stage
- 3.1.4 Factor affecting the value chain
- 3.1.5 Disruptions
- 3.2 Industry impact forces
- 3.2.1 Growth drivers
- 3.2.1.1 Increasing demand for premium and craft beverages
- 3.2.1.2 Technological advancements in brewing processes
- 3.2.1.3 Growth in home brewing and microbreweries
- 3.2.2 Industry pitfalls and challenges
- 3.2.2.1 Fluctuations in raw material availability
- 3.2.3 Market opportunities
- 3.2.3.1 Increasing consumer preference for natural and organic ingredients
- 3.2.3.2 Expansion of functional and health-enhancing brewing additives
- 3.2.1 Growth drivers
- 3.3 Growth potential analysis
- 3.4 Regulatory landscape
- 3.4.1 North America
- 3.4.2 Europe
- 3.4.3 Asia Pacific
- 3.4.4 Latin America
- 3.4.5 Middle East & Africa
- 3.5 Porter's analysis
- 3.6 PESTEL analysis
- 3.7 Price trends
- 3.7.1 By region
- 3.7.2 By type
- 3.8 Future market trends
- 3.9 Technology and innovation landscape
- 3.9.1 Current technological trends
- 3.9.2 Emerging technologies
- 3.10 Patent Landscape
- 3.11 Trade statistics (HS code)
- 3.11.1 Major importing countries
- 3.11.2 Major exporting countries
- 3.12 Sustainability and environmental aspects
- 3.12.1 Sustainable practices
- 3.12.2 Waste reduction strategies
- 3.12.3 Energy efficiency in production
- 3.12.4 Eco-friendly initiatives
- 3.13 Carbon footprint consideration
Chapter 4 Competitive Landscape, 2025
- 4.1 Introduction
- 4.2 Company market share analysis
- 4.2.1 By region
- 4.2.1.1 North America
- 4.2.1.2 Europe
- 4.2.1.3 Asia Pacific
- 4.2.1.4 LATAM
- 4.2.1.5 MEA
- 4.2.1 By region
- 4.3 Competitive analysis of major market players
- 4.4 Competitive positioning matrix
- 4.5 Key developments
- 4.5.1 Mergers & acquisitions
- 4.5.2 Partnerships & collaborations
- 4.5.3 New Product Launches
- 4.5.4 Expansion Plans
Chapter 5 Market Estimates and Forecast, By Source, 2022-2035 (USD Billion) (Kilo Tons)
- 5.1 Key trends
- 5.2 Microbial / fermentation-derived
- 5.3 Plant-derived
- 5.4 Animal-derived
- 5.5 Synthetic / chemical
Chapter 6 Market Estimates and Forecast, By Form, 2022-2035 (USD Billion) (Kilo Tons)
- 6.1 Key trends
- 6.2 Liquid
- 6.3 Powder
- 6.4 Tablets
- 6.5 Gel
Chapter 7 Market Estimates and Forecast, By Type, 2022-2035 (USD Billion) (Kilo Tons)
- 7.1 Key trends
- 7.2 Fining agents
- 7.3 Antifoaming agents
- 7.4 Stabilizers
- 7.5 Color enhancers
- 7.6 Others
Chapter 8 Market Estimates and Forecast, By Application, 2022-2035 (USD Billion) (Kilo Tons)
- 8.1 Key trends
- 8.2 Wine
- 8.3 Beer
- 8.4 Others
Chapter 9 Market Estimates and Forecast, By Region, 2022-2035 (USD Billion) (Kilo Tons)
- 9.1 Key trends
- 9.2 North America
- 9.2.1 U.S.
- 9.2.2 Canada
- 9.3 Europe
- 9.3.1 Germany
- 9.3.2 UK
- 9.3.3 France
- 9.3.4 Spain
- 9.3.5 Italy
- 9.3.6 Rest of Europe
- 9.4 Asia Pacific
- 9.4.1 China
- 9.4.2 India
- 9.4.3 Japan
- 9.4.4 Australia
- 9.4.5 South Korea
- 9.4.6 Rest of Asia Pacific
- 9.5 Latin America
- 9.5.1 Brazil
- 9.5.2 Mexico
- 9.5.3 Argentina
- 9.5.4 Rest of Latin America
- 9.6 Middle East and Africa
- 9.6.1 Saudi Arabia
- 9.6.2 South Africa
- 9.6.3 UAE
- 9.6.4 Rest of Middle East and Africa
Chapter 10 Company Profiles
- 10.1 AEB Brewing
- 10.2 Agrovin
- 10.3 ATPGroup
- 10.4 DSM-Firmenich
- 10.5 Enartis S.r.l.
- 10.6 General Filtration
- 10.7 Kerry Group
- 10.8 Lallemand Brewing
- 10.9 Novonesis
- 10.10 RahrBSG
- 10.11 White Labs


