


 |
市场调查报告书
商品编码
2019217
工业鼠李醣脂市场机会、成长要素、产业趋势分析及2026-2035年预测Industrial Rhamnolipid Market Opportunity, Growth Drivers, Industry Trend Analysis, and Forecast 2026 - 2035 |
||||||
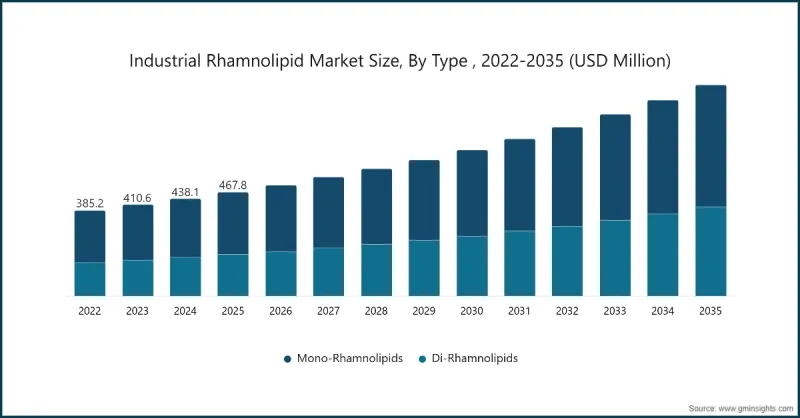
预计到 2025 年,全球工业鼠李醣脂市场价值将达到 4.678 亿美元,年复合成长率为 8.4%,预计到 2035 年将达到 9.505 亿美元。
工业鼠李醣脂最初是作为一种小众的生物基界面活性剂出现,如今已发展成为多个工业领域不可或缺的成分。其功能性应用已扩展至提高製程效率、增强材料相容性以及确保能源生产、工业清洗、农业和环境修復等领域的运作可靠性。工业采购越来越倾向于选择可再生、低毒性、环境永续且性能优异的原料。生物技术、发酵控制、菌株优化和后处理技术的进步提升了鼠李醣脂的性能,使其符合业界标准。其与配方的相容性、生物降解性和低环境持久性加速了其应用,尤其是在法规和永续性要求严格的地区,推动了成熟市场和新兴市场的稳定成长。
| 市场范围 | |
|---|---|
| 开始年份 | 2025 |
| 预测期 | 2026-2035 |
| 上市时的市场规模 | 4.678亿美元 |
| 预测金额 | 9.505亿美元 |
| 复合年增长率 | 8.4% |
单层脂质占60.4%的市场份额,预计到2035年将以7.8%的复合年增长率成长。其广泛应用归功于其优异的界面活性剂性能、溶解性和与配方的相容性。由于单层脂质具有降低表面张力的成本效益,因此广泛应用于清洁、油田化学和环境修復等领域。儘管双层脂质市场规模较小,但由于其卓越的乳化性能、在严苛条件下的稳定性以及长期的功能耐久性,正日益受到关注。
预计到2025年,液态製剂市占率将达到70.6%,并在2026年至2035年间以8.1%的复合年增长率成长。液态鼠李醣脂因其易于操作、即时溶解以及能够无缝整合到油田作业、工业清洗和环境处理等工艺流程中,而备受大规模工业应用的青睐。此外,其适用于连续加工、精确计量和灵活的配方开发等特性,也进一步提升了其在工业领域的普及度。
预计到2025年,北美工业鼠李醣脂市场将占据28.4%的市场份额,在能源生产、工业清洗和环境保护等领域生物基界面活性剂的应用中发挥策略性作用。有利的市场环境、先进的工业基础设施以及对永续解决方案的高接受度,正使该地区成为重要的成长中心。
目录
第一章:调查方法和范围
第二章执行摘要
第三章业界考察
- 生态系分析
- 供应商情况
- 利润率
- 每个阶段增加的价值
- 影响价值链的因素
- 中断
- 影响产业的因素
- 促进因素
- 在石油和天然气产业中扩大用于提高石油采收率(EOR)的应用
- 在化妆品和个人护理行业中不断扩展的应用
- 对环保型和可生物降解界面活性剂的需求日益增长
- 产业潜在风险与挑战
- 高昂的生产成本
- 鼠李醣脂生产所需原料供不应求
- 市场机会
- 在生物修復和环境领域的应用
- 药物和药物传输系统的开发
- 促进因素
- 成长潜力分析
- 监理情势
- 北美洲
- 欧洲
- 亚太地区
- 拉丁美洲
- 中东和非洲
- 波特五力分析
- PESTEL 分析
- 价格趋势
- 按地区
- 按类型
- 未来市场趋势
- 科技与创新趋势
- 当前技术趋势
- 新兴技术
- 专利趋势
- 贸易统计(HS编码)
- 主要进口国
- 主要出口国
- 永续性和环境方面
- 永续倡议
- 减少废弃物策略
- 生产中的能源效率
- 具有环保意识的倡议
- 考虑碳足迹
第四章 竞争情势
- 介绍
- 企业市占率分析
- 按地区
- 北美洲
- 欧洲
- 亚太地区
- 拉丁美洲
- 中东和非洲
- 按地区
- 企业矩阵分析
- 主要市场公司的竞争分析
- 竞争定位矩阵
- 主要进展
- 併购
- 伙伴关係与合作
- 新产品发布
- 业务拓展计划
第五章 市场估计与预测:依类型划分,2022-2035年
- 单醣脂
- 迪拉姆诺脂
第六章 市场估计与预测:依类型划分,2022-2035年
- 液体
- 即用型
- 浓缩型
- 水悬浮液
- 粉末
- 喷雾干燥
- 冷冻干燥
- 大宗工业用途
第七章 市场估计与预测:依等级划分,2022-2035年
- 技术级(85-90%)
- 高纯度等级(90-95%)
- 超高纯度等级(95%以上)
第八章 市场估算与预测:依最终使用者划分,2022-2035年
- 石油和天然气
- 农业
- 製药和医疗保健
- 化妆品和个人护理
- 其他(纺织品、家用和工业清洁剂等)
第九章 市场估计与预测:依地区划分,2022-2035年
- 北美洲
- 我们
- 加拿大
- 欧洲
- 德国
- 英国
- 法国
- 西班牙
- 义大利
- 其他欧洲地区
- 亚太地区
- 中国
- 印度
- 日本
- 澳洲
- 韩国
- 亚太其他地区
- 拉丁美洲
- 巴西
- 墨西哥
- 阿根廷
- 其他拉丁美洲地区
- 中东和非洲
- 沙乌地阿拉伯
- 南非
- 阿拉伯聯合大公国
- 其他中东和非洲地区
第十章:公司简介
- Evonik Industries AG
- Stepan Company
- AGAE Technologies LLC
- Jeneil Biotech Inc
- Biotensidon GmbH
- GlycoSurf
- TensioGreen
- Zhejiang Silver Elephant Bio-engineering Co. Ltd
- Shaanxi Deguan Biotechnology Co. Ltd
- Holiferm Ltd
- CD BioGlyco
The Global Industrial Rhamnolipid Market was valued at USD 467.8 million in 2025 and is estimated to grow at a CAGR of 8.4% to reach USD 950.5 million by 2035.
Industrial rhamnolipids initially emerged as niche bio-based surfactants but have evolved into critical components across multiple industrial sectors. Their functional applications now extend to improving process efficiency, enhancing material compatibility, and ensuring operational reliability in areas such as energy production, industrial cleaning, agriculture, and environmental remediation. Industrial procurement is increasingly favoring inputs that deliver high performance while being renewable, minimally toxic, and environmentally sustainable. Advancements in biotechnology, fermentation control, strain optimization, and downstream processing have elevated rhamnolipid performance to meet industrial standards. The combination of formulation compatibility, biodegradability, and low environmental persistence has accelerated adoption, particularly in regions with stringent regulatory oversight and sustainability mandates, driving steady growth in both established and emerging markets.
| Market Scope | |
|---|---|
| Start Year | 2025 |
| Forecast Year | 2026-2035 |
| Start Value | $467.8 Million |
| Forecast Value | $950.5 Million |
| CAGR | 8.4% |
The mono-rhamnolipids segment held a 60.4% share and is expected to grow at a CAGR of 7.8% through 2035. Their widespread use is attributed to superior surface activity, solubility, and formulation compatibility. Industries leverage mono-rhamnolipids for applications including cleaning, oilfield chemistry, and environmental remediation due to their cost-effective performance in reducing interfacial tension. Di-rhamnolipids, though smaller in market size, are gaining traction for their superior emulsification properties, stability under extreme conditions, and long-term functional durability.
The liquid formulations segment held a 70.6% share in 2025 and is projected to grow at a CAGR of 8.1% from 2026 to 2035. Liquid rhamnolipids are preferred for large-scale industrial applications due to ease of handling, immediate solubility, and seamless integration into processes like oilfield operations, industrial cleaning, and environmental treatment. Their suitability for continuous processing, accurate dosing, and flexible formulation development reinforces their industrial popularity.
North America Industrial Rhamnolipid Market held a 28.4% share in 2025, driven by its strategic role in deploying bio-based surfactants across energy production, industrial cleaning, and environmental protection sectors. Favorable market conditions, advanced industrial infrastructure, and high adoption of sustainable solutions make the region a key growth hub.
Leading players in the Global Industrial Rhamnolipid Market include TensioGreen, GlycoSurf, Evonik Industries AG, Shaanxi Deguan Biotechnology Co. Ltd, Stepan Company, Holiferm Ltd, Biotensidon GmbH, CD BioGlyco, Zhejiang Silver Elephant Bioengineering Co. Ltd, Jeneil Biotech Inc, and AGAE Technologies LLC. Key strategies adopted by companies to strengthen their market presence include investing heavily in R&D to enhance rhamnolipid yield, purity, and functionality. Firms are optimizing fermentation and downstream processing for scalable, cost-effective production. Strategic partnerships with industrial users in energy, agriculture, and environmental remediation are expanding adoption. Companies are focusing on regulatory compliance, sustainable production practices, and eco-label certifications to differentiate their products. Expanding regional manufacturing capabilities and distribution networks ensures faster delivery and localized support. Additionally, marketing initiatives highlighting biodegradability, performance efficiency, and multi-sector versatility help build brand credibility and capture emerging market opportunities worldwide.
Table of Contents
Chapter 1 Methodology & Scope
- 1.1 Market scope and definition
- 1.2 Research design
- 1.2.1 Research approach
- 1.2.2 Data collection methods
- 1.3 Data mining sources
- 1.3.1 Global
- 1.3.2 Regional/Country
- 1.4 Base estimates and calculations
- 1.4.1 Base year calculation
- 1.4.2 Key trends for market estimation
- 1.5 Primary research and validation
- 1.5.1 Primary sources
- 1.6 Forecast model
- 1.7 Research assumptions and limitations
Chapter 2 Executive Summary
- 2.1 Industry 360° synopsis
- 2.2 Key market trends
- 2.2.1 Regional
- 2.2.2 Type
- 2.2.3 Form
- 2.2.4 Grade
- 2.2.5 End-Use
- 2.3 TAM Analysis, 2026-2035
- 2.4 CXO perspectives: Strategic imperatives
- 2.4.1 Executive decision points
- 2.4.2 Critical success factors
- 2.5 Future Outlook and Strategic Recommendations
Chapter 3 Industry Insights
- 3.1 Industry ecosystem analysis
- 3.1.1 Supplier landscape
- 3.1.2 Profit margin
- 3.1.3 Value addition at each stage
- 3.1.4 Factor affecting the value chain
- 3.1.5 Disruptions
- 3.2 Industry impact forces
- 3.2.1 Growth drivers
- 3.2.1.1 Rising use in enhanced oil recovery (EOR) in the oil & gas industry
- 3.2.1.2 Growing applications in cosmetics and personal care industries
- 3.2.1.3 Rising demand for eco friendly & biodegradable surfactants
- 3.2.2 Industry pitfalls and challenges
- 3.2.2.1 High production cost
- 3.2.2.2 Limited availability of raw materials for rhamnolipid production
- 3.2.3 Market opportunities
- 3.2.3.1 Expansion in bioremediation & environmental applications
- 3.2.3.2 Pharmaceutical & drug delivery system development
- 3.2.1 Growth drivers
- 3.3 Growth potential analysis
- 3.4 Regulatory landscape
- 3.4.1 North America
- 3.4.2 Europe
- 3.4.3 Asia Pacific
- 3.4.4 Latin America
- 3.4.5 Middle East & Africa
- 3.5 Porter's analysis
- 3.6 PESTEL analysis
- 3.7 Price trends
- 3.7.1 By region
- 3.7.2 By type
- 3.8 Future market trends
- 3.9 Technology and Innovation landscape
- 3.9.1 Current technological trends
- 3.9.2 Emerging technologies
- 3.10 Patent Landscape
- 3.11 Trade statistics (HS code)
- 3.11.1 Major importing countries
- 3.11.2 Major exporting countries
- 3.12 Sustainability and environmental aspects
- 3.12.1 Sustainable practices
- 3.12.2 Waste reduction strategies
- 3.12.3 Energy efficiency in production
- 3.12.4 Eco-friendly initiatives
- 3.13 Carbon footprint consideration
Chapter 4 Competitive Landscape, 2025
- 4.1 Introduction
- 4.2 Company market share analysis
- 4.2.1 By region
- 4.2.1.1 North America
- 4.2.1.2 Europe
- 4.2.1.3 Asia Pacific
- 4.2.1.4 LATAM
- 4.2.1.5 MEA
- 4.2.1 By region
- 4.3 Company matrix analysis
- 4.4 Competitive analysis of major market players
- 4.5 Competitive positioning matrix
- 4.6 Key developments
- 4.6.1 Mergers & acquisitions
- 4.6.2 Partnerships & collaborations
- 4.6.3 New Product Launches
- 4.6.4 Expansion Plans
Chapter 5 Market Estimates and Forecast, By Type, 2022-2035 (USD Million) (Kilo Tons)
- 5.1 Key trends
- 5.2 Mono-Rhamnolipids
- 5.3 Di-Rhamnolipids
Chapter 6 Market Estimates and Forecast, By Form, 2022-2035 (USD Million) (Kilo Tons)
- 6.1 Key trends
- 6.2 Liquid
- 6.2.1 Ready to Use
- 6.2.2 Concentrated
- 6.2.3 Aqueous Suspensions
- 6.3 Powder
- 6.3.1 Spray Dried
- 6.3.2 Freeze Dried
- 6.3.3 Bulk Industrial
Chapter 7 Market Estimates and Forecast, By Grade, 2022-2035 (USD Million) (Kilo Tons)
- 7.1 Key trends
- 7.2 Technical Grade (85-90%)
- 7.3 High Purity Grade (90-95%)
- 7.4 Ultra-High Purity Grade (>95%)
Chapter 8 Market Estimates and Forecast, By End-User, 2022-2035 (USD Million) (Kilo Tons)
- 8.1 Key trends
- 8.2 Oil & Gas
- 8.3 Agriculture
- 8.4 Pharmaceuticals & Healthcare
- 8.5 Cosmetics & Personal Care
- 8.6 Others (Textiles, Household & Industrial Cleaners, etc)
Chapter 9 Market Estimates and Forecast, By Region, 2022-2035 (USD Million) (Kilo Tons)
- 9.1 Key trends
- 9.2 North America
- 9.2.1 U.S.
- 9.2.2 Canada
- 9.3 Europe
- 9.3.1 Germany
- 9.3.2 UK
- 9.3.3 France
- 9.3.4 Spain
- 9.3.5 Italy
- 9.3.6 Rest of Europe
- 9.4 Asia Pacific
- 9.4.1 China
- 9.4.2 India
- 9.4.3 Japan
- 9.4.4 Australia
- 9.4.5 South Korea
- 9.4.6 Rest of Asia Pacific
- 9.5 Latin America
- 9.5.1 Brazil
- 9.5.2 Mexico
- 9.5.3 Argentina
- 9.5.4 Rest of Latin America
- 9.6 Middle East and Africa
- 9.6.1 Saudi Arabia
- 9.6.2 South Africa
- 9.6.3 UAE
- 9.6.4 Rest of Middle East and Africa
Chapter 10 Company Profiles
- 10.1 Evonik Industries AG
- 10.2 Stepan Company
- 10.3 AGAE Technologies LLC
- 10.4 Jeneil Biotech Inc
- 10.5 Biotensidon GmbH
- 10.6 GlycoSurf
- 10.7 TensioGreen
- 10.8 Zhejiang Silver Elephant Bio-engineering Co. Ltd
- 10.9 Shaanxi Deguan Biotechnology Co. Ltd
- 10.10 Holiferm Ltd
- 10.11 CD BioGlyco
 工业酵素市场:按类型、原料、配方、供应形式、等级、应用和分销管道划分-2026-2032年全球市场预测
 全球工业酵素市场规模、份额、趋势和成长分析报告(2026-2034年)
 2026年全球工业酵素市场报告
 工业酵素市场规模、份额和趋势分析报告:按产品、原材料、应用、地区和细分市场预测(2026-2033 年)
 全球工业酵素市场,2026-2030年工业聚乙烯亚胺市场依形态、分子量、反应等级及应用划分-2026-2032年全球预测
 工业生物树脂市场预测至2032年:按树脂类型、原料、形态、加工方法、应用、最终用户和地区分類的全球分析
 日本工业酵素市场报告(按产品、来源、应用和地区划分,2026-2034年)
 工业酵素市场规模、份额和成长分析(按酵素类型、配方、来源、应用和地区划分)-2026-2033年产业预测
 产业用酵素的全球市场(2026年~2036年)