


 |
市场调查报告书
商品编码
1413863
汽车智慧轮胎市场:按类型、工程技术、分销管道、车辆类型划分 - 2024-2030 年全球预测Automotive Smart Tire Market by Type (RFID-Tagged Tires, Self-Inflating Tires, Sensors-Embedded Tires), Engineering Technology (Non-pneumatic Tire, Pneumatic Tire), Distribution Channel, Vehicle Type - Global Forecast 2024-2030 |
||||||
※ 本网页内容可能与最新版本有所差异。详细情况请与我们联繫。
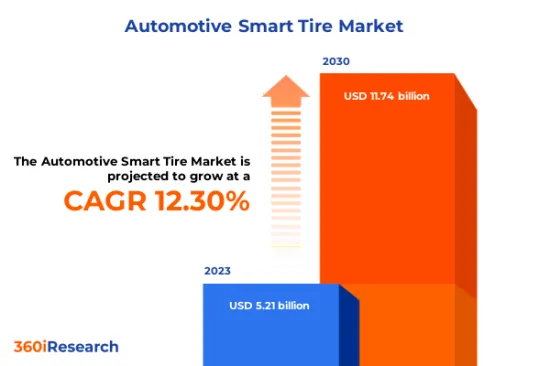
预计2023年汽车智慧轮胎市场规模为52.1亿美元,预计2024年将达58.2亿美元,2030年将达到117.4亿美元,复合年增长率为12.30%。
全球汽车智慧轮胎市场
| 主要市场统计 | |
|---|---|
| 基准年[2023] | 52.1亿美元 |
| 预测年份 [2024] | 58.2亿美元 |
| 预测年份 [2030] | 117.4亿美元 |
| 复合年增长率(%) | 12.3% |
汽车智慧轮胎,也称为智慧型轮胎,代表了汽车产业的技术进步,它将感测器、人工智慧和先进的资料分析整合到轮胎的构造中。这项创新旨在提供轮胎压力、温度、负载、磨损和路况等各种参数的即时资讯。从这些感测器收集的资料用于提高车辆安全性、提高驾驶性能、优化维护并提高轮胎的整体使用效率。汽车智慧轮胎市场是一个充满活力的领域,专注于智慧型轮胎系统的部署,为更广泛的联网汽车生态系统做出贡献,并促进更安全、更智慧型的驾驶体验。推动该市场成长的是更严格的安全要求、增加的排放量以及物联网和远端资讯处理方面的突破,从而实现与车辆系统的更深入整合。然而,感测器技术的高成本以及复杂的製造和维修过程正在抑制因素市场的成长。主要在经济高效的感测器技术和轮胎设计方面的创新代表了汽车智慧轮胎市场未来的稳健成长。
区域洞察
在北美和南美,由于严格的政府法规以及对安全和燃油效率的重视,汽车智慧轮胎市场正在显着成长。北美是主要汽车製造商和高科技公司的所在地,这些公司大力投资于与车辆安全和连接解决方案相关的创新和研发活动,为该地区的市场成长做出了重大贡献。 EMEA(欧洲、中东和非洲)地区的汽车智慧轮胎市场呈现出良好的发展轨迹,这主要得益于欧洲汽车工业的开拓。包括车辆自动化和连接系统在内的先进技术的高采用率正在促进市场成长。此外,欧盟严格的车辆排放气体法规鼓励使用智慧轮胎,因为它们具有提高燃油效率的潜力。中东和非洲虽然该细分市场仍不发达,但由于汽车产业的扩张和基础设施的发展,预计将提供潜在的成长机会。亚太地区(APAC)的汽车智慧轮胎市场正在快速成长,这主要是由中国和印度等国家蓬勃发展的汽车产业所推动的。此外,对配备最新技术(包括智慧轮胎)的豪华汽车的需求不断增长,预计将推动亚太地区的市场成长。
FPNV定位矩阵
FPNV定位矩阵对于评估汽车智慧轮胎市场至关重要。我们检视与业务策略和产品满意度相关的关键指标,以对供应商进行全面评估。这种深入的分析使用户能够根据自己的要求做出明智的决策。根据评估,供应商被分为四个成功程度不同的像限:前沿(F)、探路者(P)、利基(N)和重要(V)。
市场占有率分析
市场占有率分析是一种综合工具,可以对汽车智慧轮胎市场供应商的现状进行深入而深入的研究。全面比较和分析供应商在整体收益、基本客群和其他关键指标方面的贡献,以便更好地了解公司的绩效及其在争夺市场占有率时面临的挑战。此外,该分析还提供了对该行业竞争特征的宝贵考察,包括在研究基准年观察到的累积、分散主导地位和合併特征等因素。这种详细程度的提高使供应商能够做出更明智的决策并制定有效的策略,从而在市场上获得竞争优势。
本报告在以下方面提供了宝贵的见解:
1-市场渗透率:提供有关主要企业所服务的市场的全面资讯。
2-市场开拓:我们深入研究利润丰厚的新兴市场,并分析它们在成熟细分市场中的渗透率。
3- 市场多元化:提供有关新产品发布、开拓地区、最新发展和投资的详细资讯。
4-竞争力评估与资讯:对主要企业的市场占有率、策略、产品、认证、监管状况、专利状况、製造能力等进行全面评估。
5- 产品开发与创新:提供对未来技术、研发活动和突破性产品开发的见解。
本报告解决了以下关键问题:
1-汽车智慧轮胎市场规模及预测是多少?
2-在汽车智慧轮胎市场预测期内,有哪些产品、细分市场、应用和领域需要考虑投资?
3-汽车智慧轮胎市场的技术趋势和法律规范是什么?
4-汽车智慧轮胎市场主要供应商的市场占有率是多少?
5-进入汽车智慧轮胎市场的合适型态和策略手段是什么?
目录
第一章 前言
第二章调查方法
第三章执行摘要
第四章市场概况
第五章市场洞察
- 市场动态
- 促进因素
- 随着人们对安全驾驶的日益关注,监控轮胎与路面之间的摩擦力的需求也越来越大。
- 智慧轮胎越来越受欢迎以减少车辆排放气体
- 车队管理和远端主动维护的重要性日益增加
- 抑制因素
- 与智慧轮胎製造相关的原料成本波动
- 机会
- 智慧轮胎设计、功能与製造的进步
- 世界各地越来越多地推出联网汽车和自动驾驶汽车
- 任务
- 智慧轮胎的复杂製造和修復
- 促进因素
- 市场区隔分析
- 类型:对内建感测器的轮胎的需求不断增加,这些感测器可提供全面的资料和主动调整的可能性
- 工程技术:更多地采用非充气轮胎,以消除刺穿风险和维护麻烦
- 分销管道:更偏好规模更大、产品更多样化、更容易取得的售后销售
- 车型:商用车智慧轮胎在不同天气条件下的大优势以及低滚动阻力
- 市场趋势分析
- 高通膨的累积效应
- 波特五力分析
- 价值炼和关键路径分析
- 法律规范
第六章汽车智慧轮胎市场:依类型
- 带有 RFID 标籤的轮胎
- 自充气轮胎
- 内建感应器的轮胎
第七章依工程技术分類的汽车智慧轮胎市场
- 非充气轮胎
- 充气轮胎
第八章汽车智慧轮胎市场:依通路划分
- 售后市场
- OEM
第九章汽车智慧轮胎市场:依车型分类
- 商用车
- 小客车
第十章美洲汽车智慧轮胎市场
- 阿根廷
- 巴西
- 加拿大
- 墨西哥
- 美国
第十一章亚太地区汽车智慧轮胎市场
- 澳洲
- 中国
- 印度
- 印尼
- 日本
- 马来西亚
- 菲律宾
- 新加坡
- 韩国
- 台湾
- 泰国
- 越南
第十二章 欧洲、中东和非洲汽车智慧轮胎市场
- 丹麦
- 埃及
- 芬兰
- 法国
- 德国
- 以色列
- 义大利
- 荷兰
- 奈及利亚
- 挪威
- 波兰
- 卡达
- 俄罗斯
- 沙乌地阿拉伯
- 南非
- 西班牙
- 瑞典
- 瑞士
- 土耳其
- 阿拉伯聯合大公国
- 英国
第十三章竞争形势
- FPNV定位矩阵
- 市场占有率分析:主要企业
- 主要企业竞争情境分析
- 新产品发布和功能增强
第14章竞争产品组合
- 主要公司简介
- Bridgestone Corporation
- CEAT Ltd
- Continental AG
- DENSO Corporation
- Giti Tire Pte Ltd.
- Goodyear Tire and Rubber Co.
- Hamaton Ltd
- Hankook Tire & Technology Co., Ltd.
- Infineon Technologies AG
- JK Tyre & Industries
- Kumho Tire
- Melexis
- Michelin Group
- Nokian Tyres PLC
- NXP Semiconductors NV
- Panasonic Holdings Corporation
- Pirelli & CSpA
- Revvo Technologies
- Sensata Technologies
- SIT by CODA DEVELOPMENT sro
- Sumitomo Rubber Industries Ltd.
- The SMART Tire Company
- TireCheck
- Toyo Tire Corporation
- Tymtix Technologies Pvt. Ltd.
- ZF Friedrichshafen AG
- Zhongce Rubber Group Co., Ltd.
- 主要产品系列
第十五章附录
- 讨论指南
- 关于许可证和定价
[190 Pages Report] The Automotive Smart Tire Market size was estimated at USD 5.21 billion in 2023 and expected to reach USD 5.82 billion in 2024, at a CAGR 12.30% to reach USD 11.74 billion by 2030.
Global Automotive Smart Tire Market
| KEY MARKET STATISTICS | |
|---|---|
| Base Year [2023] | USD 5.21 billion |
| Estimated Year [2024] | USD 5.82 billion |
| Forecast Year [2030] | USD 11.74 billion |
| CAGR (%) | 12.3% |
An automotive smart tire, also known as an intelligent tire, represents a technological advancement within the automotive industry that integrates sensors, artificial intelligence, and advanced data analytics within the tire's structure. This innovation is designed to provide real-time information on various parameters such as tire pressure, temperature, load, wear, and road conditions. The data collected from these sensors is used to improve vehicle safety, enhance driving performance, optimize maintenance, and increase the overall efficiency of tire usage. The automotive smart tire market signifies a dynamic sector focusing on the infusion of intelligent tire systems, which contribute to the broader ecosystem of connected vehicles, promoting a safer and more intelligent driving experience. The growth of this market is propelled by stringent safety mandates, a push for reduced emissions, and breakthroughs in IoT and telematics, enabling deeper integration with vehicle systems. However, the high cost of sensor technology and complex manufacturing and repair processes act as restraining factors for the market growth. Innovations, primarily in cost-efficient sensor technologies and tire designs, represent robust future growth for the automotive smart tire market.
Regional Insights
In the Americas, the market for automotive smart tires is observing substantial growth, propelled by a heightened focus on safety features and fuel efficiency, given the stringent government regulations. North America is a significant contributor to this region's market expansion, with the presence of major automotive manufacturers and tech companies that invest heavily in innovation and R&D activities related to vehicle safety and connectivity solutions. The EMEA region shows a promising trajectory in the automotive smart tire market, primarily driven by developments in the European automotive industry. The high rate of adoption of advanced technologies, including vehicle automation and connectivity systems, contributes to the market growth. Furthermore, stringent EU regulations on vehicle emissions bolster the use of smart tires due to their potential to improve fuel economy. The Middle East and Africa, while still developing in this market sector, are expected to offer potential growth opportunities owing to the expanding automotive sector and infrastructural developments. APAC is experiencing rapid growth in the automotive smart tire market, largely fueled by the burgeoning automotive industry in countries including China and India. Moreover, the rising demand for luxury vehicles equipped with the latest technologies, including smart tires, is anticipated to drive market growth in the Asia Pacific region.
FPNV Positioning Matrix
The FPNV Positioning Matrix is pivotal in evaluating the Automotive Smart Tire Market. It offers a comprehensive assessment of vendors, examining key metrics related to Business Strategy and Product Satisfaction. This in-depth analysis empowers users to make well-informed decisions aligned with their requirements. Based on the evaluation, the vendors are then categorized into four distinct quadrants representing varying levels of success: Forefront (F), Pathfinder (P), Niche (N), or Vital (V).
Market Share Analysis
The Market Share Analysis is a comprehensive tool that provides an insightful and in-depth examination of the current state of vendors in the Automotive Smart Tire Market. By meticulously comparing and analyzing vendor contributions in terms of overall revenue, customer base, and other key metrics, we can offer companies a greater understanding of their performance and the challenges they face when competing for market share. Additionally, this analysis provides valuable insights into the competitive nature of the sector, including factors such as accumulation, fragmentation dominance, and amalgamation traits observed over the base year period studied. With this expanded level of detail, vendors can make more informed decisions and devise effective strategies to gain a competitive edge in the market.
Key Company Profiles
The report delves into recent significant developments in the Automotive Smart Tire Market, highlighting leading vendors and their innovative profiles. These include Bridgestone Corporation, CEAT Ltd, Continental AG, DENSO Corporation, Giti Tire Pte Ltd., Goodyear Tire and Rubber Co., Hamaton Ltd, Hankook Tire & Technology Co., Ltd., Infineon Technologies AG, JK Tyre & Industries, Kumho Tire, Melexis, Michelin Group, Nokian Tyres PLC, NXP Semiconductors N.V., Panasonic Holdings Corporation, Pirelli & C. S.p.A., Revvo Technologies, Sensata Technologies, SIT by CODA DEVELOPMENT s.r.o., Sumitomo Rubber Industries Ltd., The SMART Tire Company, TireCheck, Toyo Tire Corporation, Tymtix Technologies Pvt. Ltd., ZF Friedrichshafen AG, and Zhongce Rubber Group Co., Ltd..
Market Segmentation & Coverage
This research report categorizes the Automotive Smart Tire Market to forecast the revenues and analyze trends in each of the following sub-markets:
- Type
- RFID-Tagged Tires
- Self-Inflating Tires
- Sensors-Embedded Tires
- Engineering Technology
- Non-pneumatic Tire
- Pneumatic Tire
- Distribution Channel
- Aftermarket
- OEMs
- Vehicle Type
- Commercial Vehicles
- Passenger Cars
- Region
- Americas
- Argentina
- Brazil
- Canada
- Mexico
- United States
- California
- Florida
- Illinois
- New York
- Ohio
- Pennsylvania
- Texas
- Asia-Pacific
- Australia
- China
- India
- Indonesia
- Japan
- Malaysia
- Philippines
- Singapore
- South Korea
- Taiwan
- Thailand
- Vietnam
- Europe, Middle East & Africa
- Denmark
- Egypt
- Finland
- France
- Germany
- Israel
- Italy
- Netherlands
- Nigeria
- Norway
- Poland
- Qatar
- Russia
- Saudi Arabia
- South Africa
- Spain
- Sweden
- Switzerland
- Turkey
- United Arab Emirates
- United Kingdom
- Americas
The report offers valuable insights on the following aspects:
1. Market Penetration: It presents comprehensive information on the market provided by key players.
2. Market Development: It delves deep into lucrative emerging markets and analyzes the penetration across mature market segments.
3. Market Diversification: It provides detailed information on new product launches, untapped geographic regions, recent developments, and investments.
4. Competitive Assessment & Intelligence: It conducts an exhaustive assessment of market shares, strategies, products, certifications, regulatory approvals, patent landscape, and manufacturing capabilities of the leading players.
5. Product Development & Innovation: It offers intelligent insights on future technologies, R&D activities, and breakthrough product developments.
The report addresses key questions such as:
1. What is the market size and forecast of the Automotive Smart Tire Market?
2. Which products, segments, applications, and areas should one consider investing in over the forecast period in the Automotive Smart Tire Market?
3. What are the technology trends and regulatory frameworks in the Automotive Smart Tire Market?
4. What is the market share of the leading vendors in the Automotive Smart Tire Market?
5. Which modes and strategic moves are suitable for entering the Automotive Smart Tire Market?
Table of Contents
1. Preface
- 1.1. Objectives of the Study
- 1.2. Market Segmentation & Coverage
- 1.3. Years Considered for the Study
- 1.4. Currency & Pricing
- 1.5. Language
- 1.6. Limitations
- 1.7. Assumptions
- 1.8. Stakeholders
2. Research Methodology
- 2.1. Define: Research Objective
- 2.2. Determine: Research Design
- 2.3. Prepare: Research Instrument
- 2.4. Collect: Data Source
- 2.5. Analyze: Data Interpretation
- 2.6. Formulate: Data Verification
- 2.7. Publish: Research Report
- 2.8. Repeat: Report Update
3. Executive Summary
4. Market Overview
- 4.1. Introduction
- 4.2. Automotive Smart Tire Market, by Region
5. Market Insights
- 5.1. Market Dynamics
- 5.1.1. Drivers
- 5.1.1.1. Increasing focus on safe driving and need to monitor tire-road friction
- 5.1.1.2. Expanding popularity of smart tires to reduce vehicle emissions
- 5.1.1.3. Rising emphasis on fleet management with remote proactive maintenance
- 5.1.2. Restraints
- 5.1.2.1. Fluctuating costs of raw materials associated with smart tire manufacturing
- 5.1.3. Opportunities
- 5.1.3.1. Advancements in the design, function, and production of smart tires
- 5.1.3.2. Emerging adoption of connected and self-driving cars worldwide
- 5.1.4. Challenges
- 5.1.4.1. Complex manufacturing and repair of smart tires
- 5.1.1. Drivers
- 5.2. Market Segmentation Analysis
- 5.2.1. Type: Growing demand for sensors-embedded tires providing comprehensive data and the potential for proactive adjustments
- 5.2.2. Engineering Technology: Higher adoption of non-pneumatic tires to eliminate the risk of punctures and maintenance efforts
- 5.2.3. Distribution Channel: High preferences for aftermarket sales with a larger, diverse, and accessible offerings
- 5.2.4. Vehicle Type: Significant benefits of smart tires for commercial vehicles in different weather conditions and low rolling resistance
- 5.3. Market Trend Analysis
- 5.4. Cumulative Impact of High Inflation
- 5.5. Porter's Five Forces Analysis
- 5.5.1. Threat of New Entrants
- 5.5.2. Threat of Substitutes
- 5.5.3. Bargaining Power of Customers
- 5.5.4. Bargaining Power of Suppliers
- 5.5.5. Industry Rivalry
- 5.6. Value Chain & Critical Path Analysis
- 5.7. Regulatory Framework
6. Automotive Smart Tire Market, by Type
- 6.1. Introduction
- 6.2. RFID-Tagged Tires
- 6.3. Self-Inflating Tires
- 6.4. Sensors-Embedded Tires
7. Automotive Smart Tire Market, by Engineering Technology
- 7.1. Introduction
- 7.2. Non-pneumatic Tire
- 7.3. Pneumatic Tire
8. Automotive Smart Tire Market, by Distribution Channel
- 8.1. Introduction
- 8.2. Aftermarket
- 8.3. OEMs
9. Automotive Smart Tire Market, by Vehicle Type
- 9.1. Introduction
- 9.2. Commercial Vehicles
- 9.3. Passenger Cars
10. Americas Automotive Smart Tire Market
- 10.1. Introduction
- 10.2. Argentina
- 10.3. Brazil
- 10.4. Canada
- 10.5. Mexico
- 10.6. United States
11. Asia-Pacific Automotive Smart Tire Market
- 11.1. Introduction
- 11.2. Australia
- 11.3. China
- 11.4. India
- 11.5. Indonesia
- 11.6. Japan
- 11.7. Malaysia
- 11.8. Philippines
- 11.9. Singapore
- 11.10. South Korea
- 11.11. Taiwan
- 11.12. Thailand
- 11.13. Vietnam
12. Europe, Middle East & Africa Automotive Smart Tire Market
- 12.1. Introduction
- 12.2. Denmark
- 12.3. Egypt
- 12.4. Finland
- 12.5. France
- 12.6. Germany
- 12.7. Israel
- 12.8. Italy
- 12.9. Netherlands
- 12.10. Nigeria
- 12.11. Norway
- 12.12. Poland
- 12.13. Qatar
- 12.14. Russia
- 12.15. Saudi Arabia
- 12.16. South Africa
- 12.17. Spain
- 12.18. Sweden
- 12.19. Switzerland
- 12.20. Turkey
- 12.21. United Arab Emirates
- 12.22. United Kingdom
13. Competitive Landscape
- 13.1. FPNV Positioning Matrix
- 13.2. Market Share Analysis, By Key Player
- 13.3. Competitive Scenario Analysis, By Key Player
- 13.3.1. New Product Launch & Enhancement
- 13.3.1.1. Infineon Presents Xensiv Tire Pressure Sensor with Intelligent Features for Tire Pressure Monitoring Systems
- 13.3.1.2. Continental Tires India to Launch 'Intelligent Tyres'
- 13.3.1.3. JK Tyre to Introduce Sensor-Based Smart Tyres for Trucks
- 13.3.1. New Product Launch & Enhancement
14. Competitive Portfolio
- 14.1. Key Company Profiles
- 14.1.1. Bridgestone Corporation
- 14.1.2. CEAT Ltd
- 14.1.3. Continental AG
- 14.1.4. DENSO Corporation
- 14.1.5. Giti Tire Pte Ltd.
- 14.1.6. Goodyear Tire and Rubber Co.
- 14.1.7. Hamaton Ltd
- 14.1.8. Hankook Tire & Technology Co., Ltd.
- 14.1.9. Infineon Technologies AG
- 14.1.10. JK Tyre & Industries
- 14.1.11. Kumho Tire
- 14.1.12. Melexis
- 14.1.13. Michelin Group
- 14.1.14. Nokian Tyres PLC
- 14.1.15. NXP Semiconductors N.V.
- 14.1.16. Panasonic Holdings Corporation
- 14.1.17. Pirelli & C. S.p.A.
- 14.1.18. Revvo Technologies
- 14.1.19. Sensata Technologies
- 14.1.20. SIT by CODA DEVELOPMENT s.r.o.
- 14.1.21. Sumitomo Rubber Industries Ltd.
- 14.1.22. The SMART Tire Company
- 14.1.23. TireCheck
- 14.1.24. Toyo Tire Corporation
- 14.1.25. Tymtix Technologies Pvt. Ltd.
- 14.1.26. ZF Friedrichshafen AG
- 14.1.27. Zhongce Rubber Group Co., Ltd.
- 14.2. Key Product Portfolio
15. Appendix
- 15.1. Discussion Guide
- 15.2. License & Pricing
LIST OF FIGURES
- FIGURE 1. AUTOMOTIVE SMART TIRE MARKET RESEARCH PROCESS
- FIGURE 2. AUTOMOTIVE SMART TIRE MARKET SIZE, 2023 VS 2030
- FIGURE 3. AUTOMOTIVE SMART TIRE MARKET SIZE, 2018-2030 (USD MILLION)
- FIGURE 4. AUTOMOTIVE SMART TIRE MARKET SIZE, BY REGION, 2023 VS 2030 (%)
- FIGURE 5. AUTOMOTIVE SMART TIRE MARKET SIZE, BY REGION, 2023 VS 2024 VS 2030 (USD MILLION)
- FIGURE 6. AUTOMOTIVE SMART TIRE MARKET DYNAMICS
- FIGURE 7. AUTOMOTIVE SMART TIRE MARKET SIZE, BY TYPE, 2023 VS 2030 (%)
- FIGURE 8. AUTOMOTIVE SMART TIRE MARKET SIZE, BY TYPE, 2023 VS 2024 VS 2030 (USD MILLION)
- FIGURE 9. AUTOMOTIVE SMART TIRE MARKET SIZE, BY ENGINEERING TECHNOLOGY, 2023 VS 2030 (%)
- FIGURE 10. AUTOMOTIVE SMART TIRE MARKET SIZE, BY ENGINEERING TECHNOLOGY, 2023 VS 2024 VS 2030 (USD MILLION)
- FIGURE 11. AUTOMOTIVE SMART TIRE MARKET SIZE, BY DISTRIBUTION CHANNEL, 2023 VS 2030 (%)
- FIGURE 12. AUTOMOTIVE SMART TIRE MARKET SIZE, BY DISTRIBUTION CHANNEL, 2023 VS 2024 VS 2030 (USD MILLION)
- FIGURE 13. AUTOMOTIVE SMART TIRE MARKET SIZE, BY VEHICLE TYPE, 2023 VS 2030 (%)
- FIGURE 14. AUTOMOTIVE SMART TIRE MARKET SIZE, BY VEHICLE TYPE, 2023 VS 2024 VS 2030 (USD MILLION)
- FIGURE 15. AMERICAS AUTOMOTIVE SMART TIRE MARKET SIZE, BY COUNTRY, 2023 VS 2030 (%)
- FIGURE 16. AMERICAS AUTOMOTIVE SMART TIRE MARKET SIZE, BY COUNTRY, 2023 VS 2024 VS 2030 (USD MILLION)
- FIGURE 17. UNITED STATES AUTOMOTIVE SMART TIRE MARKET SIZE, BY STATE, 2023 VS 2030 (%)
- FIGURE 18. UNITED STATES AUTOMOTIVE SMART TIRE MARKET SIZE, BY STATE, 2023 VS 2024 VS 2030 (USD MILLION)
- FIGURE 19. ASIA-PACIFIC AUTOMOTIVE SMART TIRE MARKET SIZE, BY COUNTRY, 2023 VS 2030 (%)
- FIGURE 20. ASIA-PACIFIC AUTOMOTIVE SMART TIRE MARKET SIZE, BY COUNTRY, 2023 VS 2024 VS 2030 (USD MILLION)
- FIGURE 21. EUROPE, MIDDLE EAST & AFRICA AUTOMOTIVE SMART TIRE MARKET SIZE, BY COUNTRY, 2023 VS 2030 (%)
- FIGURE 22. EUROPE, MIDDLE EAST & AFRICA AUTOMOTIVE SMART TIRE MARKET SIZE, BY COUNTRY, 2023 VS 2024 VS 2030 (USD MILLION)
- FIGURE 23. AUTOMOTIVE SMART TIRE MARKET, FPNV POSITIONING MATRIX, 2023
- FIGURE 24. AUTOMOTIVE SMART TIRE MARKET SHARE, BY KEY PLAYER, 2023
LIST OF TABLES
- TABLE 1. AUTOMOTIVE SMART TIRE MARKET SEGMENTATION & COVERAGE
- TABLE 2. UNITED STATES DOLLAR EXCHANGE RATE, 2018-2023
- TABLE 3. AUTOMOTIVE SMART TIRE MARKET SIZE, 2018-2030 (USD MILLION)
- TABLE 4. GLOBAL AUTOMOTIVE SMART TIRE MARKET SIZE, BY REGION, 2018-2030 (USD MILLION)
- TABLE 5. AUTOMOTIVE SMART TIRE MARKET SIZE, BY TYPE, 2018-2030 (USD MILLION)
- TABLE 6. AUTOMOTIVE SMART TIRE MARKET SIZE, BY RFID-TAGGED TIRES, BY REGION, 2018-2030 (USD MILLION)
- TABLE 7. AUTOMOTIVE SMART TIRE MARKET SIZE, BY SELF-INFLATING TIRES, BY REGION, 2018-2030 (USD MILLION)
- TABLE 8. AUTOMOTIVE SMART TIRE MARKET SIZE, BY SENSORS-EMBEDDED TIRES, BY REGION, 2018-2030 (USD MILLION)
- TABLE 9. AUTOMOTIVE SMART TIRE MARKET SIZE, BY ENGINEERING TECHNOLOGY, 2018-2030 (USD MILLION)
- TABLE 10. AUTOMOTIVE SMART TIRE MARKET SIZE, BY NON-PNEUMATIC TIRE, BY REGION, 2018-2030 (USD MILLION)
- TABLE 11. AUTOMOTIVE SMART TIRE MARKET SIZE, BY PNEUMATIC TIRE, BY REGION, 2018-2030 (USD MILLION)
- TABLE 12. AUTOMOTIVE SMART TIRE MARKET SIZE, BY DISTRIBUTION CHANNEL, 2018-2030 (USD MILLION)
- TABLE 13. AUTOMOTIVE SMART TIRE MARKET SIZE, BY AFTERMARKET, BY REGION, 2018-2030 (USD MILLION)
- TABLE 14. AUTOMOTIVE SMART TIRE MARKET SIZE, BY OEMS, BY REGION, 2018-2030 (USD MILLION)
- TABLE 15. AUTOMOTIVE SMART TIRE MARKET SIZE, BY VEHICLE TYPE, 2018-2030 (USD MILLION)
- TABLE 16. AUTOMOTIVE SMART TIRE MARKET SIZE, BY COMMERCIAL VEHICLES, BY REGION, 2018-2030 (USD MILLION)
- TABLE 17. AUTOMOTIVE SMART TIRE MARKET SIZE, BY PASSENGER CARS, BY REGION, 2018-2030 (USD MILLION)
- TABLE 18. AMERICAS AUTOMOTIVE SMART TIRE MARKET SIZE, BY TYPE, 2018-2030 (USD MILLION)
- TABLE 19. AMERICAS AUTOMOTIVE SMART TIRE MARKET SIZE, BY ENGINEERING TECHNOLOGY, 2018-2030 (USD MILLION)
- TABLE 20. AMERICAS AUTOMOTIVE SMART TIRE MARKET SIZE, BY DISTRIBUTION CHANNEL, 2018-2030 (USD MILLION)
- TABLE 21. AMERICAS AUTOMOTIVE SMART TIRE MARKET SIZE, BY VEHICLE TYPE, 2018-2030 (USD MILLION)
- TABLE 22. AMERICAS AUTOMOTIVE SMART TIRE MARKET SIZE, BY COUNTRY, 2018-2030 (USD MILLION)
- TABLE 23. ARGENTINA AUTOMOTIVE SMART TIRE MARKET SIZE, BY TYPE, 2018-2030 (USD MILLION)
- TABLE 24. ARGENTINA AUTOMOTIVE SMART TIRE MARKET SIZE, BY ENGINEERING TECHNOLOGY, 2018-2030 (USD MILLION)
- TABLE 25. ARGENTINA AUTOMOTIVE SMART TIRE MARKET SIZE, BY DISTRIBUTION CHANNEL, 2018-2030 (USD MILLION)
- TABLE 26. ARGENTINA AUTOMOTIVE SMART TIRE MARKET SIZE, BY VEHICLE TYPE, 2018-2030 (USD MILLION)
- TABLE 27. BRAZIL AUTOMOTIVE SMART TIRE MARKET SIZE, BY TYPE, 2018-2030 (USD MILLION)
- TABLE 28. BRAZIL AUTOMOTIVE SMART TIRE MARKET SIZE, BY ENGINEERING TECHNOLOGY, 2018-2030 (USD MILLION)
- TABLE 29. BRAZIL AUTOMOTIVE SMART TIRE MARKET SIZE, BY DISTRIBUTION CHANNEL, 2018-2030 (USD MILLION)
- TABLE 30. BRAZIL AUTOMOTIVE SMART TIRE MARKET SIZE, BY VEHICLE TYPE, 2018-2030 (USD MILLION)
- TABLE 31. CANADA AUTOMOTIVE SMART TIRE MARKET SIZE, BY TYPE, 2018-2030 (USD MILLION)
- TABLE 32. CANADA AUTOMOTIVE SMART TIRE MARKET SIZE, BY ENGINEERING TECHNOLOGY, 2018-2030 (USD MILLION)
- TABLE 33. CANADA AUTOMOTIVE SMART TIRE MARKET SIZE, BY DISTRIBUTION CHANNEL, 2018-2030 (USD MILLION)
- TABLE 34. CANADA AUTOMOTIVE SMART TIRE MARKET SIZE, BY VEHICLE TYPE, 2018-2030 (USD MILLION)
- TABLE 35. MEXICO AUTOMOTIVE SMART TIRE MARKET SIZE, BY TYPE, 2018-2030 (USD MILLION)
- TABLE 36. MEXICO AUTOMOTIVE SMART TIRE MARKET SIZE, BY ENGINEERING TECHNOLOGY, 2018-2030 (USD MILLION)
- TABLE 37. MEXICO AUTOMOTIVE SMART TIRE MARKET SIZE, BY DISTRIBUTION CHANNEL, 2018-2030 (USD MILLION)
- TABLE 38. MEXICO AUTOMOTIVE SMART TIRE MARKET SIZE, BY VEHICLE TYPE, 2018-2030 (USD MILLION)
- TABLE 39. UNITED STATES AUTOMOTIVE SMART TIRE MARKET SIZE, BY TYPE, 2018-2030 (USD MILLION)
- TABLE 40. UNITED STATES AUTOMOTIVE SMART TIRE MARKET SIZE, BY ENGINEERING TECHNOLOGY, 2018-2030 (USD MILLION)
- TABLE 41. UNITED STATES AUTOMOTIVE SMART TIRE MARKET SIZE, BY DISTRIBUTION CHANNEL, 2018-2030 (USD MILLION)
- TABLE 42. UNITED STATES AUTOMOTIVE SMART TIRE MARKET SIZE, BY VEHICLE TYPE, 2018-2030 (USD MILLION)
- TABLE 43. UNITED STATES AUTOMOTIVE SMART TIRE MARKET SIZE, BY STATE, 2018-2030 (USD MILLION)
- TABLE 44. ASIA-PACIFIC AUTOMOTIVE SMART TIRE MARKET SIZE, BY TYPE, 2018-2030 (USD MILLION)
- TABLE 45. ASIA-PACIFIC AUTOMOTIVE SMART TIRE MARKET SIZE, BY ENGINEERING TECHNOLOGY, 2018-2030 (USD MILLION)
- TABLE 46. ASIA-PACIFIC AUTOMOTIVE SMART TIRE MARKET SIZE, BY DISTRIBUTION CHANNEL, 2018-2030 (USD MILLION)
- TABLE 47. ASIA-PACIFIC AUTOMOTIVE SMART TIRE MARKET SIZE, BY VEHICLE TYPE, 2018-2030 (USD MILLION)
- TABLE 48. ASIA-PACIFIC AUTOMOTIVE SMART TIRE MARKET SIZE, BY COUNTRY, 2018-2030 (USD MILLION)
- TABLE 49. AUSTRALIA AUTOMOTIVE SMART TIRE MARKET SIZE, BY TYPE, 2018-2030 (USD MILLION)
- TABLE 50. AUSTRALIA AUTOMOTIVE SMART TIRE MARKET SIZE, BY ENGINEERING TECHNOLOGY, 2018-2030 (USD MILLION)
- TABLE 51. AUSTRALIA AUTOMOTIVE SMART TIRE MARKET SIZE, BY DISTRIBUTION CHANNEL, 2018-2030 (USD MILLION)
- TABLE 52. AUSTRALIA AUTOMOTIVE SMART TIRE MARKET SIZE, BY VEHICLE TYPE, 2018-2030 (USD MILLION)
- TABLE 53. CHINA AUTOMOTIVE SMART TIRE MARKET SIZE, BY TYPE, 2018-2030 (USD MILLION)
- TABLE 54. CHINA AUTOMOTIVE SMART TIRE MARKET SIZE, BY ENGINEERING TECHNOLOGY, 2018-2030 (USD MILLION)
- TABLE 55. CHINA AUTOMOTIVE SMART TIRE MARKET SIZE, BY DISTRIBUTION CHANNEL, 2018-2030 (USD MILLION)
- TABLE 56. CHINA AUTOMOTIVE SMART TIRE MARKET SIZE, BY VEHICLE TYPE, 2018-2030 (USD MILLION)
- TABLE 57. INDIA AUTOMOTIVE SMART TIRE MARKET SIZE, BY TYPE, 2018-2030 (USD MILLION)
- TABLE 58. INDIA AUTOMOTIVE SMART TIRE MARKET SIZE, BY ENGINEERING TECHNOLOGY, 2018-2030 (USD MILLION)
- TABLE 59. INDIA AUTOMOTIVE SMART TIRE MARKET SIZE, BY DISTRIBUTION CHANNEL, 2018-2030 (USD MILLION)
- TABLE 60. INDIA AUTOMOTIVE SMART TIRE MARKET SIZE, BY VEHICLE TYPE, 2018-2030 (USD MILLION)
- TABLE 61. INDONESIA AUTOMOTIVE SMART TIRE MARKET SIZE, BY TYPE, 2018-2030 (USD MILLION)
- TABLE 62. INDONESIA AUTOMOTIVE SMART TIRE MARKET SIZE, BY ENGINEERING TECHNOLOGY, 2018-2030 (USD MILLION)
- TABLE 63. INDONESIA AUTOMOTIVE SMART TIRE MARKET SIZE, BY DISTRIBUTION CHANNEL, 2018-2030 (USD MILLION)
- TABLE 64. INDONESIA AUTOMOTIVE SMART TIRE MARKET SIZE, BY VEHICLE TYPE, 2018-2030 (USD MILLION)
- TABLE 65. JAPAN AUTOMOTIVE SMART TIRE MARKET SIZE, BY TYPE, 2018-2030 (USD MILLION)
- TABLE 66. JAPAN AUTOMOTIVE SMART TIRE MARKET SIZE, BY ENGINEERING TECHNOLOGY, 2018-2030 (USD MILLION)
- TABLE 67. JAPAN AUTOMOTIVE SMART TIRE MARKET SIZE, BY DISTRIBUTION CHANNEL, 2018-2030 (USD MILLION)
- TABLE 68. JAPAN AUTOMOTIVE SMART TIRE MARKET SIZE, BY VEHICLE TYPE, 2018-2030 (USD MILLION)
- TABLE 69. MALAYSIA AUTOMOTIVE SMART TIRE MARKET SIZE, BY TYPE, 2018-2030 (USD MILLION)
- TABLE 70. MALAYSIA AUTOMOTIVE SMART TIRE MARKET SIZE, BY ENGINEERING TECHNOLOGY, 2018-2030 (USD MILLION)
- TABLE 71. MALAYSIA AUTOMOTIVE SMART TIRE MARKET SIZE, BY DISTRIBUTION CHANNEL, 2018-2030 (USD MILLION)
- TABLE 72. MALAYSIA AUTOMOTIVE SMART TIRE MARKET SIZE, BY VEHICLE TYPE, 2018-2030 (USD MILLION)
- TABLE 73. PHILIPPINES AUTOMOTIVE SMART TIRE MARKET SIZE, BY TYPE, 2018-2030 (USD MILLION)
- TABLE 74. PHILIPPINES AUTOMOTIVE SMART TIRE MARKET SIZE, BY ENGINEERING TECHNOLOGY, 2018-2030 (USD MILLION)
- TABLE 75. PHILIPPINES AUTOMOTIVE SMART TIRE MARKET SIZE, BY DISTRIBUTION CHANNEL, 2018-2030 (USD MILLION)
- TABLE 76. PHILIPPINES AUTOMOTIVE SMART TIRE MARKET SIZE, BY VEHICLE TYPE, 2018-2030 (USD MILLION)
- TABLE 77. SINGAPORE AUTOMOTIVE SMART TIRE MARKET SIZE, BY TYPE, 2018-2030 (USD MILLION)
- TABLE 78. SINGAPORE AUTOMOTIVE SMART TIRE MARKET SIZE, BY ENGINEERING TECHNOLOGY, 2018-2030 (USD MILLION)
- TABLE 79. SINGAPORE AUTOMOTIVE SMART TIRE MARKET SIZE, BY DISTRIBUTION CHANNEL, 2018-2030 (USD MILLION)
- TABLE 80. SINGAPORE AUTOMOTIVE SMART TIRE MARKET SIZE, BY VEHICLE TYPE, 2018-2030 (USD MILLION)
- TABLE 81. SOUTH KOREA AUTOMOTIVE SMART TIRE MARKET SIZE, BY TYPE, 2018-2030 (USD MILLION)
- TABLE 82. SOUTH KOREA AUTOMOTIVE SMART TIRE MARKET SIZE, BY ENGINEERING TECHNOLOGY, 2018-2030 (USD MILLION)
- TABLE 83. SOUTH KOREA AUTOMOTIVE SMART TIRE MARKET SIZE, BY DISTRIBUTION CHANNEL, 2018-2030 (USD MILLION)
- TABLE 84. SOUTH KOREA AUTOMOTIVE SMART TIRE MARKET SIZE, BY VEHICLE TYPE, 2018-2030 (USD MILLION)
- TABLE 85. TAIWAN AUTOMOTIVE SMART TIRE MARKET SIZE, BY TYPE, 2018-2030 (USD MILLION)
- TABLE 86. TAIWAN AUTOMOTIVE SMART TIRE MARKET SIZE, BY ENGINEERING TECHNOLOGY, 2018-2030 (USD MILLION)
- TABLE 87. TAIWAN AUTOMOTIVE SMART TIRE MARKET SIZE, BY DISTRIBUTION CHANNEL, 2018-2030 (USD MILLION)
- TABLE 88. TAIWAN AUTOMOTIVE SMART TIRE MARKET SIZE, BY VEHICLE TYPE, 2018-2030 (USD MILLION)
- TABLE 89. THAILAND AUTOMOTIVE SMART TIRE MARKET SIZE, BY TYPE, 2018-2030 (USD MILLION)
- TABLE 90. THAILAND AUTOMOTIVE SMART TIRE MARKET SIZE, BY ENGINEERING TECHNOLOGY, 2018-2030 (USD MILLION)
- TABLE 91. THAILAND AUTOMOTIVE SMART TIRE MARKET SIZE, BY DISTRIBUTION CHANNEL, 2018-2030 (USD MILLION)
- TABLE 92. THAILAND AUTOMOTIVE SMART TIRE MARKET SIZE, BY VEHICLE TYPE, 2018-2030 (USD MILLION)
- TABLE 93. VIETNAM AUTOMOTIVE SMART TIRE MARKET SIZE, BY TYPE, 2018-2030 (USD MILLION)
- TABLE 94. VIETNAM AUTOMOTIVE SMART TIRE MARKET SIZE, BY ENGINEERING TECHNOLOGY, 2018-2030 (USD MILLION)
- TABLE 95. VIETNAM AUTOMOTIVE SMART TIRE MARKET SIZE, BY DISTRIBUTION CHANNEL, 2018-2030 (USD MILLION)
- TABLE 96. VIETNAM AUTOMOTIVE SMART TIRE MARKET SIZE, BY VEHICLE TYPE, 2018-2030 (USD MILLION)
- TABLE 97. EUROPE, MIDDLE EAST & AFRICA AUTOMOTIVE SMART TIRE MARKET SIZE, BY TYPE, 2018-2030 (USD MILLION)
- TABLE 98. EUROPE, MIDDLE EAST & AFRICA AUTOMOTIVE SMART TIRE MARKET SIZE, BY ENGINEERING TECHNOLOGY, 2018-2030 (USD MILLION)
- TABLE 99. EUROPE, MIDDLE EAST & AFRICA AUTOMOTIVE SMART TIRE MARKET SIZE, BY DISTRIBUTION CHANNEL, 2018-2030 (USD MILLION)
- TABLE 100. EUROPE, MIDDLE EAST & AFRICA AUTOMOTIVE SMART TIRE MARKET SIZE, BY VEHICLE TYPE, 2018-2030 (USD MILLION)
- TABLE 101. EUROPE, MIDDLE EAST & AFRICA AUTOMOTIVE SMART TIRE MARKET SIZE, BY COUNTRY, 2018-2030 (USD MILLION)
- TABLE 102. DENMARK AUTOMOTIVE SMART TIRE MARKET SIZE, BY TYPE, 2018-2030 (USD MILLION)
- TABLE 103. DENMARK AUTOMOTIVE SMART TIRE MARKET SIZE, BY ENGINEERING TECHNOLOGY, 2018-2030 (USD MILLION)
- TABLE 104. DENMARK AUTOMOTIVE SMART TIRE MARKET SIZE, BY DISTRIBUTION CHANNEL, 2018-2030 (USD MILLION)
- TABLE 105. DENMARK AUTOMOTIVE SMART TIRE MARKET SIZE, BY VEHICLE TYPE, 2018-2030 (USD MILLION)
- TABLE 106. EGYPT AUTOMOTIVE SMART TIRE MARKET SIZE, BY TYPE, 2018-2030 (USD MILLION)
- TABLE 107. EGYPT AUTOMOTIVE SMART TIRE MARKET SIZE, BY ENGINEERING TECHNOLOGY, 2018-2030 (USD MILLION)
- TABLE 108. EGYPT AUTOMOTIVE SMART TIRE MARKET SIZE, BY DISTRIBUTION CHANNEL, 2018-2030 (USD MILLION)
- TABLE 109. EGYPT AUTOMOTIVE SMART TIRE MARKET SIZE, BY VEHICLE TYPE, 2018-2030 (USD MILLION)
- TABLE 110. FINLAND AUTOMOTIVE SMART TIRE MARKET SIZE, BY TYPE, 2018-2030 (USD MILLION)
- TABLE 111. FINLAND AUTOMOTIVE SMART TIRE MARKET SIZE, BY ENGINEERING TECHNOLOGY, 2018-2030 (USD MILLION)
- TABLE 112. FINLAND AUTOMOTIVE SMART TIRE MARKET SIZE, BY DISTRIBUTION CHANNEL, 2018-2030 (USD MILLION)
- TABLE 113. FINLAND AUTOMOTIVE SMART TIRE MARKET SIZE, BY VEHICLE TYPE, 2018-2030 (USD MILLION)
- TABLE 114. FRANCE AUTOMOTIVE SMART TIRE MARKET SIZE, BY TYPE, 2018-2030 (USD MILLION)
- TABLE 115. FRANCE AUTOMOTIVE SMART TIRE MARKET SIZE, BY ENGINEERING TECHNOLOGY, 2018-2030 (USD MILLION)
- TABLE 116. FRANCE AUTOMOTIVE SMART TIRE MARKET SIZE, BY DISTRIBUTION CHANNEL, 2018-2030 (USD MILLION)
- TABLE 117. FRANCE AUTOMOTIVE SMART TIRE MARKET SIZE, BY VEHICLE TYPE, 2018-2030 (USD MILLION)
- TABLE 118. GERMANY AUTOMOTIVE SMART TIRE MARKET SIZE, BY TYPE, 2018-2030 (USD MILLION)
- TABLE 119. GERMANY AUTOMOTIVE SMART TIRE MARKET SIZE, BY ENGINEERING TECHNOLOGY, 2018-2030 (USD MILLION)
- TABLE 120. GERMANY AUTOMOTIVE SMART TIRE MARKET SIZE, BY DISTRIBUTION CHANNEL, 2018-2030 (USD MILLION)
- TABLE 121. GERMANY AUTOMOTIVE SMART TIRE MARKET SIZE, BY VEHICLE TYPE, 2018-2030 (USD MILLION)
- TABLE 122. ISRAEL AUTOMOTIVE SMART TIRE MARKET SIZE, BY TYPE, 2018-2030 (USD MILLION)
- TABLE 123. ISRAEL AUTOMOTIVE SMART TIRE MARKET SIZE, BY ENGINEERING TECHNOLOGY, 2018-2030 (USD MILLION)
- TABLE 124. ISRAEL AUTOMOTIVE SMART TIRE MARKET SIZE, BY DISTRIBUTION CHANNEL, 2018-2030 (USD MILLION)
- TABLE 125. ISRAEL AUTOMOTIVE SMART TIRE MARKET SIZE, BY VEHICLE TYPE, 2018-2030 (USD MILLION)
- TABLE 126. ITALY AUTOMOTIVE SMART TIRE MARKET SIZE, BY TYPE, 2018-2030 (USD MILLION)
- TABLE 127. ITALY AUTOMOTIVE SMART TIRE MARKET SIZE, BY ENGINEERING TECHNOLOGY, 2018-2030 (USD MILLION)
- TABLE 128. ITALY AUTOMOTIVE SMART TIRE MARKET SIZE, BY DISTRIBUTION CHANNEL, 2018-2030 (USD MILLION)
- TABLE 129. ITALY AUTOMOTIVE SMART TIRE MARKET SIZE, BY VEHICLE TYPE, 2018-2030 (USD MILLION)
- TABLE 130. NETHERLANDS AUTOMOTIVE SMART TIRE MARKET SIZE, BY TYPE, 2018-2030 (USD MILLION)
- TABLE 131. NETHERLANDS AUTOMOTIVE SMART TIRE MARKET SIZE, BY ENGINEERING TECHNOLOGY, 2018-2030 (USD MILLION)
- TABLE 132. NETHERLANDS AUTOMOTIVE SMART TIRE MARKET SIZE, BY DISTRIBUTION CHANNEL, 2018-2030 (USD MILLION)
- TABLE 133. NETHERLANDS AUTOMOTIVE SMART TIRE MARKET SIZE, BY VEHICLE TYPE, 2018-2030 (USD MILLION)
- TABLE 134. NIGERIA AUTOMOTIVE SMART TIRE MARKET SIZE, BY TYPE, 2018-2030 (USD MILLION)
- TABLE 135. NIGERIA AUTOMOTIVE SMART TIRE MARKET SIZE, BY ENGINEERING TECHNOLOGY, 2018-2030 (USD MILLION)
- TABLE 136. NIGERIA AUTOMOTIVE SMART TIRE MARKET SIZE, BY DISTRIBUTION CHANNEL, 2018-2030 (USD MILLION)
- TABLE 137. NIGERIA AUTOMOTIVE SMART TIRE MARKET SIZE, BY VEHICLE TYPE, 2018-2030 (USD MILLION)
- TABLE 138. NORWAY AUTOMOTIVE SMART TIRE MARKET SIZE, BY TYPE, 2018-2030 (USD MILLION)
- TABLE 139. NORWAY AUTOMOTIVE SMART TIRE MARKET SIZE, BY ENGINEERING TECHNOLOGY, 2018-2030 (USD MILLION)
- TABLE 140. NORWAY AUTOMOTIVE SMART TIRE MARKET SIZE, BY DISTRIBUTION CHANNEL, 2018-2030 (USD MILLION)
- TABLE 141. NORWAY AUTOMOTIVE SMART TIRE MARKET SIZE, BY VEHICLE TYPE, 2018-2030 (USD MILLION)
- TABLE 142. POLAND AUTOMOTIVE SMART TIRE MARKET SIZE, BY TYPE, 2018-2030 (USD MILLION)
- TABLE 143. POLAND AUTOMOTIVE SMART TIRE MARKET SIZE, BY ENGINEERING TECHNOLOGY, 2018-2030 (USD MILLION)
- TABLE 144. POLAND AUTOMOTIVE SMART TIRE MARKET SIZE, BY DISTRIBUTION CHANNEL, 2018-2030 (USD MILLION)
- TABLE 145. POLAND AUTOMOTIVE SMART TIRE MARKET SIZE, BY VEHICLE TYPE, 2018-2030 (USD MILLION)
- TABLE 146. QATAR AUTOMOTIVE SMART TIRE MARKET SIZE, BY TYPE, 2018-2030 (USD MILLION)
- TABLE 147. QATAR AUTOMOTIVE SMART TIRE MARKET SIZE, BY ENGINEERING TECHNOLOGY, 2018-2030 (USD MILLION)
- TABLE 148. QATAR AUTOMOTIVE SMART TIRE MARKET SIZE, BY DISTRIBUTION CHANNEL, 2018-2030 (USD MILLION)
- TABLE 149. QATAR AUTOMOTIVE SMART TIRE MARKET SIZE, BY VEHICLE TYPE, 2018-2030 (USD MILLION)
- TABLE 150. RUSSIA AUTOMOTIVE SMART TIRE MARKET SIZE, BY TYPE, 2018-2030 (USD MILLION)
- TABLE 151. RUSSIA AUTOMOTIVE SMART TIRE MARKET SIZE, BY ENGINEERING TECHNOLOGY, 2018-2030 (USD MILLION)
- TABLE 152. RUSSIA AUTOMOTIVE SMART TIRE MARKET SIZE, BY DISTRIBUTION CHANNEL, 2018-2030 (USD MILLION)
- TABLE 153. RUSSIA AUTOMOTIVE SMART TIRE MARKET SIZE, BY VEHICLE TYPE, 2018-2030 (USD MILLION)
- TABLE 154. SAUDI ARABIA AUTOMOTIVE SMART TIRE MARKET SIZE, BY TYPE, 2018-2030 (USD MILLION)
- TABLE 155. SAUDI ARABIA AUTOMOTIVE SMART TIRE MARKET SIZE, BY ENGINEERING TECHNOLOGY, 2018-2030 (USD MILLION)
- TABLE 156. SAUDI ARABIA AUTOMOTIVE SMART TIRE MARKET SIZE, BY DISTRIBUTION CHANNEL, 2018-2030 (USD MILLION)
- TABLE 157. SAUDI ARABIA AUTOMOTIVE SMART TIRE MARKET SIZE, BY VEHICLE TYPE, 2018-2030 (USD MILLION)
- TABLE 158. SOUTH AFRICA AUTOMOTIVE SMART TIRE MARKET SIZE, BY TYPE, 2018-2030 (USD MILLION)
- TABLE 159. SOUTH AFRICA AUTOMOTIVE SMART TIRE MARKET SIZE, BY ENGINEERING TECHNOLOGY, 2018-2030 (USD MILLION)
- TABLE 160. SOUTH AFRICA AUTOMOTIVE SMART TIRE MARKET SIZE, BY DISTRIBUTION CHANNEL, 2018-2030 (USD MILLION)
- TABLE 161. SOUTH AFRICA AUTOMOTIVE SMART TIRE MARKET SIZE, BY VEHICLE TYPE, 2018-2030 (USD MILLION)
- TABLE 162. SPAIN AUTOMOTIVE SMART TIRE MARKET SIZE, BY TYPE, 2018-2030 (USD MILLION)
- TABLE 163. SPAIN AUTOMOTIVE SMART TIRE MARKET SIZE, BY ENGINEERING TECHNOLOGY, 2018-2030 (USD MILLION)
- TABLE 164. SPAIN AUTOMOTIVE SMART TIRE MARKET SIZE, BY DISTRIBUTION CHANNEL, 2018-2030 (USD MILLION)
- TABLE 165. SPAIN AUTOMOTIVE SMART TIRE MARKET SIZE, BY VEHICLE TYPE, 2018-2030 (USD MILLION)
- TABLE 166. SWEDEN AUTOMOTIVE SMART TIRE MARKET SIZE, BY TYPE, 2018-2030 (USD MILLION)
- TABLE 167. SWEDEN AUTOMOTIVE SMART TIRE MARKET SIZE, BY ENGINEERING TECHNOLOGY, 2018-2030 (USD MILLION)
- TABLE 168. SWEDEN AUTOMOTIVE SMART TIRE MARKET SIZE, BY DISTRIBUTION CHANNEL, 2018-2030 (USD MILLION)
- TABLE 169. SWEDEN AUTOMOTIVE SMART TIRE MARKET SIZE, BY VEHICLE TYPE, 2018-2030 (USD MILLION)
- TABLE 170. SWITZERLAND AUTOMOTIVE SMART TIRE MARKET SIZE, BY TYPE, 2018-2030 (USD MILLION)
- TABLE 171. SWITZERLAND AUTOMOTIVE SMART TIRE MARKET SIZE, BY ENGINEERING TECHNOLOGY, 2018-2030 (USD MILLION)
- TABLE 172. SWITZERLAND AUTOMOTIVE SMART TIRE MARKET SIZE, BY DISTRIBUTION CHANNEL, 2018-2030 (USD MILLION)
- TABLE 173. SWITZERLAND AUTOMOTIVE SMART TIRE MARKET SIZE, BY VEHICLE TYPE, 2018-2030 (USD MILLION)
- TABLE 174. TURKEY AUTOMOTIVE SMART TIRE MARKET SIZE, BY TYPE, 2018-2030 (USD MILLION)
- TABLE 175. TURKEY AUTOMOTIVE SMART TIRE MARKET SIZE, BY ENGINEERING TECHNOLOGY, 2018-2030 (USD MILLION)
- TABLE 176. TURKEY AUTOMOTIVE SMART TIRE MARKET SIZE, BY DISTRIBUTION CHANNEL, 2018-2030 (USD MILLION)
- TABLE 177. TURKEY AUTOMOTIVE SMART TIRE MARKET SIZE, BY VEHICLE TYPE, 2018-2030 (USD MILLION)
- TABLE 178. UNITED ARAB EMIRATES AUTOMOTIVE SMART TIRE MARKET SIZE, BY TYPE, 2018-2030 (USD MILLION)
- TABLE 179. UNITED ARAB EMIRATES AUTOMOTIVE SMART TIRE MARKET SIZE, BY ENGINEERING TECHNOLOGY, 2018-2030 (USD MILLION)
- TABLE 180. UNITED ARAB EMIRATES AUTOMOTIVE SMART TIRE MARKET SIZE, BY DISTRIBUTION CHANNEL, 2018-2030 (USD MILLION)
- TABLE 181. UNITED ARAB EMIRATES AUTOMOTIVE SMART TIRE MARKET SIZE, BY VEHICLE TYPE, 2018-2030 (USD MILLION)
- TABLE 182. UNITED KINGDOM AUTOMOTIVE SMART TIRE MARKET SIZE, BY TYPE, 2018-2030 (USD MILLION)
- TABLE 183. UNITED KINGDOM AUTOMOTIVE SMART TIRE MARKET SIZE, BY ENGINEERING TECHNOLOGY, 2018-2030 (USD MILLION)
- TABLE 184. UNITED KINGDOM AUTOMOTIVE SMART TIRE MARKET SIZE, BY DISTRIBUTION CHANNEL, 2018-2030 (USD MILLION)
- TABLE 185. UNITED KINGDOM AUTOMOTIVE SMART TIRE MARKET SIZE, BY VEHICLE TYPE, 2018-2030 (USD MILLION)
- TABLE 186. AUTOMOTIVE SMART TIRE MARKET, FPNV POSITIONING MATRIX, 2023
- TABLE 187. AUTOMOTIVE SMART TIRE MARKET SHARE, BY KEY PLAYER, 2023
- TABLE 188. AUTOMOTIVE SMART TIRE MARKET LICENSE & PRICING
 全球高性能轮圈市场规模、份额、成长分析(按车辆、售后市场、材料和轮圈尺寸划分)- 2024-2031 年产业预测
 高性能轮胎:市场占有率分析、产业趋势与统计、成长预测(2024-2029)
 2024 年高性能轮圈全球市场报告
 先进轮胎市场:按技术类型、按材料类型、按非公路用车类型、按公路车辆类型、按类型 - 2024-2030 年全球预测
 先进轮胎市场 - 2018-2028 年全球产业规模、份额、趋势、机会与预测,按车辆类型、技术、轮胎类型、材料类型、地区、竞争细分
 超高性能轮胎市场 - 2018-2028 年全球产业规模、份额、趋势、机会和预测,按轮胎类型、需求类别、车辆类型、地区、竞争细分
 高性能乘用车轮胎市场 - 2018-2028 年全球产业规模、份额、趋势机会与预测(按车辆类型、轮胎类型、需求类别、地区、竞争细分)
 2030 年先进轮胎市场预测:按材料类型、类型和地区分類的全球分析
 汽车优质轮胎市场:按类型(斜交轮胎、子午线轮胎)、按用途(售后市场、目的地设备製造商)- 2023-2030 年全球预测
 先进轮胎市场:按类型、技术、车型、利基技术、材料和地区划分的未来预测(-2030 年)