


 |
市场调查报告书
商品编码
1413876
生物聚酰胺市场:按类型、材料、应用分类 - 2024-2030 年全球预测Bio-polyamide Market by Type (Polyamide 10, Polyamide 11, Polyamide 12), Material (Amino Acids, Diacids, Diamines), Application - Global Forecast 2024-2030 |
||||||
※ 本网页内容可能与最新版本有所差异。详细情况请与我们联繫。
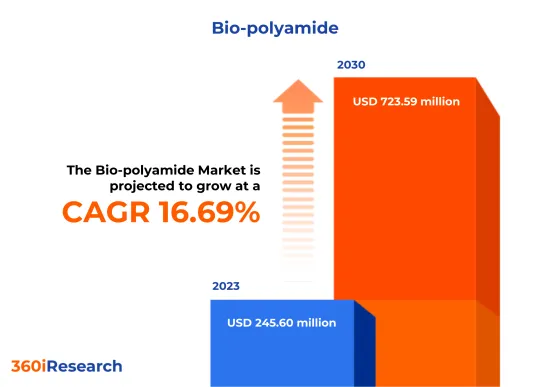
预计2023年生物聚酰胺市场规模为2.456亿美元,预计2024年将达2.8482亿美元,2030年将达7.2359亿美元,复合年增长率为16.69%。
全球生物聚酰胺市场
| 主要市场统计 | |
|---|---|
| 基准年[2023] | 2.456 亿美元 |
| 预测年份 [2024] | 28482万美元 |
| 预测年份 [2030] | 72359万美元 |
| 复合年增长率(%) | 16.69% |
生物聚酰胺是一种由可再生生物基原料而非传统石油基原料所获得的聚酰胺。这些热塑性塑胶因其高强度、优异的耐热性和耐化学性以及优异的耐用性而受到广泛认可。生物聚酰胺正成为汽车、电子、纺织和包装等环保产业的首选。近年来,由于永续性趋势的增强、政府推广生物基产品的政策以及生产技术的突破,对生物聚酰胺的需求不断增加。然而,生产成本的增加和恶劣条件下的性能限制可能会阻碍生物聚酰胺的市场渗透。也就是说,专注于原材料多样化、改进生产方法以提高效率以及提高生物聚酰胺性能的创新和研究至关重要。此外,生物聚合物生产和加工技术的创新预计将透过提高性能和成本效益来促进生物聚酰胺的生产和可得性。
区域洞察
消费者对永续材料的认识和严格的环境法规推动了美洲生物聚酰胺市场的发展。特别是,由于对减重和性能的严格材料要求,生物聚酰胺在汽车和电子产业的需求量很大。北美自由贸易协定 (北美自由贸易组织(NAFTA)) 促进了跨境贸易并有利于区域生物聚酰胺市场。由于强有力的环境政策、消费者对生物分解性塑胶的高度认识以及政府的激励措施,欧盟 (EU) 处于生物聚酰胺消费的前沿。欧盟的循环经济一揽子计划和生物经济战略透过推广永续材料来加强市场。中东国家正以永续性为战略支柱实现经济多元化,这可能会推动对生物聚酰胺的需求。在非洲,不断发展的纺织业和不断增强的环保意识可能会带来市场机会。在亚太地区,由于汽车、电子和包装产业的扩张,对生物聚酰胺的需求显着成长。消费者意识和永续性的推动,加上政府的支持,正在推动该地区对生物聚酰胺的需求。
FPNV定位矩阵
FPNV定位矩阵对于评估生物聚酰胺市场至关重要。我们检视与业务策略和产品满意度相关的关键指标,以对供应商进行全面评估。这种深入的分析使用户能够根据自己的要求做出明智的决策。根据评估,供应商被分为四个成功程度不同的像限:前沿(F)、探路者(P)、利基(N)和重要(V)。
市场占有率分析
市场占有率分析是一种综合工具,可以对生物聚酰胺市场供应商的现状进行深入而详细的研究。全面比较和分析供应商在整体收益、基本客群和其他关键指标方面的贡献,以便更好地了解公司的绩效及其在争夺市场占有率时面临的挑战。此外,该分析还提供了对该行业竞争特征的宝贵考察,包括在研究基准年观察到的累积、分散主导地位和合併特征等因素。这种详细程度的提高使供应商能够做出更明智的决策并制定有效的策略,从而在市场上获得竞争优势。
本报告在以下方面提供了宝贵的见解:
1-市场渗透率:提供有关主要企业所服务的市场的全面资讯。
2-市场开拓:我们深入研究利润丰厚的新兴市场,并分析它们在成熟细分市场中的渗透率。
3- 市场多元化:提供有关新产品发布、开拓地区、最新发展和投资的详细资讯。
4-竞争力评估与资讯:对主要企业的市场占有率、策略、产品、认证、监管状况、专利状况、製造能力等进行全面评估。
5- 产品开发与创新:提供对未来技术、研发活动和突破性产品开发的见解。
本报告解决了以下关键问题:
1-生物聚酰胺市场的市场规模和预测是多少?
2-生物聚酰胺市场预测期内需要考虑投资的产品、细分市场、应用和领域有哪些?
3-生物聚酰胺市场的技术趋势和法律规范是什么?
4-生物聚酰胺市场主要供应商的市场占有率是多少?
5-进入生物聚酰胺市场合适的型态和策略手段是什么?
目录
第一章 前言
第二章调查方法
第三章执行摘要
第四章市场概况
第五章市场洞察
- 市场动态
- 促进因素
- 人们越来越认识到生物聚酰胺的用途和益处
- 将生物聚酰胺的应用扩展到不同的最终用户产业
- 促进采用环保材料的环境政策
- 抑制因素
- 与基于石化燃料的聚酰胺相比,生物聚酰胺的生产成本较高。
- 机会
- 正在进行开发新型生物聚酰胺的研究
- 支持政府核准使用生物聚酰胺
- 任务
- 生物聚酰胺生产中的性能问题与技术挑战
- 促进因素
- 市场区隔分析
- 类型:聚酰胺12在电缆和运动器材的应用进展
- 材料:增加二胺的使用以形成聚酰胺的长链特征
- 应用:生物聚酰胺在汽车应用的采用
- 市场趋势分析
- 高通膨的累积效应
- 波特五力分析
- 价值炼和关键路径分析
- 法律规范
第六章生物聚酰胺市场:依类型
- 聚酰胺10
- 聚酰胺11
- 聚酰胺12
- 聚酰胺6
- 聚酰胺66
第七章生物聚酰胺市场:依材料分类
- 胺基酸
- 二酸
- 二胺
- 内酰胺
第八章生物聚酰胺市场:依应用分类
- 车
- 消费品
- 电力/电子
- 薄膜和涂料
- 工业的
第九章美洲生物聚酰胺市场
- 阿根廷
- 巴西
- 加拿大
- 墨西哥
- 美国
第10章亚太生物聚酰胺市场
- 澳洲
- 中国
- 印度
- 印尼
- 日本
- 马来西亚
- 菲律宾
- 新加坡
- 韩国
- 台湾
- 泰国
- 越南
第十一章欧洲、中东和非洲生物聚酰胺市场
- 丹麦
- 埃及
- 芬兰
- 法国
- 德国
- 以色列
- 义大利
- 荷兰
- 奈及利亚
- 挪威
- 波兰
- 卡达
- 俄罗斯
- 沙乌地阿拉伯
- 南非
- 西班牙
- 瑞典
- 瑞士
- 土耳其
- 阿拉伯聯合大公国
- 英国
第十二章竞争形势
- FPNV定位矩阵
- 市场占有率分析:主要企业
- 主要企业竞争情境分析
- 合约、合作和伙伴关係
- 新产品发布和功能增强
第13章竞争产品组合
- 主要公司简介
- AKRO-PLASTIC GmbH
- Arkema AG
- Asahi Kasei Corporation
- Avient Corporation
- BASF SE
- Cathay Biotech Inc.
- Celanese Corporation
- DuPont de Nemours, Inc.
- Evonik AG
- Honeywell International Inc.
- Indorama Mobility Group
- Koninklijke DSM NV
- Lanxess AG
- Novamont SpA
- Solvay SA
- Toray Industries, Inc.
- 主要产品系列
第十四章附录
- 讨论指南
- 关于许可证和定价
[187 Pages Report] The Bio-polyamide Market size was estimated at USD 245.60 million in 2023 and expected to reach USD 284.82 million in 2024, at a CAGR 16.69% to reach USD 723.59 million by 2030.
Global Bio-polyamide Market
| KEY MARKET STATISTICS | |
|---|---|
| Base Year [2023] | USD 245.60 million |
| Estimated Year [2024] | USD 284.82 million |
| Forecast Year [2030] | USD 723.59 million |
| CAGR (%) | 16.69% |
Bio-polyamides are a class of polyamides derived from renewable, bio-based raw materials rather than traditional petroleum-based sources. These thermoplastic resins are widely recognized for their high strength, superior thermal and chemical resistance, and outstanding durability. Bio-polyamides are becoming favored in eco-conscious industries, with applications spanning automotive, electronics, textiles, and packaging. In recent years, the rising trend towards sustainability, governmental policies advocating bio-based products, and breakthroughs in production technologies have improved the demand for bio-polyamides. However, the elevated costs of production and performance limitations in extreme conditions can impede market penetration of bio-polyamides. Nevertheless, innovation and research are vital, focusing on diversifying feedstocks, refining production methods for better efficiency, and augmenting bio-polyamides' performance. Moreover, innovations in bio-polymer production and processing technologies are expected to contribute to the production and availability of bio-polyamides through improved performance and cost-effectiveness.
Regional Insights
The bio-polyamide market in the Americas is driven by consumer awareness about sustainable materials and stringent environmental regulations. In particular, the automotive and electronics industries exhibit a high demand for bio-polyamides due to their strict material requirements concerning weight reduction and performance. The North American Free Trade Agreement (NAFTA) has facilitated cross-border trade, thus benefiting the regional bio-polyamide market. The European Union (EU) is at the forefront of bio-polyamide consumption due to robust environmental policies, high consumer consciousness towards biodegradable plastics, and government incentives. The European Union's Circular Economy Package and the Bioeconomy Strategy strengthen the market by promoting sustainable materials. The Middle Eastern countries are diversifying their economies with sustainability as a strategic pillar, which could increase demand for bio-polyamides. In Africa, the market opportunities may be driven by the evolving textile industry and increased environmental awareness. The Asia Pacific region is experiencing significant demand for bio-polyamide due to the expanding automotive, electronics, and packaging industries. Consumer awareness and sustainability drives, coupled with government support, are propelling the demand for bio-polyamides in the region.
FPNV Positioning Matrix
The FPNV Positioning Matrix is pivotal in evaluating the Bio-polyamide Market. It offers a comprehensive assessment of vendors, examining key metrics related to Business Strategy and Product Satisfaction. This in-depth analysis empowers users to make well-informed decisions aligned with their requirements. Based on the evaluation, the vendors are then categorized into four distinct quadrants representing varying levels of success: Forefront (F), Pathfinder (P), Niche (N), or Vital (V).
Market Share Analysis
The Market Share Analysis is a comprehensive tool that provides an insightful and in-depth examination of the current state of vendors in the Bio-polyamide Market. By meticulously comparing and analyzing vendor contributions in terms of overall revenue, customer base, and other key metrics, we can offer companies a greater understanding of their performance and the challenges they face when competing for market share. Additionally, this analysis provides valuable insights into the competitive nature of the sector, including factors such as accumulation, fragmentation dominance, and amalgamation traits observed over the base year period studied. With this expanded level of detail, vendors can make more informed decisions and devise effective strategies to gain a competitive edge in the market.
Key Company Profiles
The report delves into recent significant developments in the Bio-polyamide Market, highlighting leading vendors and their innovative profiles. These include AKRO-PLASTIC GmbH, Arkema AG, Asahi Kasei Corporation, Avient Corporation, BASF SE, Cathay Biotech Inc., Celanese Corporation, DuPont de Nemours, Inc., Evonik AG, Honeywell International Inc., Indorama Mobility Group, Koninklijke DSM N.V., Lanxess AG, Novamont S.p.A., Solvay S.A., and Toray Industries, Inc..
Market Segmentation & Coverage
This research report categorizes the Bio-polyamide Market to forecast the revenues and analyze trends in each of the following sub-markets:
- Type
- Polyamide 10
- Polyamide 11
- Polyamide 12
- Polyamide 6
- Polyamide 66
- Material
- Amino Acids
- Diacids
- Diamines
- Lactams
- Application
- Automotive
- Consumer Goods
- Electrical & Electronics
- Film & Coating
- Industrial
- Region
- Americas
- Argentina
- Brazil
- Canada
- Mexico
- United States
- California
- Florida
- Illinois
- New York
- Ohio
- Pennsylvania
- Texas
- Asia-Pacific
- Australia
- China
- India
- Indonesia
- Japan
- Malaysia
- Philippines
- Singapore
- South Korea
- Taiwan
- Thailand
- Vietnam
- Europe, Middle East & Africa
- Denmark
- Egypt
- Finland
- France
- Germany
- Israel
- Italy
- Netherlands
- Nigeria
- Norway
- Poland
- Qatar
- Russia
- Saudi Arabia
- South Africa
- Spain
- Sweden
- Switzerland
- Turkey
- United Arab Emirates
- United Kingdom
- Americas
The report offers valuable insights on the following aspects:
1. Market Penetration: It presents comprehensive information on the market provided by key players.
2. Market Development: It delves deep into lucrative emerging markets and analyzes the penetration across mature market segments.
3. Market Diversification: It provides detailed information on new product launches, untapped geographic regions, recent developments, and investments.
4. Competitive Assessment & Intelligence: It conducts an exhaustive assessment of market shares, strategies, products, certifications, regulatory approvals, patent landscape, and manufacturing capabilities of the leading players.
5. Product Development & Innovation: It offers intelligent insights on future technologies, R&D activities, and breakthrough product developments.
The report addresses key questions such as:
1. What is the market size and forecast of the Bio-polyamide Market?
2. Which products, segments, applications, and areas should one consider investing in over the forecast period in the Bio-polyamide Market?
3. What are the technology trends and regulatory frameworks in the Bio-polyamide Market?
4. What is the market share of the leading vendors in the Bio-polyamide Market?
5. Which modes and strategic moves are suitable for entering the Bio-polyamide Market?
Table of Contents
1. Preface
- 1.1. Objectives of the Study
- 1.2. Market Segmentation & Coverage
- 1.3. Years Considered for the Study
- 1.4. Currency & Pricing
- 1.5. Language
- 1.6. Limitations
- 1.7. Assumptions
- 1.8. Stakeholders
2. Research Methodology
- 2.1. Define: Research Objective
- 2.2. Determine: Research Design
- 2.3. Prepare: Research Instrument
- 2.4. Collect: Data Source
- 2.5. Analyze: Data Interpretation
- 2.6. Formulate: Data Verification
- 2.7. Publish: Research Report
- 2.8. Repeat: Report Update
3. Executive Summary
4. Market Overview
- 4.1. Introduction
- 4.2. Bio-polyamide Market, by Region
5. Market Insights
- 5.1. Market Dynamics
- 5.1.1. Drivers
- 5.1.1.1. Growing awareness toward use and benefits of bio-polyamides
- 5.1.1.2. Expanding applications of bio-polyamides across diverse end-user industries
- 5.1.1.3. Environmental policies to encourage adoption of eco-friendly materials
- 5.1.2. Restraints
- 5.1.2.1. High production costs of bio-polyamides compared to fossil-fuel-based polyamides
- 5.1.3. Opportunities
- 5.1.3.1. Ongoing research for development of novel bio-polyamides
- 5.1.3.2. Supportive government approvals for use of bio-polyamides
- 5.1.4. Challenges
- 5.1.4.1. Performance issues and technical challenges in manufacturing of bio-polyamides
- 5.1.1. Drivers
- 5.2. Market Segmentation Analysis
- 5.2.1. Type: Advancing applications of polyamide 12 across cables and sports equipment
- 5.2.2. Material: Increasing usage of diamines to form the long chains characteristic of polyamides
- 5.2.3. Application: Adoption of bio-polyamides in automotive applications
- 5.3. Market Trend Analysis
- 5.4. Cumulative Impact of High Inflation
- 5.5. Porter's Five Forces Analysis
- 5.5.1. Threat of New Entrants
- 5.5.2. Threat of Substitutes
- 5.5.3. Bargaining Power of Customers
- 5.5.4. Bargaining Power of Suppliers
- 5.5.5. Industry Rivalry
- 5.6. Value Chain & Critical Path Analysis
- 5.7. Regulatory Framework
6. Bio-polyamide Market, by Type
- 6.1. Introduction
- 6.2. Polyamide 10
- 6.3. Polyamide 11
- 6.4. Polyamide 12
- 6.5. Polyamide 6
- 6.6. Polyamide 66
7. Bio-polyamide Market, by Material
- 7.1. Introduction
- 7.2. Amino Acids
- 7.3. Diacids
- 7.4. Diamines
- 7.5. Lactams
8. Bio-polyamide Market, by Application
- 8.1. Introduction
- 8.2. Automotive
- 8.3. Consumer Goods
- 8.4. Electrical & Electronics
- 8.5. Film & Coating
- 8.6. Industrial
9. Americas Bio-polyamide Market
- 9.1. Introduction
- 9.2. Argentina
- 9.3. Brazil
- 9.4. Canada
- 9.5. Mexico
- 9.6. United States
10. Asia-Pacific Bio-polyamide Market
- 10.1. Introduction
- 10.2. Australia
- 10.3. China
- 10.4. India
- 10.5. Indonesia
- 10.6. Japan
- 10.7. Malaysia
- 10.8. Philippines
- 10.9. Singapore
- 10.10. South Korea
- 10.11. Taiwan
- 10.12. Thailand
- 10.13. Vietnam
11. Europe, Middle East & Africa Bio-polyamide Market
- 11.1. Introduction
- 11.2. Denmark
- 11.3. Egypt
- 11.4. Finland
- 11.5. France
- 11.6. Germany
- 11.7. Israel
- 11.8. Italy
- 11.9. Netherlands
- 11.10. Nigeria
- 11.11. Norway
- 11.12. Poland
- 11.13. Qatar
- 11.14. Russia
- 11.15. Saudi Arabia
- 11.16. South Africa
- 11.17. Spain
- 11.18. Sweden
- 11.19. Switzerland
- 11.20. Turkey
- 11.21. United Arab Emirates
- 11.22. United Kingdom
12. Competitive Landscape
- 12.1. FPNV Positioning Matrix
- 12.2. Market Share Analysis, By Key Player
- 12.3. Competitive Scenario Analysis, By Key Player
- 12.3.1. Agreement, Collaboration, & Partnership
- 12.3.1.1. ENGIE Signs Major Biomethane Supply Agreement with Arkema to Further Reduce the Carbon Footprint of its Bio-Based Polyamide 11 Materials
- 12.3.2. New Product Launch & Enhancement
- 12.3.2.1. Arkema Unveils New High-Performance and More Sustainable Solutions
- 12.3.2.2. Avient Launches Nymax BIO Low Water Absorption and Bio-Based Polyamides
- 12.3.1. Agreement, Collaboration, & Partnership
13. Competitive Portfolio
- 13.1. Key Company Profiles
- 13.1.1. AKRO-PLASTIC GmbH
- 13.1.2. Arkema AG
- 13.1.3. Asahi Kasei Corporation
- 13.1.4. Avient Corporation
- 13.1.5. BASF SE
- 13.1.6. Cathay Biotech Inc.
- 13.1.7. Celanese Corporation
- 13.1.8. DuPont de Nemours, Inc.
- 13.1.9. Evonik AG
- 13.1.10. Honeywell International Inc.
- 13.1.11. Indorama Mobility Group
- 13.1.12. Koninklijke DSM N.V.
- 13.1.13. Lanxess AG
- 13.1.14. Novamont S.p.A.
- 13.1.15. Solvay S.A.
- 13.1.16. Toray Industries, Inc.
- 13.2. Key Product Portfolio
14. Appendix
- 14.1. Discussion Guide
- 14.2. License & Pricing
LIST OF FIGURES
- FIGURE 1. BIO-POLYAMIDE MARKET RESEARCH PROCESS
- FIGURE 2. BIO-POLYAMIDE MARKET SIZE, 2023 VS 2030
- FIGURE 3. BIO-POLYAMIDE MARKET SIZE, 2018-2030 (USD MILLION)
- FIGURE 4. BIO-POLYAMIDE MARKET SIZE, BY REGION, 2023 VS 2030 (%)
- FIGURE 5. BIO-POLYAMIDE MARKET SIZE, BY REGION, 2023 VS 2024 VS 2030 (USD MILLION)
- FIGURE 6. BIO-POLYAMIDE MARKET DYNAMICS
- FIGURE 7. BIO-POLYAMIDE MARKET SIZE, BY TYPE, 2023 VS 2030 (%)
- FIGURE 8. BIO-POLYAMIDE MARKET SIZE, BY TYPE, 2023 VS 2024 VS 2030 (USD MILLION)
- FIGURE 9. BIO-POLYAMIDE MARKET SIZE, BY MATERIAL, 2023 VS 2030 (%)
- FIGURE 10. BIO-POLYAMIDE MARKET SIZE, BY MATERIAL, 2023 VS 2024 VS 2030 (USD MILLION)
- FIGURE 11. BIO-POLYAMIDE MARKET SIZE, BY APPLICATION, 2023 VS 2030 (%)
- FIGURE 12. BIO-POLYAMIDE MARKET SIZE, BY APPLICATION, 2023 VS 2024 VS 2030 (USD MILLION)
- FIGURE 13. AMERICAS BIO-POLYAMIDE MARKET SIZE, BY COUNTRY, 2023 VS 2030 (%)
- FIGURE 14. AMERICAS BIO-POLYAMIDE MARKET SIZE, BY COUNTRY, 2023 VS 2024 VS 2030 (USD MILLION)
- FIGURE 15. UNITED STATES BIO-POLYAMIDE MARKET SIZE, BY STATE, 2023 VS 2030 (%)
- FIGURE 16. UNITED STATES BIO-POLYAMIDE MARKET SIZE, BY STATE, 2023 VS 2024 VS 2030 (USD MILLION)
- FIGURE 17. ASIA-PACIFIC BIO-POLYAMIDE MARKET SIZE, BY COUNTRY, 2023 VS 2030 (%)
- FIGURE 18. ASIA-PACIFIC BIO-POLYAMIDE MARKET SIZE, BY COUNTRY, 2023 VS 2024 VS 2030 (USD MILLION)
- FIGURE 19. EUROPE, MIDDLE EAST & AFRICA BIO-POLYAMIDE MARKET SIZE, BY COUNTRY, 2023 VS 2030 (%)
- FIGURE 20. EUROPE, MIDDLE EAST & AFRICA BIO-POLYAMIDE MARKET SIZE, BY COUNTRY, 2023 VS 2024 VS 2030 (USD MILLION)
- FIGURE 21. BIO-POLYAMIDE MARKET, FPNV POSITIONING MATRIX, 2023
- FIGURE 22. BIO-POLYAMIDE MARKET SHARE, BY KEY PLAYER, 2023
LIST OF TABLES
- TABLE 1. BIO-POLYAMIDE MARKET SEGMENTATION & COVERAGE
- TABLE 2. UNITED STATES DOLLAR EXCHANGE RATE, 2018-2023
- TABLE 3. BIO-POLYAMIDE MARKET SIZE, 2018-2030 (USD MILLION)
- TABLE 4. GLOBAL BIO-POLYAMIDE MARKET SIZE, BY REGION, 2018-2030 (USD MILLION)
- TABLE 5. BIO-POLYAMIDE MARKET SIZE, BY TYPE, 2018-2030 (USD MILLION)
- TABLE 6. BIO-POLYAMIDE MARKET SIZE, BY POLYAMIDE 10, BY REGION, 2018-2030 (USD MILLION)
- TABLE 7. BIO-POLYAMIDE MARKET SIZE, BY POLYAMIDE 11, BY REGION, 2018-2030 (USD MILLION)
- TABLE 8. BIO-POLYAMIDE MARKET SIZE, BY POLYAMIDE 12, BY REGION, 2018-2030 (USD MILLION)
- TABLE 9. BIO-POLYAMIDE MARKET SIZE, BY POLYAMIDE 6, BY REGION, 2018-2030 (USD MILLION)
- TABLE 10. BIO-POLYAMIDE MARKET SIZE, BY POLYAMIDE 66, BY REGION, 2018-2030 (USD MILLION)
- TABLE 11. BIO-POLYAMIDE MARKET SIZE, BY MATERIAL, 2018-2030 (USD MILLION)
- TABLE 12. BIO-POLYAMIDE MARKET SIZE, BY AMINO ACIDS, BY REGION, 2018-2030 (USD MILLION)
- TABLE 13. BIO-POLYAMIDE MARKET SIZE, BY DIACIDS, BY REGION, 2018-2030 (USD MILLION)
- TABLE 14. BIO-POLYAMIDE MARKET SIZE, BY DIAMINES, BY REGION, 2018-2030 (USD MILLION)
- TABLE 15. BIO-POLYAMIDE MARKET SIZE, BY LACTAMS, BY REGION, 2018-2030 (USD MILLION)
- TABLE 16. BIO-POLYAMIDE MARKET SIZE, BY APPLICATION, 2018-2030 (USD MILLION)
- TABLE 17. BIO-POLYAMIDE MARKET SIZE, BY AUTOMOTIVE, BY REGION, 2018-2030 (USD MILLION)
- TABLE 18. BIO-POLYAMIDE MARKET SIZE, BY CONSUMER GOODS, BY REGION, 2018-2030 (USD MILLION)
- TABLE 19. BIO-POLYAMIDE MARKET SIZE, BY ELECTRICAL & ELECTRONICS, BY REGION, 2018-2030 (USD MILLION)
- TABLE 20. BIO-POLYAMIDE MARKET SIZE, BY FILM & COATING, BY REGION, 2018-2030 (USD MILLION)
- TABLE 21. BIO-POLYAMIDE MARKET SIZE, BY INDUSTRIAL, BY REGION, 2018-2030 (USD MILLION)
- TABLE 22. AMERICAS BIO-POLYAMIDE MARKET SIZE, BY TYPE, 2018-2030 (USD MILLION)
- TABLE 23. AMERICAS BIO-POLYAMIDE MARKET SIZE, BY MATERIAL, 2018-2030 (USD MILLION)
- TABLE 24. AMERICAS BIO-POLYAMIDE MARKET SIZE, BY APPLICATION, 2018-2030 (USD MILLION)
- TABLE 25. AMERICAS BIO-POLYAMIDE MARKET SIZE, BY COUNTRY, 2018-2030 (USD MILLION)
- TABLE 26. ARGENTINA BIO-POLYAMIDE MARKET SIZE, BY TYPE, 2018-2030 (USD MILLION)
- TABLE 27. ARGENTINA BIO-POLYAMIDE MARKET SIZE, BY MATERIAL, 2018-2030 (USD MILLION)
- TABLE 28. ARGENTINA BIO-POLYAMIDE MARKET SIZE, BY APPLICATION, 2018-2030 (USD MILLION)
- TABLE 29. BRAZIL BIO-POLYAMIDE MARKET SIZE, BY TYPE, 2018-2030 (USD MILLION)
- TABLE 30. BRAZIL BIO-POLYAMIDE MARKET SIZE, BY MATERIAL, 2018-2030 (USD MILLION)
- TABLE 31. BRAZIL BIO-POLYAMIDE MARKET SIZE, BY APPLICATION, 2018-2030 (USD MILLION)
- TABLE 32. CANADA BIO-POLYAMIDE MARKET SIZE, BY TYPE, 2018-2030 (USD MILLION)
- TABLE 33. CANADA BIO-POLYAMIDE MARKET SIZE, BY MATERIAL, 2018-2030 (USD MILLION)
- TABLE 34. CANADA BIO-POLYAMIDE MARKET SIZE, BY APPLICATION, 2018-2030 (USD MILLION)
- TABLE 35. MEXICO BIO-POLYAMIDE MARKET SIZE, BY TYPE, 2018-2030 (USD MILLION)
- TABLE 36. MEXICO BIO-POLYAMIDE MARKET SIZE, BY MATERIAL, 2018-2030 (USD MILLION)
- TABLE 37. MEXICO BIO-POLYAMIDE MARKET SIZE, BY APPLICATION, 2018-2030 (USD MILLION)
- TABLE 38. UNITED STATES BIO-POLYAMIDE MARKET SIZE, BY TYPE, 2018-2030 (USD MILLION)
- TABLE 39. UNITED STATES BIO-POLYAMIDE MARKET SIZE, BY MATERIAL, 2018-2030 (USD MILLION)
- TABLE 40. UNITED STATES BIO-POLYAMIDE MARKET SIZE, BY APPLICATION, 2018-2030 (USD MILLION)
- TABLE 41. UNITED STATES BIO-POLYAMIDE MARKET SIZE, BY STATE, 2018-2030 (USD MILLION)
- TABLE 42. ASIA-PACIFIC BIO-POLYAMIDE MARKET SIZE, BY TYPE, 2018-2030 (USD MILLION)
- TABLE 43. ASIA-PACIFIC BIO-POLYAMIDE MARKET SIZE, BY MATERIAL, 2018-2030 (USD MILLION)
- TABLE 44. ASIA-PACIFIC BIO-POLYAMIDE MARKET SIZE, BY APPLICATION, 2018-2030 (USD MILLION)
- TABLE 45. ASIA-PACIFIC BIO-POLYAMIDE MARKET SIZE, BY COUNTRY, 2018-2030 (USD MILLION)
- TABLE 46. AUSTRALIA BIO-POLYAMIDE MARKET SIZE, BY TYPE, 2018-2030 (USD MILLION)
- TABLE 47. AUSTRALIA BIO-POLYAMIDE MARKET SIZE, BY MATERIAL, 2018-2030 (USD MILLION)
- TABLE 48. AUSTRALIA BIO-POLYAMIDE MARKET SIZE, BY APPLICATION, 2018-2030 (USD MILLION)
- TABLE 49. CHINA BIO-POLYAMIDE MARKET SIZE, BY TYPE, 2018-2030 (USD MILLION)
- TABLE 50. CHINA BIO-POLYAMIDE MARKET SIZE, BY MATERIAL, 2018-2030 (USD MILLION)
- TABLE 51. CHINA BIO-POLYAMIDE MARKET SIZE, BY APPLICATION, 2018-2030 (USD MILLION)
- TABLE 52. INDIA BIO-POLYAMIDE MARKET SIZE, BY TYPE, 2018-2030 (USD MILLION)
- TABLE 53. INDIA BIO-POLYAMIDE MARKET SIZE, BY MATERIAL, 2018-2030 (USD MILLION)
- TABLE 54. INDIA BIO-POLYAMIDE MARKET SIZE, BY APPLICATION, 2018-2030 (USD MILLION)
- TABLE 55. INDONESIA BIO-POLYAMIDE MARKET SIZE, BY TYPE, 2018-2030 (USD MILLION)
- TABLE 56. INDONESIA BIO-POLYAMIDE MARKET SIZE, BY MATERIAL, 2018-2030 (USD MILLION)
- TABLE 57. INDONESIA BIO-POLYAMIDE MARKET SIZE, BY APPLICATION, 2018-2030 (USD MILLION)
- TABLE 58. JAPAN BIO-POLYAMIDE MARKET SIZE, BY TYPE, 2018-2030 (USD MILLION)
- TABLE 59. JAPAN BIO-POLYAMIDE MARKET SIZE, BY MATERIAL, 2018-2030 (USD MILLION)
- TABLE 60. JAPAN BIO-POLYAMIDE MARKET SIZE, BY APPLICATION, 2018-2030 (USD MILLION)
- TABLE 61. MALAYSIA BIO-POLYAMIDE MARKET SIZE, BY TYPE, 2018-2030 (USD MILLION)
- TABLE 62. MALAYSIA BIO-POLYAMIDE MARKET SIZE, BY MATERIAL, 2018-2030 (USD MILLION)
- TABLE 63. MALAYSIA BIO-POLYAMIDE MARKET SIZE, BY APPLICATION, 2018-2030 (USD MILLION)
- TABLE 64. PHILIPPINES BIO-POLYAMIDE MARKET SIZE, BY TYPE, 2018-2030 (USD MILLION)
- TABLE 65. PHILIPPINES BIO-POLYAMIDE MARKET SIZE, BY MATERIAL, 2018-2030 (USD MILLION)
- TABLE 66. PHILIPPINES BIO-POLYAMIDE MARKET SIZE, BY APPLICATION, 2018-2030 (USD MILLION)
- TABLE 67. SINGAPORE BIO-POLYAMIDE MARKET SIZE, BY TYPE, 2018-2030 (USD MILLION)
- TABLE 68. SINGAPORE BIO-POLYAMIDE MARKET SIZE, BY MATERIAL, 2018-2030 (USD MILLION)
- TABLE 69. SINGAPORE BIO-POLYAMIDE MARKET SIZE, BY APPLICATION, 2018-2030 (USD MILLION)
- TABLE 70. SOUTH KOREA BIO-POLYAMIDE MARKET SIZE, BY TYPE, 2018-2030 (USD MILLION)
- TABLE 71. SOUTH KOREA BIO-POLYAMIDE MARKET SIZE, BY MATERIAL, 2018-2030 (USD MILLION)
- TABLE 72. SOUTH KOREA BIO-POLYAMIDE MARKET SIZE, BY APPLICATION, 2018-2030 (USD MILLION)
- TABLE 73. TAIWAN BIO-POLYAMIDE MARKET SIZE, BY TYPE, 2018-2030 (USD MILLION)
- TABLE 74. TAIWAN BIO-POLYAMIDE MARKET SIZE, BY MATERIAL, 2018-2030 (USD MILLION)
- TABLE 75. TAIWAN BIO-POLYAMIDE MARKET SIZE, BY APPLICATION, 2018-2030 (USD MILLION)
- TABLE 76. THAILAND BIO-POLYAMIDE MARKET SIZE, BY TYPE, 2018-2030 (USD MILLION)
- TABLE 77. THAILAND BIO-POLYAMIDE MARKET SIZE, BY MATERIAL, 2018-2030 (USD MILLION)
- TABLE 78. THAILAND BIO-POLYAMIDE MARKET SIZE, BY APPLICATION, 2018-2030 (USD MILLION)
- TABLE 79. VIETNAM BIO-POLYAMIDE MARKET SIZE, BY TYPE, 2018-2030 (USD MILLION)
- TABLE 80. VIETNAM BIO-POLYAMIDE MARKET SIZE, BY MATERIAL, 2018-2030 (USD MILLION)
- TABLE 81. VIETNAM BIO-POLYAMIDE MARKET SIZE, BY APPLICATION, 2018-2030 (USD MILLION)
- TABLE 82. EUROPE, MIDDLE EAST & AFRICA BIO-POLYAMIDE MARKET SIZE, BY TYPE, 2018-2030 (USD MILLION)
- TABLE 83. EUROPE, MIDDLE EAST & AFRICA BIO-POLYAMIDE MARKET SIZE, BY MATERIAL, 2018-2030 (USD MILLION)
- TABLE 84. EUROPE, MIDDLE EAST & AFRICA BIO-POLYAMIDE MARKET SIZE, BY APPLICATION, 2018-2030 (USD MILLION)
- TABLE 85. EUROPE, MIDDLE EAST & AFRICA BIO-POLYAMIDE MARKET SIZE, BY COUNTRY, 2018-2030 (USD MILLION)
- TABLE 86. DENMARK BIO-POLYAMIDE MARKET SIZE, BY TYPE, 2018-2030 (USD MILLION)
- TABLE 87. DENMARK BIO-POLYAMIDE MARKET SIZE, BY MATERIAL, 2018-2030 (USD MILLION)
- TABLE 88. DENMARK BIO-POLYAMIDE MARKET SIZE, BY APPLICATION, 2018-2030 (USD MILLION)
- TABLE 89. EGYPT BIO-POLYAMIDE MARKET SIZE, BY TYPE, 2018-2030 (USD MILLION)
- TABLE 90. EGYPT BIO-POLYAMIDE MARKET SIZE, BY MATERIAL, 2018-2030 (USD MILLION)
- TABLE 91. EGYPT BIO-POLYAMIDE MARKET SIZE, BY APPLICATION, 2018-2030 (USD MILLION)
- TABLE 92. FINLAND BIO-POLYAMIDE MARKET SIZE, BY TYPE, 2018-2030 (USD MILLION)
- TABLE 93. FINLAND BIO-POLYAMIDE MARKET SIZE, BY MATERIAL, 2018-2030 (USD MILLION)
- TABLE 94. FINLAND BIO-POLYAMIDE MARKET SIZE, BY APPLICATION, 2018-2030 (USD MILLION)
- TABLE 95. FRANCE BIO-POLYAMIDE MARKET SIZE, BY TYPE, 2018-2030 (USD MILLION)
- TABLE 96. FRANCE BIO-POLYAMIDE MARKET SIZE, BY MATERIAL, 2018-2030 (USD MILLION)
- TABLE 97. FRANCE BIO-POLYAMIDE MARKET SIZE, BY APPLICATION, 2018-2030 (USD MILLION)
- TABLE 98. GERMANY BIO-POLYAMIDE MARKET SIZE, BY TYPE, 2018-2030 (USD MILLION)
- TABLE 99. GERMANY BIO-POLYAMIDE MARKET SIZE, BY MATERIAL, 2018-2030 (USD MILLION)
- TABLE 100. GERMANY BIO-POLYAMIDE MARKET SIZE, BY APPLICATION, 2018-2030 (USD MILLION)
- TABLE 101. ISRAEL BIO-POLYAMIDE MARKET SIZE, BY TYPE, 2018-2030 (USD MILLION)
- TABLE 102. ISRAEL BIO-POLYAMIDE MARKET SIZE, BY MATERIAL, 2018-2030 (USD MILLION)
- TABLE 103. ISRAEL BIO-POLYAMIDE MARKET SIZE, BY APPLICATION, 2018-2030 (USD MILLION)
- TABLE 104. ITALY BIO-POLYAMIDE MARKET SIZE, BY TYPE, 2018-2030 (USD MILLION)
- TABLE 105. ITALY BIO-POLYAMIDE MARKET SIZE, BY MATERIAL, 2018-2030 (USD MILLION)
- TABLE 106. ITALY BIO-POLYAMIDE MARKET SIZE, BY APPLICATION, 2018-2030 (USD MILLION)
- TABLE 107. NETHERLANDS BIO-POLYAMIDE MARKET SIZE, BY TYPE, 2018-2030 (USD MILLION)
- TABLE 108. NETHERLANDS BIO-POLYAMIDE MARKET SIZE, BY MATERIAL, 2018-2030 (USD MILLION)
- TABLE 109. NETHERLANDS BIO-POLYAMIDE MARKET SIZE, BY APPLICATION, 2018-2030 (USD MILLION)
- TABLE 110. NIGERIA BIO-POLYAMIDE MARKET SIZE, BY TYPE, 2018-2030 (USD MILLION)
- TABLE 111. NIGERIA BIO-POLYAMIDE MARKET SIZE, BY MATERIAL, 2018-2030 (USD MILLION)
- TABLE 112. NIGERIA BIO-POLYAMIDE MARKET SIZE, BY APPLICATION, 2018-2030 (USD MILLION)
- TABLE 113. NORWAY BIO-POLYAMIDE MARKET SIZE, BY TYPE, 2018-2030 (USD MILLION)
- TABLE 114. NORWAY BIO-POLYAMIDE MARKET SIZE, BY MATERIAL, 2018-2030 (USD MILLION)
- TABLE 115. NORWAY BIO-POLYAMIDE MARKET SIZE, BY APPLICATION, 2018-2030 (USD MILLION)
- TABLE 116. POLAND BIO-POLYAMIDE MARKET SIZE, BY TYPE, 2018-2030 (USD MILLION)
- TABLE 117. POLAND BIO-POLYAMIDE MARKET SIZE, BY MATERIAL, 2018-2030 (USD MILLION)
- TABLE 118. POLAND BIO-POLYAMIDE MARKET SIZE, BY APPLICATION, 2018-2030 (USD MILLION)
- TABLE 119. QATAR BIO-POLYAMIDE MARKET SIZE, BY TYPE, 2018-2030 (USD MILLION)
- TABLE 120. QATAR BIO-POLYAMIDE MARKET SIZE, BY MATERIAL, 2018-2030 (USD MILLION)
- TABLE 121. QATAR BIO-POLYAMIDE MARKET SIZE, BY APPLICATION, 2018-2030 (USD MILLION)
- TABLE 122. RUSSIA BIO-POLYAMIDE MARKET SIZE, BY TYPE, 2018-2030 (USD MILLION)
- TABLE 123. RUSSIA BIO-POLYAMIDE MARKET SIZE, BY MATERIAL, 2018-2030 (USD MILLION)
- TABLE 124. RUSSIA BIO-POLYAMIDE MARKET SIZE, BY APPLICATION, 2018-2030 (USD MILLION)
- TABLE 125. SAUDI ARABIA BIO-POLYAMIDE MARKET SIZE, BY TYPE, 2018-2030 (USD MILLION)
- TABLE 126. SAUDI ARABIA BIO-POLYAMIDE MARKET SIZE, BY MATERIAL, 2018-2030 (USD MILLION)
- TABLE 127. SAUDI ARABIA BIO-POLYAMIDE MARKET SIZE, BY APPLICATION, 2018-2030 (USD MILLION)
- TABLE 128. SOUTH AFRICA BIO-POLYAMIDE MARKET SIZE, BY TYPE, 2018-2030 (USD MILLION)
- TABLE 129. SOUTH AFRICA BIO-POLYAMIDE MARKET SIZE, BY MATERIAL, 2018-2030 (USD MILLION)
- TABLE 130. SOUTH AFRICA BIO-POLYAMIDE MARKET SIZE, BY APPLICATION, 2018-2030 (USD MILLION)
- TABLE 131. SPAIN BIO-POLYAMIDE MARKET SIZE, BY TYPE, 2018-2030 (USD MILLION)
- TABLE 132. SPAIN BIO-POLYAMIDE MARKET SIZE, BY MATERIAL, 2018-2030 (USD MILLION)
- TABLE 133. SPAIN BIO-POLYAMIDE MARKET SIZE, BY APPLICATION, 2018-2030 (USD MILLION)
- TABLE 134. SWEDEN BIO-POLYAMIDE MARKET SIZE, BY TYPE, 2018-2030 (USD MILLION)
- TABLE 135. SWEDEN BIO-POLYAMIDE MARKET SIZE, BY MATERIAL, 2018-2030 (USD MILLION)
- TABLE 136. SWEDEN BIO-POLYAMIDE MARKET SIZE, BY APPLICATION, 2018-2030 (USD MILLION)
- TABLE 137. SWITZERLAND BIO-POLYAMIDE MARKET SIZE, BY TYPE, 2018-2030 (USD MILLION)
- TABLE 138. SWITZERLAND BIO-POLYAMIDE MARKET SIZE, BY MATERIAL, 2018-2030 (USD MILLION)
- TABLE 139. SWITZERLAND BIO-POLYAMIDE MARKET SIZE, BY APPLICATION, 2018-2030 (USD MILLION)
- TABLE 140. TURKEY BIO-POLYAMIDE MARKET SIZE, BY TYPE, 2018-2030 (USD MILLION)
- TABLE 141. TURKEY BIO-POLYAMIDE MARKET SIZE, BY MATERIAL, 2018-2030 (USD MILLION)
- TABLE 142. TURKEY BIO-POLYAMIDE MARKET SIZE, BY APPLICATION, 2018-2030 (USD MILLION)
- TABLE 143. UNITED ARAB EMIRATES BIO-POLYAMIDE MARKET SIZE, BY TYPE, 2018-2030 (USD MILLION)
- TABLE 144. UNITED ARAB EMIRATES BIO-POLYAMIDE MARKET SIZE, BY MATERIAL, 2018-2030 (USD MILLION)
- TABLE 145. UNITED ARAB EMIRATES BIO-POLYAMIDE MARKET SIZE, BY APPLICATION, 2018-2030 (USD MILLION)
- TABLE 146. UNITED KINGDOM BIO-POLYAMIDE MARKET SIZE, BY TYPE, 2018-2030 (USD MILLION)
- TABLE 147. UNITED KINGDOM BIO-POLYAMIDE MARKET SIZE, BY MATERIAL, 2018-2030 (USD MILLION)
- TABLE 148. UNITED KINGDOM BIO-POLYAMIDE MARKET SIZE, BY APPLICATION, 2018-2030 (USD MILLION)
- TABLE 149. BIO-POLYAMIDE MARKET, FPNV POSITIONING MATRIX, 2023
- TABLE 150. BIO-POLYAMIDE MARKET SHARE, BY KEY PLAYER, 2023
- TABLE 151. BIO-POLYAMIDE MARKET LICENSE & PRICING
 聚酰胺市场:按产品类型、最终用户产业划分 - 2024-2030 年全球预测
 2024-2032 年按产品类型、应用、最终用途和地区分類的生物聚酰胺市场报告
 电子保护设备 (EPD) 市场中的聚酰胺按产品(PA 6、PA 66、PA 4,6、PA 612 等)、应用(MCB、MCCB、继电器、接触器、端子块)和区域 2024-2032
 全球聚酰胺市场规模、份额、成长分析,按类型、按应用、按最终用途行业 - 按行业预测,2024-2031 年
 聚酰胺 (PA) 6:市场占有率分析、产业趋势与统计、成长预测(2024-2029 年)
 3D 聚酰胺市场报告:2030 年趋势、预测与竞争分析
 全球聚酰胺市场 - 2023-2030
 全球聚酰胺市场:按製程、类型、用途、地区划分 - 2028 年预测
 透明聚酰胺市场 - 2018-2028 年全球产业规模、份额、趋势、机会和预测,按类型、等级、最终用户、地区和竞争细分
 全球生物聚酰胺市场评估:按类型、产品类型、最终用户、地区、机会、预测(2016-2030)