


 |
市场调查报告书
商品编码
1415347
垂直起降机场市场:按类型、地点划分 - 2024-2030 年全球预测Vertiports Market by Type (Verti Hubs, Vertibases, Vertipads), Location (Ground-based, Rooftop / Elevated) - Global Forecast 2024-2030 |
||||||
※ 本网页内容可能与最新版本有所差异。详细情况请与我们联繫。
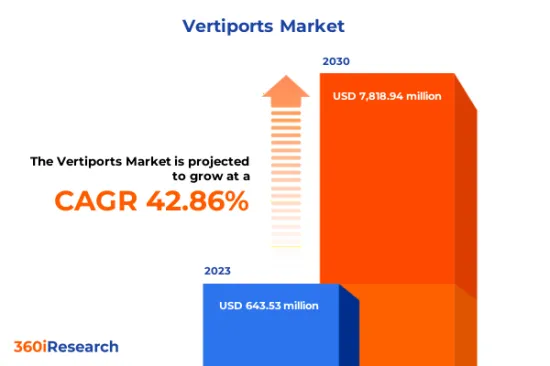
预计2023年Vertiport市场规模为6.4353亿美元,2024年将达到9.0211亿美元,2030年将达78.1894亿美元,复合年增长率为42.86%。
垂直起降机场全球市场
| 主要市场统计 | |
|---|---|
| 基准年[2023] | 64353万美元 |
| 预测年份 [2024] | 9.0211亿美元 |
| 预测年份 [2030] | 7,818,940,000 美元 |
| 复合年增长率(%) | 42.86% |
垂直起降机场是经过策略设计的基础设施,作为电动垂直起降 (eVTOL) 车辆(例如城市空中计程车、货运无人机和其他下一代空中运输解决方案)的营运、维护和管理中心。垂直起落机场是城市空中交通 (UAM) 生态系统的关键组成部分,旨在有效地将航空运输网路整合到现有的城市环境中,而不会对地面系统造成重大干扰。垂直起落机场包括多种促进电动垂直起降车辆无缝运行的设施,包括着陆垫片和平台、客运码头、飞机储存设施、电池和氢燃料电池充电站、空中交通管制系统和维护中心等要素。部署垂直起落机场对于在世界各地实现智慧城市和永续交通倡议至关重要。由于多种因素,垂直起降机场市场正在经历显着增长,包括由于城市交通拥堵问题日益严重而导致的快速都市化,以及空中计程车和城市空中交通服务的可能性不断扩大。
此外,eVTOL 技术的不断进步正在支持 Vertiport 市场的向上成长。儘管具有成长潜力,但垂直起落机场市场面临着诸如高开发成本以及与垂直起落场相关的航程和负载容量限制等挑战。另一方面,垂直起落机场开发的持续技术进步以及垂直起落机场与机场和火车站的一体化程度不断提高,将为未来几年的垂直起落机场製造商提供机会。
区域洞察
由于快速的都市化和对高效交通系统的需求不断增长,全球对垂直起落机场的需求正在迅速增长。在美洲,由于先进的基础设施和主要城市日益拥堵,北美的垂直起降机场正在显着成长。产业相关人员之间的投资和合作大幅增加,以开发尖端的电动垂直起降飞机和支援它们的垂直起降基础设施。包括巴西和墨西哥在内的拉丁美洲国家表示有兴趣开发城市空中运输解决方案,包括垂直机场基础设施。特别是在巴西,该国最大的城市圣保罗已开始大力投资智慧城市计划,包括透过整合垂直机场进行交通创新。亚太地区持续快速的都市化趋势将导致交通需求激增,导致道路交通拥挤。随着中国和印度等国家城市人口密度的增加,政府和私人营业单位正在寻求有效的方法,透过为城市空中交通(UAM) 提供垂直起降(VTOL) 基础设施来缓解交通状况。我们认识到垂直起降机场作为交通运输工具的潜力。方法。在EMEA地区,技术进步是推动垂直起降机场市场扩大的关键,因为分散式电力推进系统等技术创新使eVTOL飞机能够实现垂直起降能力而不产生过多的噪音污染,从而发挥了作用。
此外,政府的支持政策也对垂直起降市场的成长做出了重大贡献。欧盟航空安全局 (EASA) 和阿拉伯联合大公国民航局 (GCAA) 等监管机构正在努力製定城市空中运输(包括垂直机场)的全面认证框架和操作指南。在中东和非洲,随着各国政府积极探索城市空中交通,使其经济多元化,摆脱对石油的依赖,并增加快速发展的城市内的连通性,对垂直起落机场基础设施的投资正在增加。
FPNV定位矩阵
FPNV定位矩阵对于评估Vertiport市场至关重要。我们检视与业务策略和产品满意度相关的关键指标,以对供应商进行全面评估。这种深入的分析使用户能够根据自己的要求做出明智的决策。根据评估,供应商被分为四个成功程度不同的像限:前沿(F)、探路者(P)、利基(N)和重要(V)。
市场占有率分析
市场占有率分析是一种综合工具,可对 Vertiport 市场中供应商的现状进行富有洞察力和深入的研究。全面比较和分析供应商在整体收益、基本客群和其他关键指标方面的贡献,以便更好地了解公司的绩效及其在争夺市场占有率时面临的挑战。此外,该分析还提供了对该行业竞争特征的宝贵考察,包括在研究基准年观察到的累积、分散主导地位和合併特征等因素。这种详细程度的提高使供应商能够做出更明智的决策并制定有效的策略,从而在市场上获得竞争优势。
该报告对以下几个方面提供了宝贵的见解:
1-市场渗透率:提供有关主要企业所服务的市场的全面资讯。
2-市场开拓:我们深入研究利润丰厚的新兴市场,并分析它们在成熟细分市场中的渗透率。
3- 市场多元化:提供有关新产品发布、开拓地区、最新发展和投资的详细资讯。
4-竞争力评估与资讯:对主要企业的市场占有率、策略、产品、认证、监管状况、专利状况、製造能力等进行全面评估。
5- 产品开发与创新:提供对未来技术、研发活动和突破性产品开发的见解。
本报告解决了以下关键问题:
1-Vertiport市场的市场规模和预测是多少?
2-Vertiport 市场预测期内需要考虑投资的产品、细分市场、应用程式和领域有哪些?
3-Vertiport 市场的技术趋势和法律规范是什么?
4-Vertiport 市场主要供应商的市场占有率是多少?
5-进入垂直起降机场市场的适当型态或策略手段是什么?
目录
第一章 前言
第二章调查方法
第三章执行摘要
第四章市场概况
第五章市场洞察
- 市场动态
- 促进因素
- 快速都市化加剧了城市的交通拥堵问题
- eVTOL 技术不断进步
- 扩大空中计程车和城市空中交通服务的可能性
- 抑制因素
- 垂直起落机场开发成本高
- 机会
- 垂直机场开发的持续技术进步
- 加强垂直机场与机场和火车站的整合
- 任务
- 与垂直起落场相关的限制范围和有效载荷
- 促进因素
- 市场区隔分析
- 类型:更多采用 Verti 轮毂进行电动垂直起降
- 地点:Vertiport 扩大屋顶/高架用途并最大化垂直空间
- 市场趋势分析
- 高通膨的累积效应
- 波特五力分析
- 价值炼和关键路径分析
- 法律规范
第六章 垂直起降机场市场:依类型
- 维蒂轮毂
- 伯蒂·巴斯
- 垫片
第 7 章垂直起降机场市场(按地点)
- 地面基地
- 屋顶/高架
第八章 美洲垂直起降市场
- 阿根廷
- 巴西
- 加拿大
- 墨西哥
- 美国
第九章亚太地区垂直起降市场
- 澳洲
- 中国
- 印度
- 印尼
- 日本
- 马来西亚
- 菲律宾
- 新加坡
- 韩国
- 台湾
- 泰国
- 越南
第十章 欧洲、中东和非洲的垂直起降市场
- 丹麦
- 埃及
- 芬兰
- 法国
- 德国
- 以色列
- 义大利
- 荷兰
- 奈及利亚
- 挪威
- 波兰
- 卡达
- 俄罗斯
- 沙乌地阿拉伯
- 南非
- 西班牙
- 瑞典
- 瑞士
- 土耳其
- 阿拉伯聯合大公国
- 英国
第十一章竞争形势
- FPNV定位矩阵
- 市场占有率分析:主要企业
- 主要企业竞争情境分析
- 合约、合作和伙伴关係
- 新产品发布和功能增强
第12章竞争产品组合
- 主要公司简介
- Aeroauto LLC
- airsight GmbH
- ANA HOLDINGS INC
- Aeroports de Paris SA
- Bayards Constructions Group
- Ferrovial SE
- Giancarlo Zema Design Group
- Groupe ADP
- Hanwha
- Hyundai E&C
- Joby Aviation, Inc.
- Kookiejar of Sweden
- Lilium GmbH
- Mott MacDonald
- Siemens AG
- SITA
- Skyports Limited
- Skyscape Corporation
- Skyway
- Urban-Air Port Ltd.
- UrbanV SpA
- Varon Vehicles Corporation
- Vertiko Mobility Inc.
- Volatus Infrastructure & Energy Solutions
- Volocopter GmbH
- VPorts
- 主要产品系列
第十三章附录
- 讨论指南
- 关于许可证和定价
[183 Pages Report] The Vertiports Market size was estimated at USD 643.53 million in 2023 and expected to reach USD 902.11 million in 2024, at a CAGR 42.86% to reach USD 7,818.94 million by 2030.
Global Vertiports Market
| KEY MARKET STATISTICS | |
|---|---|
| Base Year [2023] | USD 643.53 million |
| Estimated Year [2024] | USD 902.11 million |
| Forecast Year [2030] | USD 7,818.94 million |
| CAGR (%) | 42.86% |
A vertiport is a strategically designed infrastructure facility that serves as a hub for operating, maintaining, and managing electric vertical takeoff and landing (eVTOL) vehicles, such as urban air taxis, cargo drones, and other next-generation aerial mobility solutions. Vertiports are essential components of urban air mobility (UAM) ecosystems and aim to efficiently integrate aerial transportation networks into existing urban environments without causing significant disruptions to ground-based systems. Vertiports have multiple elements that facilitate seamless operations for eVTOL vehicles, including landing pads or platforms, passenger terminals, aircraft storage facilities, charging stations for batteries or hydrogen fuel cell refueling, air traffic control systems, and maintenance centers. Implementing vertiports is crucial in realizing smart cities and sustainable transportation initiatives worldwide. The vertiport market is experiencing significant growth from various factors, including rapid urbanization with increasing traffic congestion problems across cities and expanding the potential for air taxis and urban air mobility services.
Moreover, increasing advancements in eVTOL technologies support the vertiport market's upward growth. Despite its potential growth, the vertiport market faces challenges, such as the high cost of development and the limited range and payload associated with vertiports. On the other hand, continuous technological advancements in vertiport development and increasing vertiport integration with airports and train stations create an opportunity for vertiport manufacturers in upcoming years.
Regional Insights
The demand for vertiports has surged globally due to rapid urbanization and the increased need for efficient transportation systems. In the Americas, North America has been witnessing significant development of vertiport due to its advanced infrastructure and growing congestion in major cities. There has been a substantial surge in investments and collaborations among industry players to develop cutting-edge eVTOL aircraft and supporting infrastructure like vertiports. Latin American countries, including Brazil and Mexico, have shown interest in exploring urban air mobility solutions, which include vertiport infrastructure. In Brazil particularly, Sao Paulo, the country's largest city, has begun investing heavily in smart city initiatives encompassing transportation innovation through vertiport integration. The ongoing trend of rapid urbanization in the APAC region leads to a surge in transportation demand, resulting in traffic congestion on roads. As cities become more densely populated in countries including China and India, governments and private entities recognize the potential of vertiports as an efficient way to alleviate traffic conditions by providing vertical takeoff and landing (VTOL) infrastructure for Urban Air Mobility (UAM). In the EMEA region, technological advancements play a critical role in propelling the expansion of the vertiport market as innovations such as distributed electric propulsion systems enable eVTOL aircraft to achieve vertical takeoff and landing capabilities without excessive noise pollution.
Moreover, supportive government policies also contribute significantly to the growth of the vertiport market. Regulatory bodies, including the European Union Aviation Safety Agency (EASA) and the United Arab Emirates General Civil Aviation Authority (GCAA), have been working to develop comprehensive certification frameworks and operational guidelines for urban air mobility, including vertiports. In the Middle East and Africa, investment in vertiport infrastructure is surging as governments actively explore UAM to diversify their economies away from oil dependency and enhance connectivity within rapidly growing cities.
FPNV Positioning Matrix
The FPNV Positioning Matrix is pivotal in evaluating the Vertiports Market. It offers a comprehensive assessment of vendors, examining key metrics related to Business Strategy and Product Satisfaction. This in-depth analysis empowers users to make well-informed decisions aligned with their requirements. Based on the evaluation, the vendors are then categorized into four distinct quadrants representing varying levels of success: Forefront (F), Pathfinder (P), Niche (N), or Vital (V).
Market Share Analysis
The Market Share Analysis is a comprehensive tool that provides an insightful and in-depth examination of the current state of vendors in the Vertiports Market. By meticulously comparing and analyzing vendor contributions in terms of overall revenue, customer base, and other key metrics, we can offer companies a greater understanding of their performance and the challenges they face when competing for market share. Additionally, this analysis provides valuable insights into the competitive nature of the sector, including factors such as accumulation, fragmentation dominance, and amalgamation traits observed over the base year period studied. With this expanded level of detail, vendors can make more informed decisions and devise effective strategies to gain a competitive edge in the market.
Key Company Profiles
The report delves into recent significant developments in the Vertiports Market, highlighting leading vendors and their innovative profiles. These include Aeroauto LLC, airsight GmbH, ANA HOLDINGS INC, Aeroports de Paris SA, Bayards Constructions Group, Ferrovial S.E., Giancarlo Zema Design Group, Groupe ADP, Hanwha, Hyundai E&C, Joby Aviation, Inc., Kookiejar of Sweden, Lilium GmbH, Mott MacDonald, Siemens AG, SITA, Skyports Limited, Skyscape Corporation, Skyway, Urban-Air Port Ltd., UrbanV S.p.A, Varon Vehicles Corporation, Vertiko Mobility Inc., Volatus Infrastructure & Energy Solutions, Volocopter GmbH, and VPorts.
Market Segmentation & Coverage
This research report categorizes the Vertiports Market to forecast the revenues and analyze trends in each of the following sub-markets:
- Type
- Verti Hubs
- Vertibases
- Vertipads
- Location
- Ground-based
- Rooftop / Elevated
- Region
- Americas
- Argentina
- Brazil
- Canada
- Mexico
- United States
- California
- Florida
- Illinois
- New York
- Ohio
- Pennsylvania
- Texas
- Asia-Pacific
- Australia
- China
- India
- Indonesia
- Japan
- Malaysia
- Philippines
- Singapore
- South Korea
- Taiwan
- Thailand
- Vietnam
- Europe, Middle East & Africa
- Denmark
- Egypt
- Finland
- France
- Germany
- Israel
- Italy
- Netherlands
- Nigeria
- Norway
- Poland
- Qatar
- Russia
- Saudi Arabia
- South Africa
- Spain
- Sweden
- Switzerland
- Turkey
- United Arab Emirates
- United Kingdom
- Americas
The report offers valuable insights on the following aspects:
1. Market Penetration: It presents comprehensive information on the market provided by key players.
2. Market Development: It delves deep into lucrative emerging markets and analyzes the penetration across mature market segments.
3. Market Diversification: It provides detailed information on new product launches, untapped geographic regions, recent developments, and investments.
4. Competitive Assessment & Intelligence: It conducts an exhaustive assessment of market shares, strategies, products, certifications, regulatory approvals, patent landscape, and manufacturing capabilities of the leading players.
5. Product Development & Innovation: It offers intelligent insights on future technologies, R&D activities, and breakthrough product developments.
The report addresses key questions such as:
1. What is the market size and forecast of the Vertiports Market?
2. Which products, segments, applications, and areas should one consider investing in over the forecast period in the Vertiports Market?
3. What are the technology trends and regulatory frameworks in the Vertiports Market?
4. What is the market share of the leading vendors in the Vertiports Market?
5. Which modes and strategic moves are suitable for entering the Vertiports Market?
Table of Contents
1. Preface
- 1.1. Objectives of the Study
- 1.2. Market Segmentation & Coverage
- 1.3. Years Considered for the Study
- 1.4. Currency & Pricing
- 1.5. Language
- 1.6. Limitations
- 1.7. Assumptions
- 1.8. Stakeholders
2. Research Methodology
- 2.1. Define: Research Objective
- 2.2. Determine: Research Design
- 2.3. Prepare: Research Instrument
- 2.4. Collect: Data Source
- 2.5. Analyze: Data Interpretation
- 2.6. Formulate: Data Verification
- 2.7. Publish: Research Report
- 2.8. Repeat: Report Update
3. Executive Summary
4. Market Overview
- 4.1. Introduction
- 4.2. Vertiports Market, by Region
5. Market Insights
- 5.1. Market Dynamics
- 5.1.1. Drivers
- 5.1.1.1. Rapid urbanization with increasing traffic congestion problems across cities
- 5.1.1.2. Increasing advancements in eVTOL technologies
- 5.1.1.3. Expanding potential for air taxi and urban air mobility services
- 5.1.2. Restraints
- 5.1.2.1. High cost of development of vertiports
- 5.1.3. Opportunities
- 5.1.3.1. Continuous technological advancements in the development of vertiports
- 5.1.3.2. Increasing integration of vertiports with airports and train stations
- 5.1.4. Challenges
- 5.1.4.1. Limited range and payload associated with vertiports
- 5.1.1. Drivers
- 5.2. Market Segmentation Analysis
- 5.2.1. Type: Rising adoption of verti hubs for electric vertical take-off and landing
- 5.2.2. Location: Expanding the application of rooftops/elevated vertiports to maximize the use of vertical space
- 5.3. Market Trend Analysis
- 5.4. Cumulative Impact of High Inflation
- 5.5. Porter's Five Forces Analysis
- 5.5.1. Threat of New Entrants
- 5.5.2. Threat of Substitutes
- 5.5.3. Bargaining Power of Customers
- 5.5.4. Bargaining Power of Suppliers
- 5.5.5. Industry Rivalry
- 5.6. Value Chain & Critical Path Analysis
- 5.7. Regulatory Framework
6. Vertiports Market, by Type
- 6.1. Introduction
- 6.2. Verti Hubs
- 6.3. Vertibases
- 6.4. Vertipads
7. Vertiports Market, by Location
- 7.1. Introduction
- 7.2. Ground-based
- 7.3. Rooftop / Elevated
8. Americas Vertiports Market
- 8.1. Introduction
- 8.2. Argentina
- 8.3. Brazil
- 8.4. Canada
- 8.5. Mexico
- 8.6. United States
9. Asia-Pacific Vertiports Market
- 9.1. Introduction
- 9.2. Australia
- 9.3. China
- 9.4. India
- 9.5. Indonesia
- 9.6. Japan
- 9.7. Malaysia
- 9.8. Philippines
- 9.9. Singapore
- 9.10. South Korea
- 9.11. Taiwan
- 9.12. Thailand
- 9.13. Vietnam
10. Europe, Middle East & Africa Vertiports Market
- 10.1. Introduction
- 10.2. Denmark
- 10.3. Egypt
- 10.4. Finland
- 10.5. France
- 10.6. Germany
- 10.7. Israel
- 10.8. Italy
- 10.9. Netherlands
- 10.10. Nigeria
- 10.11. Norway
- 10.12. Poland
- 10.13. Qatar
- 10.14. Russia
- 10.15. Saudi Arabia
- 10.16. South Africa
- 10.17. Spain
- 10.18. Sweden
- 10.19. Switzerland
- 10.20. Turkey
- 10.21. United Arab Emirates
- 10.22. United Kingdom
11. Competitive Landscape
- 11.1. FPNV Positioning Matrix
- 11.2. Market Share Analysis, By Key Player
- 11.3. Competitive Scenario Analysis, By Key Player
- 11.3.1. Agreement, Collaboration, & Partnership
- 11.3.1.1. Partners Plan Low-Cost Modular Vertiports For eVTOL Aircraft
- 11.3.1.2. New Partnership Launched to Develop Vertiports in the UK
- 11.3.1.3. Lilium and UrbanV to Collaborate on Vertiports in Italy, the French Riviera and Beyond
- 11.3.1.4. UrbanV and SITA Partner to Provide Digital Solutions for Rome Vertiports, Explore Opportunities for Vertiports Globally
- 11.3.2. New Product Launch & Enhancement
- 11.3.2.1. Skyportz Launches Compact Vertiport Design for Property Developers
- 11.3.1. Agreement, Collaboration, & Partnership
12. Competitive Portfolio
- 12.1. Key Company Profiles
- 12.1.1. Aeroauto LLC
- 12.1.2. airsight GmbH
- 12.1.3. ANA HOLDINGS INC
- 12.1.4. Aeroports de Paris SA
- 12.1.5. Bayards Constructions Group
- 12.1.6. Ferrovial S.E.
- 12.1.7. Giancarlo Zema Design Group
- 12.1.8. Groupe ADP
- 12.1.9. Hanwha
- 12.1.10. Hyundai E&C
- 12.1.11. Joby Aviation, Inc.
- 12.1.12. Kookiejar of Sweden
- 12.1.13. Lilium GmbH
- 12.1.14. Mott MacDonald
- 12.1.15. Siemens AG
- 12.1.16. SITA
- 12.1.17. Skyports Limited
- 12.1.18. Skyscape Corporation
- 12.1.19. Skyway
- 12.1.20. Urban-Air Port Ltd.
- 12.1.21. UrbanV S.p.A
- 12.1.22. Varon Vehicles Corporation
- 12.1.23. Vertiko Mobility Inc.
- 12.1.24. Volatus Infrastructure & Energy Solutions
- 12.1.25. Volocopter GmbH
- 12.1.26. VPorts
- 12.2. Key Product Portfolio
13. Appendix
- 13.1. Discussion Guide
- 13.2. License & Pricing
LIST OF FIGURES
- FIGURE 1. VERTIPORTS MARKET RESEARCH PROCESS
- FIGURE 2. VERTIPORTS MARKET SIZE, 2023 VS 2030
- FIGURE 3. VERTIPORTS MARKET SIZE, 2018-2030 (USD MILLION)
- FIGURE 4. VERTIPORTS MARKET SIZE, BY REGION, 2023 VS 2030 (%)
- FIGURE 5. VERTIPORTS MARKET SIZE, BY REGION, 2023 VS 2024 VS 2030 (USD MILLION)
- FIGURE 6. VERTIPORTS MARKET DYNAMICS
- FIGURE 7. VERTIPORTS MARKET SIZE, BY TYPE, 2023 VS 2030 (%)
- FIGURE 8. VERTIPORTS MARKET SIZE, BY TYPE, 2023 VS 2024 VS 2030 (USD MILLION)
- FIGURE 9. VERTIPORTS MARKET SIZE, BY LOCATION, 2023 VS 2030 (%)
- FIGURE 10. VERTIPORTS MARKET SIZE, BY LOCATION, 2023 VS 2024 VS 2030 (USD MILLION)
- FIGURE 11. AMERICAS VERTIPORTS MARKET SIZE, BY COUNTRY, 2023 VS 2030 (%)
- FIGURE 12. AMERICAS VERTIPORTS MARKET SIZE, BY COUNTRY, 2023 VS 2024 VS 2030 (USD MILLION)
- FIGURE 13. UNITED STATES VERTIPORTS MARKET SIZE, BY STATE, 2023 VS 2030 (%)
- FIGURE 14. UNITED STATES VERTIPORTS MARKET SIZE, BY STATE, 2023 VS 2024 VS 2030 (USD MILLION)
- FIGURE 15. ASIA-PACIFIC VERTIPORTS MARKET SIZE, BY COUNTRY, 2023 VS 2030 (%)
- FIGURE 16. ASIA-PACIFIC VERTIPORTS MARKET SIZE, BY COUNTRY, 2023 VS 2024 VS 2030 (USD MILLION)
- FIGURE 17. EUROPE, MIDDLE EAST & AFRICA VERTIPORTS MARKET SIZE, BY COUNTRY, 2023 VS 2030 (%)
- FIGURE 18. EUROPE, MIDDLE EAST & AFRICA VERTIPORTS MARKET SIZE, BY COUNTRY, 2023 VS 2024 VS 2030 (USD MILLION)
- FIGURE 19. VERTIPORTS MARKET, FPNV POSITIONING MATRIX, 2023
- FIGURE 20. VERTIPORTS MARKET SHARE, BY KEY PLAYER, 2023
LIST OF TABLES
- TABLE 1. VERTIPORTS MARKET SEGMENTATION & COVERAGE
- TABLE 2. UNITED STATES DOLLAR EXCHANGE RATE, 2018-2023
- TABLE 3. VERTIPORTS MARKET SIZE, 2018-2030 (USD MILLION)
- TABLE 4. GLOBAL VERTIPORTS MARKET SIZE, BY REGION, 2018-2030 (USD MILLION)
- TABLE 5. VERTIPORTS MARKET SIZE, BY TYPE, 2018-2030 (USD MILLION)
- TABLE 6. VERTIPORTS MARKET SIZE, BY VERTI HUBS, BY REGION, 2018-2030 (USD MILLION)
- TABLE 7. VERTIPORTS MARKET SIZE, BY VERTIBASES, BY REGION, 2018-2030 (USD MILLION)
- TABLE 8. VERTIPORTS MARKET SIZE, BY VERTIPADS, BY REGION, 2018-2030 (USD MILLION)
- TABLE 9. VERTIPORTS MARKET SIZE, BY LOCATION, 2018-2030 (USD MILLION)
- TABLE 10. VERTIPORTS MARKET SIZE, BY GROUND-BASED, BY REGION, 2018-2030 (USD MILLION)
- TABLE 11. VERTIPORTS MARKET SIZE, BY ROOFTOP / ELEVATED, BY REGION, 2018-2030 (USD MILLION)
- TABLE 12. AMERICAS VERTIPORTS MARKET SIZE, BY TYPE, 2018-2030 (USD MILLION)
- TABLE 13. AMERICAS VERTIPORTS MARKET SIZE, BY LOCATION, 2018-2030 (USD MILLION)
- TABLE 14. AMERICAS VERTIPORTS MARKET SIZE, BY COUNTRY, 2018-2030 (USD MILLION)
- TABLE 15. ARGENTINA VERTIPORTS MARKET SIZE, BY TYPE, 2018-2030 (USD MILLION)
- TABLE 16. ARGENTINA VERTIPORTS MARKET SIZE, BY LOCATION, 2018-2030 (USD MILLION)
- TABLE 17. BRAZIL VERTIPORTS MARKET SIZE, BY TYPE, 2018-2030 (USD MILLION)
- TABLE 18. BRAZIL VERTIPORTS MARKET SIZE, BY LOCATION, 2018-2030 (USD MILLION)
- TABLE 19. CANADA VERTIPORTS MARKET SIZE, BY TYPE, 2018-2030 (USD MILLION)
- TABLE 20. CANADA VERTIPORTS MARKET SIZE, BY LOCATION, 2018-2030 (USD MILLION)
- TABLE 21. MEXICO VERTIPORTS MARKET SIZE, BY TYPE, 2018-2030 (USD MILLION)
- TABLE 22. MEXICO VERTIPORTS MARKET SIZE, BY LOCATION, 2018-2030 (USD MILLION)
- TABLE 23. UNITED STATES VERTIPORTS MARKET SIZE, BY TYPE, 2018-2030 (USD MILLION)
- TABLE 24. UNITED STATES VERTIPORTS MARKET SIZE, BY LOCATION, 2018-2030 (USD MILLION)
- TABLE 25. UNITED STATES VERTIPORTS MARKET SIZE, BY STATE, 2018-2030 (USD MILLION)
- TABLE 26. ASIA-PACIFIC VERTIPORTS MARKET SIZE, BY TYPE, 2018-2030 (USD MILLION)
- TABLE 27. ASIA-PACIFIC VERTIPORTS MARKET SIZE, BY LOCATION, 2018-2030 (USD MILLION)
- TABLE 28. ASIA-PACIFIC VERTIPORTS MARKET SIZE, BY COUNTRY, 2018-2030 (USD MILLION)
- TABLE 29. AUSTRALIA VERTIPORTS MARKET SIZE, BY TYPE, 2018-2030 (USD MILLION)
- TABLE 30. AUSTRALIA VERTIPORTS MARKET SIZE, BY LOCATION, 2018-2030 (USD MILLION)
- TABLE 31. CHINA VERTIPORTS MARKET SIZE, BY TYPE, 2018-2030 (USD MILLION)
- TABLE 32. CHINA VERTIPORTS MARKET SIZE, BY LOCATION, 2018-2030 (USD MILLION)
- TABLE 33. INDIA VERTIPORTS MARKET SIZE, BY TYPE, 2018-2030 (USD MILLION)
- TABLE 34. INDIA VERTIPORTS MARKET SIZE, BY LOCATION, 2018-2030 (USD MILLION)
- TABLE 35. INDONESIA VERTIPORTS MARKET SIZE, BY TYPE, 2018-2030 (USD MILLION)
- TABLE 36. INDONESIA VERTIPORTS MARKET SIZE, BY LOCATION, 2018-2030 (USD MILLION)
- TABLE 37. JAPAN VERTIPORTS MARKET SIZE, BY TYPE, 2018-2030 (USD MILLION)
- TABLE 38. JAPAN VERTIPORTS MARKET SIZE, BY LOCATION, 2018-2030 (USD MILLION)
- TABLE 39. MALAYSIA VERTIPORTS MARKET SIZE, BY TYPE, 2018-2030 (USD MILLION)
- TABLE 40. MALAYSIA VERTIPORTS MARKET SIZE, BY LOCATION, 2018-2030 (USD MILLION)
- TABLE 41. PHILIPPINES VERTIPORTS MARKET SIZE, BY TYPE, 2018-2030 (USD MILLION)
- TABLE 42. PHILIPPINES VERTIPORTS MARKET SIZE, BY LOCATION, 2018-2030 (USD MILLION)
- TABLE 43. SINGAPORE VERTIPORTS MARKET SIZE, BY TYPE, 2018-2030 (USD MILLION)
- TABLE 44. SINGAPORE VERTIPORTS MARKET SIZE, BY LOCATION, 2018-2030 (USD MILLION)
- TABLE 45. SOUTH KOREA VERTIPORTS MARKET SIZE, BY TYPE, 2018-2030 (USD MILLION)
- TABLE 46. SOUTH KOREA VERTIPORTS MARKET SIZE, BY LOCATION, 2018-2030 (USD MILLION)
- TABLE 47. TAIWAN VERTIPORTS MARKET SIZE, BY TYPE, 2018-2030 (USD MILLION)
- TABLE 48. TAIWAN VERTIPORTS MARKET SIZE, BY LOCATION, 2018-2030 (USD MILLION)
- TABLE 49. THAILAND VERTIPORTS MARKET SIZE, BY TYPE, 2018-2030 (USD MILLION)
- TABLE 50. THAILAND VERTIPORTS MARKET SIZE, BY LOCATION, 2018-2030 (USD MILLION)
- TABLE 51. VIETNAM VERTIPORTS MARKET SIZE, BY TYPE, 2018-2030 (USD MILLION)
- TABLE 52. VIETNAM VERTIPORTS MARKET SIZE, BY LOCATION, 2018-2030 (USD MILLION)
- TABLE 53. EUROPE, MIDDLE EAST & AFRICA VERTIPORTS MARKET SIZE, BY TYPE, 2018-2030 (USD MILLION)
- TABLE 54. EUROPE, MIDDLE EAST & AFRICA VERTIPORTS MARKET SIZE, BY LOCATION, 2018-2030 (USD MILLION)
- TABLE 55. EUROPE, MIDDLE EAST & AFRICA VERTIPORTS MARKET SIZE, BY COUNTRY, 2018-2030 (USD MILLION)
- TABLE 56. DENMARK VERTIPORTS MARKET SIZE, BY TYPE, 2018-2030 (USD MILLION)
- TABLE 57. DENMARK VERTIPORTS MARKET SIZE, BY LOCATION, 2018-2030 (USD MILLION)
- TABLE 58. EGYPT VERTIPORTS MARKET SIZE, BY TYPE, 2018-2030 (USD MILLION)
- TABLE 59. EGYPT VERTIPORTS MARKET SIZE, BY LOCATION, 2018-2030 (USD MILLION)
- TABLE 60. FINLAND VERTIPORTS MARKET SIZE, BY TYPE, 2018-2030 (USD MILLION)
- TABLE 61. FINLAND VERTIPORTS MARKET SIZE, BY LOCATION, 2018-2030 (USD MILLION)
- TABLE 62. FRANCE VERTIPORTS MARKET SIZE, BY TYPE, 2018-2030 (USD MILLION)
- TABLE 63. FRANCE VERTIPORTS MARKET SIZE, BY LOCATION, 2018-2030 (USD MILLION)
- TABLE 64. GERMANY VERTIPORTS MARKET SIZE, BY TYPE, 2018-2030 (USD MILLION)
- TABLE 65. GERMANY VERTIPORTS MARKET SIZE, BY LOCATION, 2018-2030 (USD MILLION)
- TABLE 66. ISRAEL VERTIPORTS MARKET SIZE, BY TYPE, 2018-2030 (USD MILLION)
- TABLE 67. ISRAEL VERTIPORTS MARKET SIZE, BY LOCATION, 2018-2030 (USD MILLION)
- TABLE 68. ITALY VERTIPORTS MARKET SIZE, BY TYPE, 2018-2030 (USD MILLION)
- TABLE 69. ITALY VERTIPORTS MARKET SIZE, BY LOCATION, 2018-2030 (USD MILLION)
- TABLE 70. NETHERLANDS VERTIPORTS MARKET SIZE, BY TYPE, 2018-2030 (USD MILLION)
- TABLE 71. NETHERLANDS VERTIPORTS MARKET SIZE, BY LOCATION, 2018-2030 (USD MILLION)
- TABLE 72. NIGERIA VERTIPORTS MARKET SIZE, BY TYPE, 2018-2030 (USD MILLION)
- TABLE 73. NIGERIA VERTIPORTS MARKET SIZE, BY LOCATION, 2018-2030 (USD MILLION)
- TABLE 74. NORWAY VERTIPORTS MARKET SIZE, BY TYPE, 2018-2030 (USD MILLION)
- TABLE 75. NORWAY VERTIPORTS MARKET SIZE, BY LOCATION, 2018-2030 (USD MILLION)
- TABLE 76. POLAND VERTIPORTS MARKET SIZE, BY TYPE, 2018-2030 (USD MILLION)
- TABLE 77. POLAND VERTIPORTS MARKET SIZE, BY LOCATION, 2018-2030 (USD MILLION)
- TABLE 78. QATAR VERTIPORTS MARKET SIZE, BY TYPE, 2018-2030 (USD MILLION)
- TABLE 79. QATAR VERTIPORTS MARKET SIZE, BY LOCATION, 2018-2030 (USD MILLION)
- TABLE 80. RUSSIA VERTIPORTS MARKET SIZE, BY TYPE, 2018-2030 (USD MILLION)
- TABLE 81. RUSSIA VERTIPORTS MARKET SIZE, BY LOCATION, 2018-2030 (USD MILLION)
- TABLE 82. SAUDI ARABIA VERTIPORTS MARKET SIZE, BY TYPE, 2018-2030 (USD MILLION)
- TABLE 83. SAUDI ARABIA VERTIPORTS MARKET SIZE, BY LOCATION, 2018-2030 (USD MILLION)
- TABLE 84. SOUTH AFRICA VERTIPORTS MARKET SIZE, BY TYPE, 2018-2030 (USD MILLION)
- TABLE 85. SOUTH AFRICA VERTIPORTS MARKET SIZE, BY LOCATION, 2018-2030 (USD MILLION)
- TABLE 86. SPAIN VERTIPORTS MARKET SIZE, BY TYPE, 2018-2030 (USD MILLION)
- TABLE 87. SPAIN VERTIPORTS MARKET SIZE, BY LOCATION, 2018-2030 (USD MILLION)
- TABLE 88. SWEDEN VERTIPORTS MARKET SIZE, BY TYPE, 2018-2030 (USD MILLION)
- TABLE 89. SWEDEN VERTIPORTS MARKET SIZE, BY LOCATION, 2018-2030 (USD MILLION)
- TABLE 90. SWITZERLAND VERTIPORTS MARKET SIZE, BY TYPE, 2018-2030 (USD MILLION)
- TABLE 91. SWITZERLAND VERTIPORTS MARKET SIZE, BY LOCATION, 2018-2030 (USD MILLION)
- TABLE 92. TURKEY VERTIPORTS MARKET SIZE, BY TYPE, 2018-2030 (USD MILLION)
- TABLE 93. TURKEY VERTIPORTS MARKET SIZE, BY LOCATION, 2018-2030 (USD MILLION)
- TABLE 94. UNITED ARAB EMIRATES VERTIPORTS MARKET SIZE, BY TYPE, 2018-2030 (USD MILLION)
- TABLE 95. UNITED ARAB EMIRATES VERTIPORTS MARKET SIZE, BY LOCATION, 2018-2030 (USD MILLION)
- TABLE 96. UNITED KINGDOM VERTIPORTS MARKET SIZE, BY TYPE, 2018-2030 (USD MILLION)
- TABLE 97. UNITED KINGDOM VERTIPORTS MARKET SIZE, BY LOCATION, 2018-2030 (USD MILLION)
- TABLE 98. VERTIPORTS MARKET, FPNV POSITIONING MATRIX, 2023
- TABLE 99. VERTIPORTS MARKET SHARE, BY KEY PLAYER, 2023
- TABLE 100. VERTIPORTS MARKET LICENSE & PRICING
 全球城市空中交通 (UAM) 市场:市场规模和占有率分析 - 趋势、驱动因素、竞争格局、未来预测(2024-2030 年)
 2024 年城市空中交通全球市场报告
 城市空中交通市场报告:2030 年趋势、预测与竞争分析
 UAM 基础设施市场的全球市场按运营、构成、最终用户、生态系统和国家分类(2023-2033)
 城市空中交通的全球市场
 城市空中交通市场:按组件、范围、平台运营、平台架构、最终用户 - 2023-2030 年全球预测
 城市空中交通 (UAM) 和垂直机场:市场及技术的预测 (~2031年)
 城市空中交通的经营模式:air taxi,个人无人机,车辆的第3维
 城市空中交通的全球市场
 2023-2027 年全球城市空中交通市场