


 |
市场调查报告书
商品编码
1415423
润滑脂市场:按类型、基础油、组别、最终用途 - 2024-2030 年全球预测Grease Market by Type (Aluminum Complex Grease, Barium Complex Grease, Bentone Grease), Base Oil (Mineral, Synthetic, Vegetable), Group, End-Use - Global Forecast 2024-2030 |
||||||
※ 本网页内容可能与最新版本有所差异。详细情况请与我们联繫。
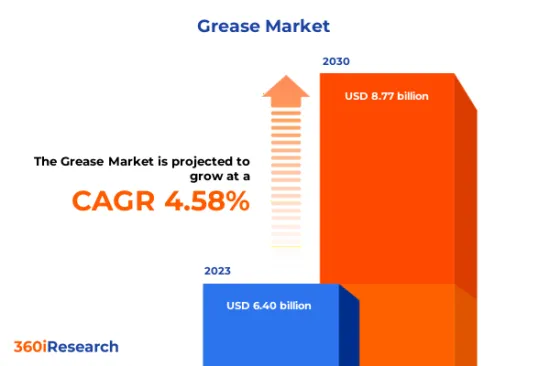
预计2023年润滑脂市场规模为64亿美元,2024年达67亿美元,2030年预计将达88.5亿美元,复合年增长率为4.72%。
全球润滑脂市场
| 主要市场统计 | |
|---|---|
| 基准年[2023] | 64亿美元 |
| 预测年份 [2024] | 67亿美元 |
| 预测年份 [2030] | 88.5亿美元 |
| 复合年增长率(%) | 4.72% |
润滑脂是一种半固态润滑剂,一般由基础油、浓稠化剂和各种添加剂组成。用于减少摩擦和润滑机械系统,特别是在液体油不能留在原位或难以涂布的情况下。增稠剂使润滑脂具有半固体稠度,使其能够黏附在表面上并在各种使用条件下保持在原位。润滑脂市场由用于多个最终用途领域的各种应用中的润滑目的的各种产品组成。润滑脂市场范围广阔,全球工业成长、车辆使用和维护要求推动了需求。工业自动化、基础设施投资和汽车技术进步等因素正在影响润滑脂市场的需求和范围。製造活动和机械使用的增加增加了对润滑脂产品的需求。延长润滑脂寿命和性能的配方进步正在促进市场成长。然而,由于政策不断变化,与原材料、应用复杂性和满足监管标准相关的高成本可能具有挑战性。开拓生物分解性且无害的润滑脂的特性,并结合奈米材料来增强润滑脂的耐热性和耐磨性,创造了利润丰厚的市场机会。
区域洞察
美洲是润滑脂的主要市场,汽车、工业和航太领域的需求量很大。该地区客户的购买行为很大程度上受到产品性能特征的影响,例如寿命、耐热性和环境影响。环保意识的增强和严格的法规导致该地区对生物基润滑脂的重视程度不断提高。由于欧盟严格的环保标准,欧盟国家对高品质、高性能的润滑脂产品有着强烈的需求,并且强烈倾向于环保选择。该市场的特点是偏爱永续和持久的产品,创新的油脂回收和再製造服务越来越受欢迎。重型机械和建筑业对中东和非洲市场影响重大。这些地区的消费者需求特别集中在采矿和建筑领域使用的高温、高负载润滑脂。亚太地区处于领先地位,在庞大的工业和製造业的高消费量推动下,成为润滑脂产品成长最快的市场。汽车工业和基础设施计划正在推动该地区的市场扩张。
FPNV定位矩阵
FPNV定位矩阵对于评估润滑脂市场至关重要。我们检视与业务策略和产品满意度相关的关键指标,以对供应商进行全面评估。这种深入的分析使用户能够根据自己的要求做出明智的决策。根据评估,供应商被分为四个成功程度不同的像限:前沿(F)、探路者(P)、利基(N)和重要(V)。
市场占有率分析
市场占有率分析是一种综合工具,可以对润滑脂市场供应商的现状进行深入而详细的研究。全面比较和分析供应商在整体收益、基本客群和其他关键指标方面的贡献,以便更好地了解公司的绩效及其在争夺市场占有率时面临的挑战。此外,该分析还提供了对该行业竞争特征的宝贵考察,包括在研究基准年观察到的累积、分散主导地位和合併特征等因素。这种详细程度的提高使供应商能够做出更明智的决策并制定有效的策略,从而在市场上获得竞争优势。
该报告对以下几个方面提供了宝贵的见解:
1-市场渗透率:提供有关主要企业所服务的市场的全面资讯。
2-市场开拓:我们深入研究利润丰厚的新兴市场,并分析它们在成熟细分市场中的渗透率。
3- 市场多元化:提供有关新产品发布、开拓地区、最新发展和投资的详细资讯。
4-竞争力评估与资讯:对主要企业的市场占有率、策略、产品、认证、监管状况、专利状况、製造能力等进行全面评估。
5- 产品开发与创新:提供对未来技术、研发活动和突破性产品开发的见解。
本报告解决了以下关键问题:
1-润滑脂市场的市场规模和预测是多少?
2-在润滑脂市场的预测期间内,有哪些产品、细分市场、应用和领域需要考虑投资?
3-润滑脂市场的技术趋势和法律规范是什么?
4-润滑脂市场主要供应商的市场占有率是多少?
5-进入润滑脂市场的合适型态或策略手段是什么?
目录
第一章 前言
第二章调查方法
第三章执行摘要
第四章市场概况
第五章市场洞察
- 市场动态
- 促进因素
- 由于引入各种自主机器,工业活动快速成长
- 商业运输和物流行业的需求不断增长
- 汽车产业越来越多地采用高性能润滑脂
- 抑制因素
- 原料成本波动
- 机会
- 最终用户产业对生物基润滑脂的潜在需求
- 持续开发多用途优质润滑脂产品
- 任务
- 与润滑脂的有限冷却能力和物理特性相关的问题
- 促进因素
- 市场区隔分析
- 类型:锂首选润滑脂,提供多种用途应用
- 基础油:使用毒性较低的植物油脂
- 组别:采用高度精製的III类基础油
- 最终用途:润滑脂在汽车和物流领域的重要用途
- 市场趋势分析
- 高通膨的累积效应
- 波特五力分析
- 价值炼和关键路径分析
- 法律规范
第六章润滑脂市场:依类型
- 铝复合脂
- 复合钡润滑脂
- 本顿润滑脂
- 钙脂
- 锂基润滑脂
- 聚脲润滑脂
- 钠基润滑脂
第七章 基础油润滑脂市场
- 矿物
- 合成
- 蔬菜
第八章按类别分類的润滑脂市场
- 第一组
- 第二组
- 第三组
- 第四组
- 第五组
第九章润滑脂市场:依最终用途分类
- 农业
- 汽车和物流
- 建筑与建造
- 製造业
- 海洋
- 矿业
- 发电
第10章美洲润滑脂市场
- 阿根廷
- 巴西
- 加拿大
- 墨西哥
- 美国
第十一章亚太地区润滑脂市场
- 澳洲
- 中国
- 印度
- 印尼
- 日本
- 马来西亚
- 菲律宾
- 新加坡
- 韩国
- 台湾
- 泰国
- 越南
第十二章欧洲、中东和非洲的润滑脂市场
- 丹麦
- 埃及
- 芬兰
- 法国
- 德国
- 以色列
- 义大利
- 荷兰
- 奈及利亚
- 挪威
- 波兰
- 卡达
- 俄罗斯
- 沙乌地阿拉伯
- 南非
- 西班牙
- 瑞典
- 瑞士
- 土耳其
- 阿拉伯聯合大公国
- 英国
第十三章竞争形势
- FPNV定位矩阵
- 市场占有率分析:主要企业
- 主要企业竞争情境分析
- 新产品发布和功能增强
- 奖项/奖励/扩展
第14章竞争产品组合
- 主要公司简介
- Axel Christiernsson International AB
- BECHEM Lubrication Technology LLC
- Bel-Ray by Calumet Branded Products, LLC
- BP PLC
- Calumet Speciality Products Partners LP
- Chemtool Incorporated by The Lubrizol Corporation
- Chevron Corporation
- China Petrochemical & Chemical Corporation(Sinopec)
- CITGO Petroleum Corporation
- ENEOS Corporation
- Exxon Mobil Corporation
- Fuchs Petrolub SE
- Gazpromneft-Lubricants Ltd
- Harrison Manufacturing Co Pty Ltd
- Hexol Lubricants
- Idemitsu Kosan Co.,Ltd.
- Indian Oil Corporation Limited
- Kluber Lubrication Munchen SE & Co. KG
- Lubri-Lab Inc
- Marathon Petroleum Corporation
- Penrite Oil Company
- Petroliam Nasional Berhad(PETRONAS)
- Petromin Corporation
- Phillips 66 Company
- PKN Orlen
- Shell PLC
- The PJSC Lukoil Oil Company
- Totalenergies Lubrifiants SA
- Valvoline Inc.
- 主要产品系列
第十五章附录
- 讨论指南
- 关于许可证和定价
[180 Pages Report] The Grease Market size was estimated at USD 6.40 billion in 2023 and expected to reach USD 6.70 billion in 2024, at a CAGR 4.72% to reach USD 8.85 billion by 2030.
Global Grease Market
| KEY MARKET STATISTICS | |
|---|---|
| Base Year [2023] | USD 6.40 billion |
| Estimated Year [2024] | USD 6.70 billion |
| Forecast Year [2030] | USD 8.85 billion |
| CAGR (%) | 4.72% |
Grease is a semisolid lubricant typically composed of base oil, thickening agents, and various additives. It reduces friction and lubricates mechanical systems, particularly where a liquid fat might not stay in place or would be difficult to apply. The thickening agents give grease its semisolid consistency, allowing it to adhere to surfaces and stay in place under various operating conditions. The grease market comprises different products used for lubrication purposes in various applications across multiple end-use sectors. The scope of the grease market is broad, with demand driven by industrial growth, vehicular usage, and maintenance requirements globally. Factors such as industrial automation, investment in infrastructure, and technological advancements in vehicles influence the demand and scope of the grease market. Increased manufacturing activities and machinery usage bolster the need for grease products. Advances in formulations extending grease life and performance contribute to market growth. However, high costs associated with the raw material, the complexity of applications, and meeting the regulatory standards can be challenging due to the constant evolution of policies. Developing bio-degradable and non-toxic grease properties and incorporating nanomaterials to enhance greases' thermal and wear resistance create a lucrative market opportunity.
Regional Insights
The Americas represents a major market for grease, with a high demand stemming from the automotive, industrial, and aerospace sectors. Customer purchasing behavior in regional countries is heavily influenced by product performance characteristics such as longevity, temperature resistance, and environmental impact. The region increasingly emphasizes bio-based greases due to increasing environmental awareness and stringent regulations. Due to the EU's strict environmental standards, European Union countries exhibit a robust demand for high-quality, high-performance grease products, significantly leaning towards environmentally friendly options. The market is characterized by a preference for sustainable and longer-lasting products, with innovative grease recycling and reconditioning services gaining traction. The heavy machinery and construction industries considerably influence the Middle Eastern and African markets. The consumer needs in these regions revolve around high-temperature and heavy-load-bearing greases, especially for use in the mining and construction sectors. The Asia Pacific region is at its forefront and is a rapidly growing market for grease products driven by high consumption due to its massive industrial and manufacturing sectors. The automotive industry and infrastructure projects fuel the market expansion in the region.
FPNV Positioning Matrix
The FPNV Positioning Matrix is pivotal in evaluating the Grease Market. It offers a comprehensive assessment of vendors, examining key metrics related to Business Strategy and Product Satisfaction. This in-depth analysis empowers users to make well-informed decisions aligned with their requirements. Based on the evaluation, the vendors are then categorized into four distinct quadrants representing varying levels of success: Forefront (F), Pathfinder (P), Niche (N), or Vital (V).
Market Share Analysis
The Market Share Analysis is a comprehensive tool that provides an insightful and in-depth examination of the current state of vendors in the Grease Market. By meticulously comparing and analyzing vendor contributions in terms of overall revenue, customer base, and other key metrics, we can offer companies a greater understanding of their performance and the challenges they face when competing for market share. Additionally, this analysis provides valuable insights into the competitive nature of the sector, including factors such as accumulation, fragmentation dominance, and amalgamation traits observed over the base year period studied. With this expanded level of detail, vendors can make more informed decisions and devise effective strategies to gain a competitive edge in the market.
Key Company Profiles
The report delves into recent significant developments in the Grease Market, highlighting leading vendors and their innovative profiles. These include Axel Christiernsson International AB, BECHEM Lubrication Technology LLC, Bel-Ray by Calumet Branded Products, LLC, BP PLC, Calumet Speciality Products Partners LP, Chemtool Incorporated by The Lubrizol Corporation, Chevron Corporation, China Petrochemical & Chemical Corporation (Sinopec), CITGO Petroleum Corporation, ENEOS Corporation, Exxon Mobil Corporation, Fuchs Petrolub SE, Gazpromneft - Lubricants Ltd, Harrison Manufacturing Co Pty Ltd, Hexol Lubricants, Idemitsu Kosan Co.,Ltd., Indian Oil Corporation Limited, Kluber Lubrication Munchen SE & Co. KG, Lubri-Lab Inc, Marathon Petroleum Corporation, Penrite Oil Company, Petroliam Nasional Berhad (PETRONAS), Petromin Corporation, Phillips 66 Company, PKN Orlen, Shell PLC, The PJSC Lukoil Oil Company, Totalenergies Lubrifiants SA, and Valvoline Inc..
Market Segmentation & Coverage
This research report categorizes the Grease Market to forecast the revenues and analyze trends in each of the following sub-markets:
- Type
- Aluminum Complex Grease
- Barium Complex Grease
- Bentone Grease
- Calcium Grease
- Lithium Grease
- Polyurea Grease
- Sodium Grease
- Base Oil
- Mineral
- Synthetic
- Vegetable
- Group
- Group I
- Group II
- Group III
- Group IV
- Group V
- End-Use
- Agriculture
- Automotive & Logistics
- Building & Construction
- Manufacturing
- Marine
- Mining
- Power Generation
- Region
- Americas
- Argentina
- Brazil
- Canada
- Mexico
- United States
- California
- Florida
- Illinois
- New York
- Ohio
- Pennsylvania
- Texas
- Asia-Pacific
- Australia
- China
- India
- Indonesia
- Japan
- Malaysia
- Philippines
- Singapore
- South Korea
- Taiwan
- Thailand
- Vietnam
- Europe, Middle East & Africa
- Denmark
- Egypt
- Finland
- France
- Germany
- Israel
- Italy
- Netherlands
- Nigeria
- Norway
- Poland
- Qatar
- Russia
- Saudi Arabia
- South Africa
- Spain
- Sweden
- Switzerland
- Turkey
- United Arab Emirates
- United Kingdom
- Americas
The report offers valuable insights on the following aspects:
1. Market Penetration: It presents comprehensive information on the market provided by key players.
2. Market Development: It delves deep into lucrative emerging markets and analyzes the penetration across mature market segments.
3. Market Diversification: It provides detailed information on new product launches, untapped geographic regions, recent developments, and investments.
4. Competitive Assessment & Intelligence: It conducts an exhaustive assessment of market shares, strategies, products, certifications, regulatory approvals, patent landscape, and manufacturing capabilities of the leading players.
5. Product Development & Innovation: It offers intelligent insights on future technologies, R&D activities, and breakthrough product developments.
The report addresses key questions such as:
1. What is the market size and forecast of the Grease Market?
2. Which products, segments, applications, and areas should one consider investing in over the forecast period in the Grease Market?
3. What are the technology trends and regulatory frameworks in the Grease Market?
4. What is the market share of the leading vendors in the Grease Market?
5. Which modes and strategic moves are suitable for entering the Grease Market?
Table of Contents
1. Preface
- 1.1. Objectives of the Study
- 1.2. Market Segmentation & Coverage
- 1.3. Years Considered for the Study
- 1.4. Currency & Pricing
- 1.5. Language
- 1.6. Limitations
- 1.7. Assumptions
- 1.8. Stakeholders
2. Research Methodology
- 2.1. Define: Research Objective
- 2.2. Determine: Research Design
- 2.3. Prepare: Research Instrument
- 2.4. Collect: Data Source
- 2.5. Analyze: Data Interpretation
- 2.6. Formulate: Data Verification
- 2.7. Publish: Research Report
- 2.8. Repeat: Report Update
3. Executive Summary
4. Market Overview
- 4.1. Introduction
- 4.2. Grease Market, by Region
5. Market Insights
- 5.1. Market Dynamics
- 5.1.1. Drivers
- 5.1.1.1. Rapid growth in industrial activities with adoption of various autonomous machinery
- 5.1.1.2. Growing demand from the commercial transportation and logistics sector
- 5.1.1.3. Rising adoption of high-performance grease by automotive industry
- 5.1.2. Restraints
- 5.1.2.1. Changing costs of raw materials
- 5.1.3. Opportunities
- 5.1.3.1. Potential demand for bio-based greases from the end-user industries
- 5.1.3.2. Ongoing product development for multi-purpose premium grease products
- 5.1.4. Challenges
- 5.1.4.1. Issues associated with limited cooling ability and physical properties of grease
- 5.1.1. Drivers
- 5.2. Market Segmentation Analysis
- 5.2.1. Type: Preference for lithium grease to offer multi-purpose applications
- 5.2.2. Base Oil: Adoption of vegetable-based greases due to the lower toxicity
- 5.2.3. Group: Adoption of Group III base oils due to its higher levels of refinement
- 5.2.4. End-Use: Significant usage of grease in automotive and logistics sector
- 5.3. Market Trend Analysis
- 5.4. Cumulative Impact of High Inflation
- 5.5. Porter's Five Forces Analysis
- 5.5.1. Threat of New Entrants
- 5.5.2. Threat of Substitutes
- 5.5.3. Bargaining Power of Customers
- 5.5.4. Bargaining Power of Suppliers
- 5.5.5. Industry Rivalry
- 5.6. Value Chain & Critical Path Analysis
- 5.7. Regulatory Framework
6. Grease Market, by Type
- 6.1. Introduction
- 6.2. Aluminum Complex Grease
- 6.3. Barium Complex Grease
- 6.4. Bentone Grease
- 6.5. Calcium Grease
- 6.6. Lithium Grease
- 6.7. Polyurea Grease
- 6.8. Sodium Grease
7. Grease Market, by Base Oil
- 7.1. Introduction
- 7.2. Mineral
- 7.3. Synthetic
- 7.4. Vegetable
8. Grease Market, by Group
- 8.1. Introduction
- 8.2. Group I
- 8.3. Group II
- 8.4. Group III
- 8.5. Group IV
- 8.6. Group V
9. Grease Market, by End-Use
- 9.1. Introduction
- 9.2. Agriculture
- 9.3. Automotive & Logistics
- 9.4. Building & Construction
- 9.5. Manufacturing
- 9.6. Marine
- 9.7. Mining
- 9.8. Power Generation
10. Americas Grease Market
- 10.1. Introduction
- 10.2. Argentina
- 10.3. Brazil
- 10.4. Canada
- 10.5. Mexico
- 10.6. United States
11. Asia-Pacific Grease Market
- 11.1. Introduction
- 11.2. Australia
- 11.3. China
- 11.4. India
- 11.5. Indonesia
- 11.6. Japan
- 11.7. Malaysia
- 11.8. Philippines
- 11.9. Singapore
- 11.10. South Korea
- 11.11. Taiwan
- 11.12. Thailand
- 11.13. Vietnam
12. Europe, Middle East & Africa Grease Market
- 12.1. Introduction
- 12.2. Denmark
- 12.3. Egypt
- 12.4. Finland
- 12.5. France
- 12.6. Germany
- 12.7. Israel
- 12.8. Italy
- 12.9. Netherlands
- 12.10. Nigeria
- 12.11. Norway
- 12.12. Poland
- 12.13. Qatar
- 12.14. Russia
- 12.15. Saudi Arabia
- 12.16. South Africa
- 12.17. Spain
- 12.18. Sweden
- 12.19. Switzerland
- 12.20. Turkey
- 12.21. United Arab Emirates
- 12.22. United Kingdom
13. Competitive Landscape
- 13.1. FPNV Positioning Matrix
- 13.2. Market Share Analysis, By Key Player
- 13.3. Competitive Scenario Analysis, By Key Player
- 13.3.1. New Product Launch & Enhancement
- 13.3.1.1. FUCHS Lubricants Launches Calcium Sulfonate Complex Grease
- 13.3.2. Award, Recognition, & Expansion
- 13.3.2.1. Sintec Expands Grease Plant
- 13.3.2.2. PSC Group Partners with ExxonMobil Olathe Grease Plant
- 13.3.1. New Product Launch & Enhancement
14. Competitive Portfolio
- 14.1. Key Company Profiles
- 14.1.1. Axel Christiernsson International AB
- 14.1.2. BECHEM Lubrication Technology LLC
- 14.1.3. Bel-Ray by Calumet Branded Products, LLC
- 14.1.4. BP PLC
- 14.1.5. Calumet Speciality Products Partners LP
- 14.1.6. Chemtool Incorporated by The Lubrizol Corporation
- 14.1.7. Chevron Corporation
- 14.1.8. China Petrochemical & Chemical Corporation (Sinopec)
- 14.1.9. CITGO Petroleum Corporation
- 14.1.10. ENEOS Corporation
- 14.1.11. Exxon Mobil Corporation
- 14.1.12. Fuchs Petrolub SE
- 14.1.13. Gazpromneft - Lubricants Ltd
- 14.1.14. Harrison Manufacturing Co Pty Ltd
- 14.1.15. Hexol Lubricants
- 14.1.16. Idemitsu Kosan Co.,Ltd.
- 14.1.17. Indian Oil Corporation Limited
- 14.1.18. Kluber Lubrication Munchen SE & Co. KG
- 14.1.19. Lubri-Lab Inc
- 14.1.20. Marathon Petroleum Corporation
- 14.1.21. Penrite Oil Company
- 14.1.22. Petroliam Nasional Berhad (PETRONAS)
- 14.1.23. Petromin Corporation
- 14.1.24. Phillips 66 Company
- 14.1.25. PKN Orlen
- 14.1.26. Shell PLC
- 14.1.27. The PJSC Lukoil Oil Company
- 14.1.28. Totalenergies Lubrifiants SA
- 14.1.29. Valvoline Inc.
- 14.2. Key Product Portfolio
15. Appendix
- 15.1. Discussion Guide
- 15.2. License & Pricing
LIST OF FIGURES
- FIGURE 1. GREASE MARKET RESEARCH PROCESS
- FIGURE 2. GREASE MARKET SIZE, 2023 VS 2030
- FIGURE 3. GREASE MARKET SIZE, 2018-2030 (USD MILLION)
- FIGURE 4. GREASE MARKET SIZE, BY REGION, 2023 VS 2030 (%)
- FIGURE 5. GREASE MARKET SIZE, BY REGION, 2023 VS 2024 VS 2030 (USD MILLION)
- FIGURE 6. GREASE MARKET DYNAMICS
- FIGURE 7. GREASE MARKET SIZE, BY TYPE, 2023 VS 2030 (%)
- FIGURE 8. GREASE MARKET SIZE, BY TYPE, 2023 VS 2024 VS 2030 (USD MILLION)
- FIGURE 9. GREASE MARKET SIZE, BY BASE OIL, 2023 VS 2030 (%)
- FIGURE 10. GREASE MARKET SIZE, BY BASE OIL, 2023 VS 2024 VS 2030 (USD MILLION)
- FIGURE 11. GREASE MARKET SIZE, BY GROUP, 2023 VS 2030 (%)
- FIGURE 12. GREASE MARKET SIZE, BY GROUP, 2023 VS 2024 VS 2030 (USD MILLION)
- FIGURE 13. GREASE MARKET SIZE, BY END-USE, 2023 VS 2030 (%)
- FIGURE 14. GREASE MARKET SIZE, BY END-USE, 2023 VS 2024 VS 2030 (USD MILLION)
- FIGURE 15. AMERICAS GREASE MARKET SIZE, BY COUNTRY, 2023 VS 2030 (%)
- FIGURE 16. AMERICAS GREASE MARKET SIZE, BY COUNTRY, 2023 VS 2024 VS 2030 (USD MILLION)
- FIGURE 17. UNITED STATES GREASE MARKET SIZE, BY STATE, 2023 VS 2030 (%)
- FIGURE 18. UNITED STATES GREASE MARKET SIZE, BY STATE, 2023 VS 2024 VS 2030 (USD MILLION)
- FIGURE 19. ASIA-PACIFIC GREASE MARKET SIZE, BY COUNTRY, 2023 VS 2030 (%)
- FIGURE 20. ASIA-PACIFIC GREASE MARKET SIZE, BY COUNTRY, 2023 VS 2024 VS 2030 (USD MILLION)
- FIGURE 21. EUROPE, MIDDLE EAST & AFRICA GREASE MARKET SIZE, BY COUNTRY, 2023 VS 2030 (%)
- FIGURE 22. EUROPE, MIDDLE EAST & AFRICA GREASE MARKET SIZE, BY COUNTRY, 2023 VS 2024 VS 2030 (USD MILLION)
- FIGURE 23. GREASE MARKET, FPNV POSITIONING MATRIX, 2023
- FIGURE 24. GREASE MARKET SHARE, BY KEY PLAYER, 2023
LIST OF TABLES
- TABLE 1. GREASE MARKET SEGMENTATION & COVERAGE
- TABLE 2. UNITED STATES DOLLAR EXCHANGE RATE, 2018-2023
- TABLE 3. GREASE MARKET SIZE, 2018-2030 (USD MILLION)
- TABLE 4. GLOBAL GREASE MARKET SIZE, BY REGION, 2018-2030 (USD MILLION)
- TABLE 5. GREASE MARKET SIZE, BY TYPE, 2018-2030 (USD MILLION)
- TABLE 6. GREASE MARKET SIZE, BY ALUMINUM COMPLEX GREASE, BY REGION, 2018-2030 (USD MILLION)
- TABLE 7. GREASE MARKET SIZE, BY BARIUM COMPLEX GREASE, BY REGION, 2018-2030 (USD MILLION)
- TABLE 8. GREASE MARKET SIZE, BY BENTONE GREASE, BY REGION, 2018-2030 (USD MILLION)
- TABLE 9. GREASE MARKET SIZE, BY CALCIUM GREASE, BY REGION, 2018-2030 (USD MILLION)
- TABLE 10. GREASE MARKET SIZE, BY LITHIUM GREASE, BY REGION, 2018-2030 (USD MILLION)
- TABLE 11. GREASE MARKET SIZE, BY POLYUREA GREASE, BY REGION, 2018-2030 (USD MILLION)
- TABLE 12. GREASE MARKET SIZE, BY SODIUM GREASE, BY REGION, 2018-2030 (USD MILLION)
- TABLE 13. GREASE MARKET SIZE, BY BASE OIL, 2018-2030 (USD MILLION)
- TABLE 14. GREASE MARKET SIZE, BY MINERAL, BY REGION, 2018-2030 (USD MILLION)
- TABLE 15. GREASE MARKET SIZE, BY SYNTHETIC, BY REGION, 2018-2030 (USD MILLION)
- TABLE 16. GREASE MARKET SIZE, BY VEGETABLE, BY REGION, 2018-2030 (USD MILLION)
- TABLE 17. GREASE MARKET SIZE, BY GROUP, 2018-2030 (USD MILLION)
- TABLE 18. GREASE MARKET SIZE, BY GROUP I, BY REGION, 2018-2030 (USD MILLION)
- TABLE 19. GREASE MARKET SIZE, BY GROUP II, BY REGION, 2018-2030 (USD MILLION)
- TABLE 20. GREASE MARKET SIZE, BY GROUP III, BY REGION, 2018-2030 (USD MILLION)
- TABLE 21. GREASE MARKET SIZE, BY GROUP IV, BY REGION, 2018-2030 (USD MILLION)
- TABLE 22. GREASE MARKET SIZE, BY GROUP V, BY REGION, 2018-2030 (USD MILLION)
- TABLE 23. GREASE MARKET SIZE, BY END-USE, 2018-2030 (USD MILLION)
- TABLE 24. GREASE MARKET SIZE, BY AGRICULTURE, BY REGION, 2018-2030 (USD MILLION)
- TABLE 25. GREASE MARKET SIZE, BY AUTOMOTIVE & LOGISTICS, BY REGION, 2018-2030 (USD MILLION)
- TABLE 26. GREASE MARKET SIZE, BY BUILDING & CONSTRUCTION, BY REGION, 2018-2030 (USD MILLION)
- TABLE 27. GREASE MARKET SIZE, BY MANUFACTURING, BY REGION, 2018-2030 (USD MILLION)
- TABLE 28. GREASE MARKET SIZE, BY MARINE, BY REGION, 2018-2030 (USD MILLION)
- TABLE 29. GREASE MARKET SIZE, BY MINING, BY REGION, 2018-2030 (USD MILLION)
- TABLE 30. GREASE MARKET SIZE, BY POWER GENERATION, BY REGION, 2018-2030 (USD MILLION)
- TABLE 31. AMERICAS GREASE MARKET SIZE, BY TYPE, 2018-2030 (USD MILLION)
- TABLE 32. AMERICAS GREASE MARKET SIZE, BY BASE OIL, 2018-2030 (USD MILLION)
- TABLE 33. AMERICAS GREASE MARKET SIZE, BY GROUP, 2018-2030 (USD MILLION)
- TABLE 34. AMERICAS GREASE MARKET SIZE, BY END-USE, 2018-2030 (USD MILLION)
- TABLE 35. AMERICAS GREASE MARKET SIZE, BY COUNTRY, 2018-2030 (USD MILLION)
- TABLE 36. ARGENTINA GREASE MARKET SIZE, BY TYPE, 2018-2030 (USD MILLION)
- TABLE 37. ARGENTINA GREASE MARKET SIZE, BY BASE OIL, 2018-2030 (USD MILLION)
- TABLE 38. ARGENTINA GREASE MARKET SIZE, BY GROUP, 2018-2030 (USD MILLION)
- TABLE 39. ARGENTINA GREASE MARKET SIZE, BY END-USE, 2018-2030 (USD MILLION)
- TABLE 40. BRAZIL GREASE MARKET SIZE, BY TYPE, 2018-2030 (USD MILLION)
- TABLE 41. BRAZIL GREASE MARKET SIZE, BY BASE OIL, 2018-2030 (USD MILLION)
- TABLE 42. BRAZIL GREASE MARKET SIZE, BY GROUP, 2018-2030 (USD MILLION)
- TABLE 43. BRAZIL GREASE MARKET SIZE, BY END-USE, 2018-2030 (USD MILLION)
- TABLE 44. CANADA GREASE MARKET SIZE, BY TYPE, 2018-2030 (USD MILLION)
- TABLE 45. CANADA GREASE MARKET SIZE, BY BASE OIL, 2018-2030 (USD MILLION)
- TABLE 46. CANADA GREASE MARKET SIZE, BY GROUP, 2018-2030 (USD MILLION)
- TABLE 47. CANADA GREASE MARKET SIZE, BY END-USE, 2018-2030 (USD MILLION)
- TABLE 48. MEXICO GREASE MARKET SIZE, BY TYPE, 2018-2030 (USD MILLION)
- TABLE 49. MEXICO GREASE MARKET SIZE, BY BASE OIL, 2018-2030 (USD MILLION)
- TABLE 50. MEXICO GREASE MARKET SIZE, BY GROUP, 2018-2030 (USD MILLION)
- TABLE 51. MEXICO GREASE MARKET SIZE, BY END-USE, 2018-2030 (USD MILLION)
- TABLE 52. UNITED STATES GREASE MARKET SIZE, BY TYPE, 2018-2030 (USD MILLION)
- TABLE 53. UNITED STATES GREASE MARKET SIZE, BY BASE OIL, 2018-2030 (USD MILLION)
- TABLE 54. UNITED STATES GREASE MARKET SIZE, BY GROUP, 2018-2030 (USD MILLION)
- TABLE 55. UNITED STATES GREASE MARKET SIZE, BY END-USE, 2018-2030 (USD MILLION)
- TABLE 56. UNITED STATES GREASE MARKET SIZE, BY STATE, 2018-2030 (USD MILLION)
- TABLE 57. ASIA-PACIFIC GREASE MARKET SIZE, BY TYPE, 2018-2030 (USD MILLION)
- TABLE 58. ASIA-PACIFIC GREASE MARKET SIZE, BY BASE OIL, 2018-2030 (USD MILLION)
- TABLE 59. ASIA-PACIFIC GREASE MARKET SIZE, BY GROUP, 2018-2030 (USD MILLION)
- TABLE 60. ASIA-PACIFIC GREASE MARKET SIZE, BY END-USE, 2018-2030 (USD MILLION)
- TABLE 61. ASIA-PACIFIC GREASE MARKET SIZE, BY COUNTRY, 2018-2030 (USD MILLION)
- TABLE 62. AUSTRALIA GREASE MARKET SIZE, BY TYPE, 2018-2030 (USD MILLION)
- TABLE 63. AUSTRALIA GREASE MARKET SIZE, BY BASE OIL, 2018-2030 (USD MILLION)
- TABLE 64. AUSTRALIA GREASE MARKET SIZE, BY GROUP, 2018-2030 (USD MILLION)
- TABLE 65. AUSTRALIA GREASE MARKET SIZE, BY END-USE, 2018-2030 (USD MILLION)
- TABLE 66. CHINA GREASE MARKET SIZE, BY TYPE, 2018-2030 (USD MILLION)
- TABLE 67. CHINA GREASE MARKET SIZE, BY BASE OIL, 2018-2030 (USD MILLION)
- TABLE 68. CHINA GREASE MARKET SIZE, BY GROUP, 2018-2030 (USD MILLION)
- TABLE 69. CHINA GREASE MARKET SIZE, BY END-USE, 2018-2030 (USD MILLION)
- TABLE 70. INDIA GREASE MARKET SIZE, BY TYPE, 2018-2030 (USD MILLION)
- TABLE 71. INDIA GREASE MARKET SIZE, BY BASE OIL, 2018-2030 (USD MILLION)
- TABLE 72. INDIA GREASE MARKET SIZE, BY GROUP, 2018-2030 (USD MILLION)
- TABLE 73. INDIA GREASE MARKET SIZE, BY END-USE, 2018-2030 (USD MILLION)
- TABLE 74. INDONESIA GREASE MARKET SIZE, BY TYPE, 2018-2030 (USD MILLION)
- TABLE 75. INDONESIA GREASE MARKET SIZE, BY BASE OIL, 2018-2030 (USD MILLION)
- TABLE 76. INDONESIA GREASE MARKET SIZE, BY GROUP, 2018-2030 (USD MILLION)
- TABLE 77. INDONESIA GREASE MARKET SIZE, BY END-USE, 2018-2030 (USD MILLION)
- TABLE 78. JAPAN GREASE MARKET SIZE, BY TYPE, 2018-2030 (USD MILLION)
- TABLE 79. JAPAN GREASE MARKET SIZE, BY BASE OIL, 2018-2030 (USD MILLION)
- TABLE 80. JAPAN GREASE MARKET SIZE, BY GROUP, 2018-2030 (USD MILLION)
- TABLE 81. JAPAN GREASE MARKET SIZE, BY END-USE, 2018-2030 (USD MILLION)
- TABLE 82. MALAYSIA GREASE MARKET SIZE, BY TYPE, 2018-2030 (USD MILLION)
- TABLE 83. MALAYSIA GREASE MARKET SIZE, BY BASE OIL, 2018-2030 (USD MILLION)
- TABLE 84. MALAYSIA GREASE MARKET SIZE, BY GROUP, 2018-2030 (USD MILLION)
- TABLE 85. MALAYSIA GREASE MARKET SIZE, BY END-USE, 2018-2030 (USD MILLION)
- TABLE 86. PHILIPPINES GREASE MARKET SIZE, BY TYPE, 2018-2030 (USD MILLION)
- TABLE 87. PHILIPPINES GREASE MARKET SIZE, BY BASE OIL, 2018-2030 (USD MILLION)
- TABLE 88. PHILIPPINES GREASE MARKET SIZE, BY GROUP, 2018-2030 (USD MILLION)
- TABLE 89. PHILIPPINES GREASE MARKET SIZE, BY END-USE, 2018-2030 (USD MILLION)
- TABLE 90. SINGAPORE GREASE MARKET SIZE, BY TYPE, 2018-2030 (USD MILLION)
- TABLE 91. SINGAPORE GREASE MARKET SIZE, BY BASE OIL, 2018-2030 (USD MILLION)
- TABLE 92. SINGAPORE GREASE MARKET SIZE, BY GROUP, 2018-2030 (USD MILLION)
- TABLE 93. SINGAPORE GREASE MARKET SIZE, BY END-USE, 2018-2030 (USD MILLION)
- TABLE 94. SOUTH KOREA GREASE MARKET SIZE, BY TYPE, 2018-2030 (USD MILLION)
- TABLE 95. SOUTH KOREA GREASE MARKET SIZE, BY BASE OIL, 2018-2030 (USD MILLION)
- TABLE 96. SOUTH KOREA GREASE MARKET SIZE, BY GROUP, 2018-2030 (USD MILLION)
- TABLE 97. SOUTH KOREA GREASE MARKET SIZE, BY END-USE, 2018-2030 (USD MILLION)
- TABLE 98. TAIWAN GREASE MARKET SIZE, BY TYPE, 2018-2030 (USD MILLION)
- TABLE 99. TAIWAN GREASE MARKET SIZE, BY BASE OIL, 2018-2030 (USD MILLION)
- TABLE 100. TAIWAN GREASE MARKET SIZE, BY GROUP, 2018-2030 (USD MILLION)
- TABLE 101. TAIWAN GREASE MARKET SIZE, BY END-USE, 2018-2030 (USD MILLION)
- TABLE 102. THAILAND GREASE MARKET SIZE, BY TYPE, 2018-2030 (USD MILLION)
- TABLE 103. THAILAND GREASE MARKET SIZE, BY BASE OIL, 2018-2030 (USD MILLION)
- TABLE 104. THAILAND GREASE MARKET SIZE, BY GROUP, 2018-2030 (USD MILLION)
- TABLE 105. THAILAND GREASE MARKET SIZE, BY END-USE, 2018-2030 (USD MILLION)
- TABLE 106. VIETNAM GREASE MARKET SIZE, BY TYPE, 2018-2030 (USD MILLION)
- TABLE 107. VIETNAM GREASE MARKET SIZE, BY BASE OIL, 2018-2030 (USD MILLION)
- TABLE 108. VIETNAM GREASE MARKET SIZE, BY GROUP, 2018-2030 (USD MILLION)
- TABLE 109. VIETNAM GREASE MARKET SIZE, BY END-USE, 2018-2030 (USD MILLION)
- TABLE 110. EUROPE, MIDDLE EAST & AFRICA GREASE MARKET SIZE, BY TYPE, 2018-2030 (USD MILLION)
- TABLE 111. EUROPE, MIDDLE EAST & AFRICA GREASE MARKET SIZE, BY BASE OIL, 2018-2030 (USD MILLION)
- TABLE 112. EUROPE, MIDDLE EAST & AFRICA GREASE MARKET SIZE, BY GROUP, 2018-2030 (USD MILLION)
- TABLE 113. EUROPE, MIDDLE EAST & AFRICA GREASE MARKET SIZE, BY END-USE, 2018-2030 (USD MILLION)
- TABLE 114. EUROPE, MIDDLE EAST & AFRICA GREASE MARKET SIZE, BY COUNTRY, 2018-2030 (USD MILLION)
- TABLE 115. DENMARK GREASE MARKET SIZE, BY TYPE, 2018-2030 (USD MILLION)
- TABLE 116. DENMARK GREASE MARKET SIZE, BY BASE OIL, 2018-2030 (USD MILLION)
- TABLE 117. DENMARK GREASE MARKET SIZE, BY GROUP, 2018-2030 (USD MILLION)
- TABLE 118. DENMARK GREASE MARKET SIZE, BY END-USE, 2018-2030 (USD MILLION)
- TABLE 119. EGYPT GREASE MARKET SIZE, BY TYPE, 2018-2030 (USD MILLION)
- TABLE 120. EGYPT GREASE MARKET SIZE, BY BASE OIL, 2018-2030 (USD MILLION)
- TABLE 121. EGYPT GREASE MARKET SIZE, BY GROUP, 2018-2030 (USD MILLION)
- TABLE 122. EGYPT GREASE MARKET SIZE, BY END-USE, 2018-2030 (USD MILLION)
- TABLE 123. FINLAND GREASE MARKET SIZE, BY TYPE, 2018-2030 (USD MILLION)
- TABLE 124. FINLAND GREASE MARKET SIZE, BY BASE OIL, 2018-2030 (USD MILLION)
- TABLE 125. FINLAND GREASE MARKET SIZE, BY GROUP, 2018-2030 (USD MILLION)
- TABLE 126. FINLAND GREASE MARKET SIZE, BY END-USE, 2018-2030 (USD MILLION)
- TABLE 127. FRANCE GREASE MARKET SIZE, BY TYPE, 2018-2030 (USD MILLION)
- TABLE 128. FRANCE GREASE MARKET SIZE, BY BASE OIL, 2018-2030 (USD MILLION)
- TABLE 129. FRANCE GREASE MARKET SIZE, BY GROUP, 2018-2030 (USD MILLION)
- TABLE 130. FRANCE GREASE MARKET SIZE, BY END-USE, 2018-2030 (USD MILLION)
- TABLE 131. GERMANY GREASE MARKET SIZE, BY TYPE, 2018-2030 (USD MILLION)
- TABLE 132. GERMANY GREASE MARKET SIZE, BY BASE OIL, 2018-2030 (USD MILLION)
- TABLE 133. GERMANY GREASE MARKET SIZE, BY GROUP, 2018-2030 (USD MILLION)
- TABLE 134. GERMANY GREASE MARKET SIZE, BY END-USE, 2018-2030 (USD MILLION)
- TABLE 135. ISRAEL GREASE MARKET SIZE, BY TYPE, 2018-2030 (USD MILLION)
- TABLE 136. ISRAEL GREASE MARKET SIZE, BY BASE OIL, 2018-2030 (USD MILLION)
- TABLE 137. ISRAEL GREASE MARKET SIZE, BY GROUP, 2018-2030 (USD MILLION)
- TABLE 138. ISRAEL GREASE MARKET SIZE, BY END-USE, 2018-2030 (USD MILLION)
- TABLE 139. ITALY GREASE MARKET SIZE, BY TYPE, 2018-2030 (USD MILLION)
- TABLE 140. ITALY GREASE MARKET SIZE, BY BASE OIL, 2018-2030 (USD MILLION)
- TABLE 141. ITALY GREASE MARKET SIZE, BY GROUP, 2018-2030 (USD MILLION)
- TABLE 142. ITALY GREASE MARKET SIZE, BY END-USE, 2018-2030 (USD MILLION)
- TABLE 143. NETHERLANDS GREASE MARKET SIZE, BY TYPE, 2018-2030 (USD MILLION)
- TABLE 144. NETHERLANDS GREASE MARKET SIZE, BY BASE OIL, 2018-2030 (USD MILLION)
- TABLE 145. NETHERLANDS GREASE MARKET SIZE, BY GROUP, 2018-2030 (USD MILLION)
- TABLE 146. NETHERLANDS GREASE MARKET SIZE, BY END-USE, 2018-2030 (USD MILLION)
- TABLE 147. NIGERIA GREASE MARKET SIZE, BY TYPE, 2018-2030 (USD MILLION)
- TABLE 148. NIGERIA GREASE MARKET SIZE, BY BASE OIL, 2018-2030 (USD MILLION)
- TABLE 149. NIGERIA GREASE MARKET SIZE, BY GROUP, 2018-2030 (USD MILLION)
- TABLE 150. NIGERIA GREASE MARKET SIZE, BY END-USE, 2018-2030 (USD MILLION)
- TABLE 151. NORWAY GREASE MARKET SIZE, BY TYPE, 2018-2030 (USD MILLION)
- TABLE 152. NORWAY GREASE MARKET SIZE, BY BASE OIL, 2018-2030 (USD MILLION)
- TABLE 153. NORWAY GREASE MARKET SIZE, BY GROUP, 2018-2030 (USD MILLION)
- TABLE 154. NORWAY GREASE MARKET SIZE, BY END-USE, 2018-2030 (USD MILLION)
- TABLE 155. POLAND GREASE MARKET SIZE, BY TYPE, 2018-2030 (USD MILLION)
- TABLE 156. POLAND GREASE MARKET SIZE, BY BASE OIL, 2018-2030 (USD MILLION)
- TABLE 157. POLAND GREASE MARKET SIZE, BY GROUP, 2018-2030 (USD MILLION)
- TABLE 158. POLAND GREASE MARKET SIZE, BY END-USE, 2018-2030 (USD MILLION)
- TABLE 159. QATAR GREASE MARKET SIZE, BY TYPE, 2018-2030 (USD MILLION)
- TABLE 160. QATAR GREASE MARKET SIZE, BY BASE OIL, 2018-2030 (USD MILLION)
- TABLE 161. QATAR GREASE MARKET SIZE, BY GROUP, 2018-2030 (USD MILLION)
- TABLE 162. QATAR GREASE MARKET SIZE, BY END-USE, 2018-2030 (USD MILLION)
- TABLE 163. RUSSIA GREASE MARKET SIZE, BY TYPE, 2018-2030 (USD MILLION)
- TABLE 164. RUSSIA GREASE MARKET SIZE, BY BASE OIL, 2018-2030 (USD MILLION)
- TABLE 165. RUSSIA GREASE MARKET SIZE, BY GROUP, 2018-2030 (USD MILLION)
- TABLE 166. RUSSIA GREASE MARKET SIZE, BY END-USE, 2018-2030 (USD MILLION)
- TABLE 167. SAUDI ARABIA GREASE MARKET SIZE, BY TYPE, 2018-2030 (USD MILLION)
- TABLE 168. SAUDI ARABIA GREASE MARKET SIZE, BY BASE OIL, 2018-2030 (USD MILLION)
- TABLE 169. SAUDI ARABIA GREASE MARKET SIZE, BY GROUP, 2018-2030 (USD MILLION)
- TABLE 170. SAUDI ARABIA GREASE MARKET SIZE, BY END-USE, 2018-2030 (USD MILLION)
- TABLE 171. SOUTH AFRICA GREASE MARKET SIZE, BY TYPE, 2018-2030 (USD MILLION)
- TABLE 172. SOUTH AFRICA GREASE MARKET SIZE, BY BASE OIL, 2018-2030 (USD MILLION)
- TABLE 173. SOUTH AFRICA GREASE MARKET SIZE, BY GROUP, 2018-2030 (USD MILLION)
- TABLE 174. SOUTH AFRICA GREASE MARKET SIZE, BY END-USE, 2018-2030 (USD MILLION)
- TABLE 175. SPAIN GREASE MARKET SIZE, BY TYPE, 2018-2030 (USD MILLION)
- TABLE 176. SPAIN GREASE MARKET SIZE, BY BASE OIL, 2018-2030 (USD MILLION)
- TABLE 177. SPAIN GREASE MARKET SIZE, BY GROUP, 2018-2030 (USD MILLION)
- TABLE 178. SPAIN GREASE MARKET SIZE, BY END-USE, 2018-2030 (USD MILLION)
- TABLE 179. SWEDEN GREASE MARKET SIZE, BY TYPE, 2018-2030 (USD MILLION)
- TABLE 180. SWEDEN GREASE MARKET SIZE, BY BASE OIL, 2018-2030 (USD MILLION)
- TABLE 181. SWEDEN GREASE MARKET SIZE, BY GROUP, 2018-2030 (USD MILLION)
- TABLE 182. SWEDEN GREASE MARKET SIZE, BY END-USE, 2018-2030 (USD MILLION)
- TABLE 183. SWITZERLAND GREASE MARKET SIZE, BY TYPE, 2018-2030 (USD MILLION)
- TABLE 184. SWITZERLAND GREASE MARKET SIZE, BY BASE OIL, 2018-2030 (USD MILLION)
- TABLE 185. SWITZERLAND GREASE MARKET SIZE, BY GROUP, 2018-2030 (USD MILLION)
- TABLE 186. SWITZERLAND GREASE MARKET SIZE, BY END-USE, 2018-2030 (USD MILLION)
- TABLE 187. TURKEY GREASE MARKET SIZE, BY TYPE, 2018-2030 (USD MILLION)
- TABLE 188. TURKEY GREASE MARKET SIZE, BY BASE OIL, 2018-2030 (USD MILLION)
- TABLE 189. TURKEY GREASE MARKET SIZE, BY GROUP, 2018-2030 (USD MILLION)
- TABLE 190. TURKEY GREASE MARKET SIZE, BY END-USE, 2018-2030 (USD MILLION)
- TABLE 191. UNITED ARAB EMIRATES GREASE MARKET SIZE, BY TYPE, 2018-2030 (USD MILLION)
- TABLE 192. UNITED ARAB EMIRATES GREASE MARKET SIZE, BY BASE OIL, 2018-2030 (USD MILLION)
- TABLE 193. UNITED ARAB EMIRATES GREASE MARKET SIZE, BY GROUP, 2018-2030 (USD MILLION)
- TABLE 194. UNITED ARAB EMIRATES GREASE MARKET SIZE, BY END-USE, 2018-2030 (USD MILLION)
- TABLE 195. UNITED KINGDOM GREASE MARKET SIZE, BY TYPE, 2018-2030 (USD MILLION)
- TABLE 196. UNITED KINGDOM GREASE MARKET SIZE, BY BASE OIL, 2018-2030 (USD MILLION)
- TABLE 197. UNITED KINGDOM GREASE MARKET SIZE, BY GROUP, 2018-2030 (USD MILLION)
- TABLE 198. UNITED KINGDOM GREASE MARKET SIZE, BY END-USE, 2018-2030 (USD MILLION)
- TABLE 199. GREASE MARKET, FPNV POSITIONING MATRIX, 2023
- TABLE 200. GREASE MARKET SHARE, BY KEY PLAYER, 2023
- TABLE 201. GREASE MARKET LICENSE & PRICING
 2024-2028年全球润滑脂市场
 润滑脂市场规模和预测、全球和地区份额、趋势和成长机会分析报告范围:按基础油、增稠剂类型和最终用途行业
 润滑脂:市场占有率分析、产业趋势与统计、成长预测(2024-2029)
 全球润滑脂市场
 润滑脂市场:2023-2028年全球行业趋势、份额、规模、增长、机会和预测
 全球润滑脂市场按基础油(矿物油,合成油,生物基),增稠剂类型(金属皂,非皂,无机),用途行业(汽车,一般製造,建筑,金属,采矿,农业,电力)预测至2027
 润滑脂的全球市场 - 市场规模、市场区隔、展望、收益预测(2022年~2028年):各增稠剂,各基础油,各终端用户,各主要地区
 油脂市场:按基础油,按最终用途行业的增稠剂类型:2021-2031 年全球机遇分析和行业预测
 润滑脂(黄油)市场 - 全球预测与预测(2022年~2027年)
 全球锂基润滑脂市场:2022-2027