


 |
市场调查报告书
商品编码
1434420
农业科学市场:按产品、按应用划分 - 2024-2030 年全球预测Agroscience Market by Product (Biopesticides, Biostimulants, Genetically Modified Seeds), Application (Crop, Food & Vegetables) - Global Forecast 2024-2030 |
||||||
※ 本网页内容可能与最新版本有所差异。详细情况请与我们联繫。
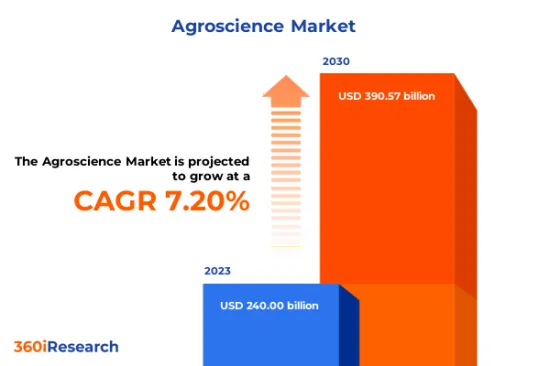
预计2023年农业科学市场规模将达2,400亿美元,预计2024年将达2,566.1亿美元,2030年将达3,905.7亿美元,复合年增长率为7.20%。
全球农业科学市场
| 主要市场统计 | |
|---|---|
| 基准年[2023] | 2400亿美元 |
| 预测年份 [2024] | 2566.1亿美元 |
| 预测年份 [2030] | 3905.7亿美元 |
| 复合年增长率(%) | 7.20% |
农业科学包括基因工程、生物技术、环境科学、作物保护、植物育种、土壤科学和精密农业等各领域的科学和创新技术的开发和使用。 AgroScience 的产品透过提高生产力、优化资源利用、减少环境影响以及应对人口增长和气候变迁的挑战来帮助确保粮食安全。由于人口成长、耕地面积减少以及提高产量的需要,全球粮食需求不断增加,从而增加了农业科学产品的使用。气候变迁对农业生产力的影响越来越大,以及精密农业中的巨量资料分析和物联网设备等技术的不断进步,正在推动农业科学市场的成长。政府透过研发投资促进永续农业实践的措施正在扩大市场范围。小规模农户先进农业技术的高成本、社会对基因改造作物(GMO)的抵制以及农业记录数位化引起的资料隐私和安全问题正在阻碍市场成长。越来越多地采用生物资讯学工具来支持作物改良和环境友善生物农药的基因组学和育种技术,预计将创造市场成长机会。
区域洞察
美国农业科学市场的特点是大规模农业经营,优先考虑效率、产量最大化和永续实践。该地区的农民严重依赖先进技术,如精密农业工具、基因改造种子和资料主导决策的数位平台。广阔的农业用地以及政府持续积极努力提高作物生产力和满足客户需求正在推动美洲农业科学市场的发展。包括中国、印度、印尼、孟加拉、日本等在内的亚太国家,由于人口众多、适合农业的土地比例较高,对农业和食品的需求正在快速成长。由于亚太地区农业用地比例较高,因此对农科产品的需求很高,以提高农产品的生产力。欧洲地区的农业生态学环境多种多样,有利于多种作物的生产,但也面临不同的植物检疫挑战。欧洲不可预测的气候变迁正在改变威胁组合,增加了害虫在全部区域传播的风险,并推动了欧洲、中东和非洲地区对农业科学产品的需求。
FPNV定位矩阵
FPNV 定位矩阵对于评估农业科学市场至关重要。我们检视与业务策略和产品满意度相关的关键指标,以对供应商进行全面评估。这种深入的分析使用户能够根据自己的要求做出明智的决策。根据评估,供应商被分为四个成功程度不同的像限:前沿(F)、探路者(P)、利基(N)和重要(V)。
市场占有率分析
市场占有率分析是一种综合工具,可以对农业科学市场中供应商的现状进行深入而详细的研究。全面比较和分析供应商在整体收益、基本客群和其他关键指标方面的贡献,以便更好地了解公司的绩效及其在争夺市场占有率时面临的挑战。此外,该分析还提供了对该行业竞争特征的宝贵见解,包括在研究基准年观察到的累积、分散主导地位和合併特征等因素。这种详细程度的提高使供应商能够做出更明智的决策并制定有效的策略,从而在市场上获得竞争优势。
该报告对以下几个方面提供了宝贵的见解:
1-市场渗透率:提供有关主要企业所服务的市场的全面资讯。
2-市场开拓:我们深入研究利润丰厚的新兴市场并分析其在成熟细分市场的渗透率。
3- 市场多元化:提供有关新产品发布、开拓地区、最新发展和投资的详细资讯。
4-竞争力评估与资讯:对主要企业的市场占有率、策略、产品、认证、监管状况、专利状况、製造能力等进行全面评估。
5- 产品开发与创新:提供对未来技术、研发活动和突破性产品开发的见解。
本报告解决了以下关键问题:
1-农业科学市场的市场规模和预测是多少?
2-农业科学市场预测期内需要考虑投资的产品、细分市场、应用和领域有哪些?
3-农业科学市场的技术趋势和法律规范是什么?
4-农业科学市场主要供应商的市场占有率是多少?
5-进入农业科学市场合适的型态和策略手段是什么?
目录
第一章 前言
第二章调查方法
第三章执行摘要
第四章市场概况
第五章市场洞察
- 市场动态
- 促进因素
- 全球人口成长导致全球粮食需求增加
- 政府透过研发投资促进永续农业实践的努力
- 气候变迁对农业生产力的影响日益增加
- 抑制因素
- 农场记录/农业资讯系统数位化的资料隐私和安全问题
- 机会
- 扩大环保生物农药/生肥的开发,减少对合成化学品的依赖
- 垂直农业系统和受控环境农业 (CEA) 技术的进一步整合
- 任务
- 社会对基因改造生物(GMO)的抵制
- 促进因素
- 市场区隔分析
- 产品:随着气候变迁的进展,扩大生物农药和生物刺激剂的使用
- 应用:用于作物保护的农业科学产品的使用迅速增加
- 市场趋势分析
- 高通膨的累积效应
- 波特五力分析
- 价值炼和关键路径分析
- 法律规范
第六章农业科学市场:副产品
- 生物农药
- 生物刺激剂
- 基因改造种子
第七章农业科学市场:依应用分类
- 作物
- 食品和蔬菜
第八章美洲农业科学市场
- 阿根廷
- 巴西
- 加拿大
- 墨西哥
- 美国
第九章亚太地区农业科学市场
- 澳洲
- 中国
- 印度
- 印尼
- 日本
- 马来西亚
- 菲律宾
- 新加坡
- 韩国
- 台湾
- 泰国
- 越南
第十章欧洲、中东和非洲农业科学市场
- 丹麦
- 埃及
- 芬兰
- 法国
- 德国
- 以色列
- 义大利
- 荷兰
- 奈及利亚
- 挪威
- 波兰
- 卡达
- 俄罗斯
- 沙乌地阿拉伯
- 南非
- 西班牙
- 瑞典
- 瑞士
- 土耳其
- 阿拉伯聯合大公国
- 英国
第十一章竞争形势
- FPNV定位矩阵
- 市场占有率分析:主要企业
- 主要企业竞争情境分析
- 併购
- 奖项/奖励/扩展
第12章竞争产品组合
- 主要公司简介
- Adama Ltd.
- American Vanguard Corporation
- Bayer AG
- Biobest Group
- Bioline AgroSciences Ltd.
- Coromandel International Limited
- DuPont de Nemours, Inc.
- Euro Agro Science
- Eurofins Scientific SE
- FMC Corporation
- Godrej Agrovet Limited
- Jain Irrigation Systems Ltd.
- Kaveri Seed Company Ltd
- Koppert Biological Systems Inc.
- llumina Inc.
- Mitsumi Agriscience Pvt. Ltd.
- Nissan Chemical Corporation
- Novozymes A/S
- Nutrien Ltd.
- Oasis Agroscience Limited
- Sigma Agriscience, LLC
- Syngenta Crop Protection AG by China National Chemical Corporation
- TeselaGen Biotechnology Inc.
- UPL Limited
- VARO Energy
- 主要产品系列
第十三章附录
- 讨论指南
- 关于许可证和定价
[189 Pages Report] The Agroscience Market size was estimated at USD 240.00 billion in 2023 and expected to reach USD 256.61 billion in 2024, at a CAGR 7.20% to reach USD 390.57 billion by 2030.
Global Agroscience Market
| KEY MARKET STATISTICS | |
|---|---|
| Base Year [2023] | USD 240.00 billion |
| Estimated Year [2024] | USD 256.61 billion |
| Forecast Year [2030] | USD 390.57 billion |
| CAGR (%) | 7.20% |
Agroscience includes developing and utilizing scientific and innovative techniques in various fields, such as genetic engineering, biotechnology, environmental science, crop protection, plant breeding, soil science, and precision agriculture. Agroscience products help enhance productivity, optimize resource utilization, reduce environmental impacts, and ensure food security by addressing population growth and climate change challenges. Increasing global food demand due to population growth, shrinking arable land coupled with the need for higher yield rates is increasing the usage of agriscience products. Rising climate change implications on agricultural productivity and continuous technological advancements, including big data analytics and IoT devices in precision farming, drive the agroscience market growth. The availability of government initiatives promoting sustainable agriculture practices through R&D investments is expanding the scope of the market. The high cost of advanced agricultural technologies for smallholder farmers, social resistance towards genetically modified organisms (GMOs), and data privacy & security concerns arising from the digitalization of farm records are hampering the market growth. The rising introduction of bioinformatics tools supporting genomics and breeding technologies for crop improvement and eco-friendly biopesticides is expected to create opportunities for market growth.
Regional Insights
The American market for agroscience is characterized by large-scale farming operations that prioritize efficiency, yield maximization, and sustainable practices. Farmers in the region rely heavily on advanced technologies such as precision agriculture tools, genetically modified seeds, and digital platforms for data-driven decision-making. The presence of substantial agricultural land areas with ongoing favorable government initiatives to improve crop productivity and meet the customers' demand encourages the agroscience market in the Americas. The countries in the Asia-Pacific, including China, India, Indonesia, Bangladesh, Japan, and others, have soaring demand for agriculture and food products due to the high population and contain a large percentage of land suitable for agriculture. The existence of a high percentage of agricultural land in Asia-Pacific creates considerable demand for agroscience products to enhance the productivity of the agricultural output. The European region spans a vast diversity of agroecological environments that ease the production of diverse crops; however, it is accompanied by various plant health challenges. The unpredictable climate change in Europe results in shifts in the composition of threats and enhanced risks of spreading pests across the region, subsequently driving the demand for agroscience products in EMEA.
FPNV Positioning Matrix
The FPNV Positioning Matrix is pivotal in evaluating the Agroscience Market. It offers a comprehensive assessment of vendors, examining key metrics related to Business Strategy and Product Satisfaction. This in-depth analysis empowers users to make well-informed decisions aligned with their requirements. Based on the evaluation, the vendors are then categorized into four distinct quadrants representing varying levels of success: Forefront (F), Pathfinder (P), Niche (N), or Vital (V).
Market Share Analysis
The Market Share Analysis is a comprehensive tool that provides an insightful and in-depth examination of the current state of vendors in the Agroscience Market. By meticulously comparing and analyzing vendor contributions in terms of overall revenue, customer base, and other key metrics, we can offer companies a greater understanding of their performance and the challenges they face when competing for market share. Additionally, this analysis provides valuable insights into the competitive nature of the sector, including factors such as accumulation, fragmentation dominance, and amalgamation traits observed over the base year period studied. With this expanded level of detail, vendors can make more informed decisions and devise effective strategies to gain a competitive edge in the market.
Key Company Profiles
The report delves into recent significant developments in the Agroscience Market, highlighting leading vendors and their innovative profiles. These include Adama Ltd., American Vanguard Corporation, Bayer AG, Biobest Group, Bioline AgroSciences Ltd., Coromandel International Limited, DuPont de Nemours, Inc., Euro Agro Science, Eurofins Scientific SE, FMC Corporation, Godrej Agrovet Limited, Jain Irrigation Systems Ltd., Kaveri Seed Company Ltd, Koppert Biological Systems Inc., llumina Inc., Mitsumi Agriscience Pvt. Ltd., Nissan Chemical Corporation, Novozymes A/S, Nutrien Ltd., Oasis Agroscience Limited, Sigma Agriscience, LLC, Syngenta Crop Protection AG by China National Chemical Corporation, TeselaGen Biotechnology Inc., UPL Limited, and VARO Energy.
Market Segmentation & Coverage
This research report categorizes the Agroscience Market to forecast the revenues and analyze trends in each of the following sub-markets:
- Product
- Biopesticides
- Biostimulants
- Genetically Modified Seeds
- Application
- Crop
- Food & Vegetables
- Region
- Americas
- Argentina
- Brazil
- Canada
- Mexico
- United States
- California
- Florida
- Illinois
- New York
- Ohio
- Pennsylvania
- Texas
- Asia-Pacific
- Australia
- China
- India
- Indonesia
- Japan
- Malaysia
- Philippines
- Singapore
- South Korea
- Taiwan
- Thailand
- Vietnam
- Europe, Middle East & Africa
- Denmark
- Egypt
- Finland
- France
- Germany
- Israel
- Italy
- Netherlands
- Nigeria
- Norway
- Poland
- Qatar
- Russia
- Saudi Arabia
- South Africa
- Spain
- Sweden
- Switzerland
- Turkey
- United Arab Emirates
- United Kingdom
- Americas
The report offers valuable insights on the following aspects:
1. Market Penetration: It presents comprehensive information on the market provided by key players.
2. Market Development: It delves deep into lucrative emerging markets and analyzes the penetration across mature market segments.
3. Market Diversification: It provides detailed information on new product launches, untapped geographic regions, recent developments, and investments.
4. Competitive Assessment & Intelligence: It conducts an exhaustive assessment of market shares, strategies, products, certifications, regulatory approvals, patent landscape, and manufacturing capabilities of the leading players.
5. Product Development & Innovation: It offers intelligent insights on future technologies, R&D activities, and breakthrough product developments.
The report addresses key questions such as:
1. What is the market size and forecast of the Agroscience Market?
2. Which products, segments, applications, and areas should one consider investing in over the forecast period in the Agroscience Market?
3. What are the technology trends and regulatory frameworks in the Agroscience Market?
4. What is the market share of the leading vendors in the Agroscience Market?
5. Which modes and strategic moves are suitable for entering the Agroscience Market?
Table of Contents
1. Preface
- 1.1. Objectives of the Study
- 1.2. Market Segmentation & Coverage
- 1.3. Years Considered for the Study
- 1.4. Currency & Pricing
- 1.5. Language
- 1.6. Limitations
- 1.7. Assumptions
- 1.8. Stakeholders
2. Research Methodology
- 2.1. Define: Research Objective
- 2.2. Determine: Research Design
- 2.3. Prepare: Research Instrument
- 2.4. Collect: Data Source
- 2.5. Analyze: Data Interpretation
- 2.6. Formulate: Data Verification
- 2.7. Publish: Research Report
- 2.8. Repeat: Report Update
3. Executive Summary
4. Market Overview
- 4.1. Introduction
- 4.2. Agroscience Market, by Region
5. Market Insights
- 5.1. Market Dynamics
- 5.1.1. Drivers
- 5.1.1.1. Rising global demand for food due to an increasing population globally
- 5.1.1.2. Government initiatives promoting sustainable agriculture practices through R&D investments
- 5.1.1.3. Growing climate change implications on agricultural productivity
- 5.1.2. Restraints
- 5.1.2.1. Data privacy & security concerns arising from digitalization of farm records/agricultural information systems
- 5.1.3. Opportunities
- 5.1.3.1. Growing development of eco-friendly biopesticides/biofertilizers to reduce dependency on synthetic chemicals
- 5.1.3.2. Rising integration of vertical farming systems and controlled environment agriculture (CEA) technologies
- 5.1.4. Challenges
- 5.1.4.1. Social resistance towards genetically modified organisms (GMOs)
- 5.1.1. Drivers
- 5.2. Market Segmentation Analysis
- 5.2.1. Product: Expanding the usage of biopesticides and biostimulants with growing climate changes
- 5.2.2. Application: Proliferating usage of agroscience products for crop protection
- 5.3. Market Trend Analysis
- 5.4. Cumulative Impact of High Inflation
- 5.5. Porter's Five Forces Analysis
- 5.5.1. Threat of New Entrants
- 5.5.2. Threat of Substitutes
- 5.5.3. Bargaining Power of Customers
- 5.5.4. Bargaining Power of Suppliers
- 5.5.5. Industry Rivalry
- 5.6. Value Chain & Critical Path Analysis
- 5.7. Regulatory Framework
6. Agroscience Market, by Product
- 6.1. Introduction
- 6.2. Biopesticides
- 6.3. Biostimulants
- 6.4. Genetically Modified Seeds
7. Agroscience Market, by Application
- 7.1. Introduction
- 7.2. Crop
- 7.3. Food & Vegetables
8. Americas Agroscience Market
- 8.1. Introduction
- 8.2. Argentina
- 8.3. Brazil
- 8.4. Canada
- 8.5. Mexico
- 8.6. United States
9. Asia-Pacific Agroscience Market
- 9.1. Introduction
- 9.2. Australia
- 9.3. China
- 9.4. India
- 9.5. Indonesia
- 9.6. Japan
- 9.7. Malaysia
- 9.8. Philippines
- 9.9. Singapore
- 9.10. South Korea
- 9.11. Taiwan
- 9.12. Thailand
- 9.13. Vietnam
10. Europe, Middle East & Africa Agroscience Market
- 10.1. Introduction
- 10.2. Denmark
- 10.3. Egypt
- 10.4. Finland
- 10.5. France
- 10.6. Germany
- 10.7. Israel
- 10.8. Italy
- 10.9. Netherlands
- 10.10. Nigeria
- 10.11. Norway
- 10.12. Poland
- 10.13. Qatar
- 10.14. Russia
- 10.15. Saudi Arabia
- 10.16. South Africa
- 10.17. Spain
- 10.18. Sweden
- 10.19. Switzerland
- 10.20. Turkey
- 10.21. United Arab Emirates
- 10.22. United Kingdom
11. Competitive Landscape
- 11.1. FPNV Positioning Matrix
- 11.2. Market Share Analysis, By Key Player
- 11.3. Competitive Scenario Analysis, By Key Player
- 11.3.1. Merger & Acquisition
- 11.3.1.1. VARO increases stake in agro-science leader SilviCarbon and announces issuance of high-quality carbon removal credits to customers
- 11.3.1.2. Corteva Agriscience Completes Acquisitions of Symborg and Stoller
- 11.3.2. Award, Recognition, & Expansion
- 11.3.2.1. Illumina expands genomics capabilities in India with opening of Solutions Center
- 11.3.1. Merger & Acquisition
12. Competitive Portfolio
- 12.1. Key Company Profiles
- 12.1.1. Adama Ltd.
- 12.1.2. American Vanguard Corporation
- 12.1.3. Bayer AG
- 12.1.4. Biobest Group
- 12.1.5. Bioline AgroSciences Ltd.
- 12.1.6. Coromandel International Limited
- 12.1.7. DuPont de Nemours, Inc.
- 12.1.8. Euro Agro Science
- 12.1.9. Eurofins Scientific SE
- 12.1.10. FMC Corporation
- 12.1.11. Godrej Agrovet Limited
- 12.1.12. Jain Irrigation Systems Ltd.
- 12.1.13. Kaveri Seed Company Ltd
- 12.1.14. Koppert Biological Systems Inc.
- 12.1.15. llumina Inc.
- 12.1.16. Mitsumi Agriscience Pvt. Ltd.
- 12.1.17. Nissan Chemical Corporation
- 12.1.18. Novozymes A/S
- 12.1.19. Nutrien Ltd.
- 12.1.20. Oasis Agroscience Limited
- 12.1.21. Sigma Agriscience, LLC
- 12.1.22. Syngenta Crop Protection AG by China National Chemical Corporation
- 12.1.23. TeselaGen Biotechnology Inc.
- 12.1.24. UPL Limited
- 12.1.25. VARO Energy
- 12.2. Key Product Portfolio
13. Appendix
- 13.1. Discussion Guide
- 13.2. License & Pricing
LIST OF FIGURES
- FIGURE 1. AGROSCIENCE MARKET RESEARCH PROCESS
- FIGURE 2. AGROSCIENCE MARKET SIZE, 2023 VS 2030
- FIGURE 3. AGROSCIENCE MARKET SIZE, 2018-2030 (USD MILLION)
- FIGURE 4. AGROSCIENCE MARKET SIZE, BY REGION, 2023 VS 2030 (%)
- FIGURE 5. AGROSCIENCE MARKET SIZE, BY REGION, 2023 VS 2024 VS 2030 (USD MILLION)
- FIGURE 6. AGROSCIENCE MARKET DYNAMICS
- FIGURE 7. AGROSCIENCE MARKET SIZE, BY PRODUCT, 2023 VS 2030 (%)
- FIGURE 8. AGROSCIENCE MARKET SIZE, BY PRODUCT, 2023 VS 2024 VS 2030 (USD MILLION)
- FIGURE 9. AGROSCIENCE MARKET SIZE, BY APPLICATION, 2023 VS 2030 (%)
- FIGURE 10. AGROSCIENCE MARKET SIZE, BY APPLICATION, 2023 VS 2024 VS 2030 (USD MILLION)
- FIGURE 11. AMERICAS AGROSCIENCE MARKET SIZE, BY COUNTRY, 2023 VS 2030 (%)
- FIGURE 12. AMERICAS AGROSCIENCE MARKET SIZE, BY COUNTRY, 2023 VS 2024 VS 2030 (USD MILLION)
- FIGURE 13. UNITED STATES AGROSCIENCE MARKET SIZE, BY STATE, 2023 VS 2030 (%)
- FIGURE 14. UNITED STATES AGROSCIENCE MARKET SIZE, BY STATE, 2023 VS 2024 VS 2030 (USD MILLION)
- FIGURE 15. ASIA-PACIFIC AGROSCIENCE MARKET SIZE, BY COUNTRY, 2023 VS 2030 (%)
- FIGURE 16. ASIA-PACIFIC AGROSCIENCE MARKET SIZE, BY COUNTRY, 2023 VS 2024 VS 2030 (USD MILLION)
- FIGURE 17. EUROPE, MIDDLE EAST & AFRICA AGROSCIENCE MARKET SIZE, BY COUNTRY, 2023 VS 2030 (%)
- FIGURE 18. EUROPE, MIDDLE EAST & AFRICA AGROSCIENCE MARKET SIZE, BY COUNTRY, 2023 VS 2024 VS 2030 (USD MILLION)
- FIGURE 19. AGROSCIENCE MARKET, FPNV POSITIONING MATRIX, 2023
- FIGURE 20. AGROSCIENCE MARKET SHARE, BY KEY PLAYER, 2023
LIST OF TABLES
- TABLE 1. AGROSCIENCE MARKET SEGMENTATION & COVERAGE
- TABLE 2. UNITED STATES DOLLAR EXCHANGE RATE, 2018-2023
- TABLE 3. AGROSCIENCE MARKET SIZE, 2018-2030 (USD MILLION)
- TABLE 4. GLOBAL AGROSCIENCE MARKET SIZE, BY REGION, 2018-2030 (USD MILLION)
- TABLE 5. AGROSCIENCE MARKET SIZE, BY PRODUCT, 2018-2030 (USD MILLION)
- TABLE 6. AGROSCIENCE MARKET SIZE, BY BIOPESTICIDES, BY REGION, 2018-2030 (USD MILLION)
- TABLE 7. AGROSCIENCE MARKET SIZE, BY BIOSTIMULANTS, BY REGION, 2018-2030 (USD MILLION)
- TABLE 8. AGROSCIENCE MARKET SIZE, BY GENETICALLY MODIFIED SEEDS, BY REGION, 2018-2030 (USD MILLION)
- TABLE 9. AGROSCIENCE MARKET SIZE, BY APPLICATION, 2018-2030 (USD MILLION)
- TABLE 10. AGROSCIENCE MARKET SIZE, BY CROP, BY REGION, 2018-2030 (USD MILLION)
- TABLE 11. AGROSCIENCE MARKET SIZE, BY FOOD & VEGETABLES, BY REGION, 2018-2030 (USD MILLION)
- TABLE 12. AMERICAS AGROSCIENCE MARKET SIZE, BY PRODUCT, 2018-2030 (USD MILLION)
- TABLE 13. AMERICAS AGROSCIENCE MARKET SIZE, BY APPLICATION, 2018-2030 (USD MILLION)
- TABLE 14. AMERICAS AGROSCIENCE MARKET SIZE, BY COUNTRY, 2018-2030 (USD MILLION)
- TABLE 15. ARGENTINA AGROSCIENCE MARKET SIZE, BY PRODUCT, 2018-2030 (USD MILLION)
- TABLE 16. ARGENTINA AGROSCIENCE MARKET SIZE, BY APPLICATION, 2018-2030 (USD MILLION)
- TABLE 17. BRAZIL AGROSCIENCE MARKET SIZE, BY PRODUCT, 2018-2030 (USD MILLION)
- TABLE 18. BRAZIL AGROSCIENCE MARKET SIZE, BY APPLICATION, 2018-2030 (USD MILLION)
- TABLE 19. CANADA AGROSCIENCE MARKET SIZE, BY PRODUCT, 2018-2030 (USD MILLION)
- TABLE 20. CANADA AGROSCIENCE MARKET SIZE, BY APPLICATION, 2018-2030 (USD MILLION)
- TABLE 21. MEXICO AGROSCIENCE MARKET SIZE, BY PRODUCT, 2018-2030 (USD MILLION)
- TABLE 22. MEXICO AGROSCIENCE MARKET SIZE, BY APPLICATION, 2018-2030 (USD MILLION)
- TABLE 23. UNITED STATES AGROSCIENCE MARKET SIZE, BY PRODUCT, 2018-2030 (USD MILLION)
- TABLE 24. UNITED STATES AGROSCIENCE MARKET SIZE, BY APPLICATION, 2018-2030 (USD MILLION)
- TABLE 25. UNITED STATES AGROSCIENCE MARKET SIZE, BY STATE, 2018-2030 (USD MILLION)
- TABLE 26. ASIA-PACIFIC AGROSCIENCE MARKET SIZE, BY PRODUCT, 2018-2030 (USD MILLION)
- TABLE 27. ASIA-PACIFIC AGROSCIENCE MARKET SIZE, BY APPLICATION, 2018-2030 (USD MILLION)
- TABLE 28. ASIA-PACIFIC AGROSCIENCE MARKET SIZE, BY COUNTRY, 2018-2030 (USD MILLION)
- TABLE 29. AUSTRALIA AGROSCIENCE MARKET SIZE, BY PRODUCT, 2018-2030 (USD MILLION)
- TABLE 30. AUSTRALIA AGROSCIENCE MARKET SIZE, BY APPLICATION, 2018-2030 (USD MILLION)
- TABLE 31. CHINA AGROSCIENCE MARKET SIZE, BY PRODUCT, 2018-2030 (USD MILLION)
- TABLE 32. CHINA AGROSCIENCE MARKET SIZE, BY APPLICATION, 2018-2030 (USD MILLION)
- TABLE 33. INDIA AGROSCIENCE MARKET SIZE, BY PRODUCT, 2018-2030 (USD MILLION)
- TABLE 34. INDIA AGROSCIENCE MARKET SIZE, BY APPLICATION, 2018-2030 (USD MILLION)
- TABLE 35. INDONESIA AGROSCIENCE MARKET SIZE, BY PRODUCT, 2018-2030 (USD MILLION)
- TABLE 36. INDONESIA AGROSCIENCE MARKET SIZE, BY APPLICATION, 2018-2030 (USD MILLION)
- TABLE 37. JAPAN AGROSCIENCE MARKET SIZE, BY PRODUCT, 2018-2030 (USD MILLION)
- TABLE 38. JAPAN AGROSCIENCE MARKET SIZE, BY APPLICATION, 2018-2030 (USD MILLION)
- TABLE 39. MALAYSIA AGROSCIENCE MARKET SIZE, BY PRODUCT, 2018-2030 (USD MILLION)
- TABLE 40. MALAYSIA AGROSCIENCE MARKET SIZE, BY APPLICATION, 2018-2030 (USD MILLION)
- TABLE 41. PHILIPPINES AGROSCIENCE MARKET SIZE, BY PRODUCT, 2018-2030 (USD MILLION)
- TABLE 42. PHILIPPINES AGROSCIENCE MARKET SIZE, BY APPLICATION, 2018-2030 (USD MILLION)
- TABLE 43. SINGAPORE AGROSCIENCE MARKET SIZE, BY PRODUCT, 2018-2030 (USD MILLION)
- TABLE 44. SINGAPORE AGROSCIENCE MARKET SIZE, BY APPLICATION, 2018-2030 (USD MILLION)
- TABLE 45. SOUTH KOREA AGROSCIENCE MARKET SIZE, BY PRODUCT, 2018-2030 (USD MILLION)
- TABLE 46. SOUTH KOREA AGROSCIENCE MARKET SIZE, BY APPLICATION, 2018-2030 (USD MILLION)
- TABLE 47. TAIWAN AGROSCIENCE MARKET SIZE, BY PRODUCT, 2018-2030 (USD MILLION)
- TABLE 48. TAIWAN AGROSCIENCE MARKET SIZE, BY APPLICATION, 2018-2030 (USD MILLION)
- TABLE 49. THAILAND AGROSCIENCE MARKET SIZE, BY PRODUCT, 2018-2030 (USD MILLION)
- TABLE 50. THAILAND AGROSCIENCE MARKET SIZE, BY APPLICATION, 2018-2030 (USD MILLION)
- TABLE 51. VIETNAM AGROSCIENCE MARKET SIZE, BY PRODUCT, 2018-2030 (USD MILLION)
- TABLE 52. VIETNAM AGROSCIENCE MARKET SIZE, BY APPLICATION, 2018-2030 (USD MILLION)
- TABLE 53. EUROPE, MIDDLE EAST & AFRICA AGROSCIENCE MARKET SIZE, BY PRODUCT, 2018-2030 (USD MILLION)
- TABLE 54. EUROPE, MIDDLE EAST & AFRICA AGROSCIENCE MARKET SIZE, BY APPLICATION, 2018-2030 (USD MILLION)
- TABLE 55. EUROPE, MIDDLE EAST & AFRICA AGROSCIENCE MARKET SIZE, BY COUNTRY, 2018-2030 (USD MILLION)
- TABLE 56. DENMARK AGROSCIENCE MARKET SIZE, BY PRODUCT, 2018-2030 (USD MILLION)
- TABLE 57. DENMARK AGROSCIENCE MARKET SIZE, BY APPLICATION, 2018-2030 (USD MILLION)
- TABLE 58. EGYPT AGROSCIENCE MARKET SIZE, BY PRODUCT, 2018-2030 (USD MILLION)
- TABLE 59. EGYPT AGROSCIENCE MARKET SIZE, BY APPLICATION, 2018-2030 (USD MILLION)
- TABLE 60. FINLAND AGROSCIENCE MARKET SIZE, BY PRODUCT, 2018-2030 (USD MILLION)
- TABLE 61. FINLAND AGROSCIENCE MARKET SIZE, BY APPLICATION, 2018-2030 (USD MILLION)
- TABLE 62. FRANCE AGROSCIENCE MARKET SIZE, BY PRODUCT, 2018-2030 (USD MILLION)
- TABLE 63. FRANCE AGROSCIENCE MARKET SIZE, BY APPLICATION, 2018-2030 (USD MILLION)
- TABLE 64. GERMANY AGROSCIENCE MARKET SIZE, BY PRODUCT, 2018-2030 (USD MILLION)
- TABLE 65. GERMANY AGROSCIENCE MARKET SIZE, BY APPLICATION, 2018-2030 (USD MILLION)
- TABLE 66. ISRAEL AGROSCIENCE MARKET SIZE, BY PRODUCT, 2018-2030 (USD MILLION)
- TABLE 67. ISRAEL AGROSCIENCE MARKET SIZE, BY APPLICATION, 2018-2030 (USD MILLION)
- TABLE 68. ITALY AGROSCIENCE MARKET SIZE, BY PRODUCT, 2018-2030 (USD MILLION)
- TABLE 69. ITALY AGROSCIENCE MARKET SIZE, BY APPLICATION, 2018-2030 (USD MILLION)
- TABLE 70. NETHERLANDS AGROSCIENCE MARKET SIZE, BY PRODUCT, 2018-2030 (USD MILLION)
- TABLE 71. NETHERLANDS AGROSCIENCE MARKET SIZE, BY APPLICATION, 2018-2030 (USD MILLION)
- TABLE 72. NIGERIA AGROSCIENCE MARKET SIZE, BY PRODUCT, 2018-2030 (USD MILLION)
- TABLE 73. NIGERIA AGROSCIENCE MARKET SIZE, BY APPLICATION, 2018-2030 (USD MILLION)
- TABLE 74. NORWAY AGROSCIENCE MARKET SIZE, BY PRODUCT, 2018-2030 (USD MILLION)
- TABLE 75. NORWAY AGROSCIENCE MARKET SIZE, BY APPLICATION, 2018-2030 (USD MILLION)
- TABLE 76. POLAND AGROSCIENCE MARKET SIZE, BY PRODUCT, 2018-2030 (USD MILLION)
- TABLE 77. POLAND AGROSCIENCE MARKET SIZE, BY APPLICATION, 2018-2030 (USD MILLION)
- TABLE 78. QATAR AGROSCIENCE MARKET SIZE, BY PRODUCT, 2018-2030 (USD MILLION)
- TABLE 79. QATAR AGROSCIENCE MARKET SIZE, BY APPLICATION, 2018-2030 (USD MILLION)
- TABLE 80. RUSSIA AGROSCIENCE MARKET SIZE, BY PRODUCT, 2018-2030 (USD MILLION)
- TABLE 81. RUSSIA AGROSCIENCE MARKET SIZE, BY APPLICATION, 2018-2030 (USD MILLION)
- TABLE 82. SAUDI ARABIA AGROSCIENCE MARKET SIZE, BY PRODUCT, 2018-2030 (USD MILLION)
- TABLE 83. SAUDI ARABIA AGROSCIENCE MARKET SIZE, BY APPLICATION, 2018-2030 (USD MILLION)
- TABLE 84. SOUTH AFRICA AGROSCIENCE MARKET SIZE, BY PRODUCT, 2018-2030 (USD MILLION)
- TABLE 85. SOUTH AFRICA AGROSCIENCE MARKET SIZE, BY APPLICATION, 2018-2030 (USD MILLION)
- TABLE 86. SPAIN AGROSCIENCE MARKET SIZE, BY PRODUCT, 2018-2030 (USD MILLION)
- TABLE 87. SPAIN AGROSCIENCE MARKET SIZE, BY APPLICATION, 2018-2030 (USD MILLION)
- TABLE 88. SWEDEN AGROSCIENCE MARKET SIZE, BY PRODUCT, 2018-2030 (USD MILLION)
- TABLE 89. SWEDEN AGROSCIENCE MARKET SIZE, BY APPLICATION, 2018-2030 (USD MILLION)
- TABLE 90. SWITZERLAND AGROSCIENCE MARKET SIZE, BY PRODUCT, 2018-2030 (USD MILLION)
- TABLE 91. SWITZERLAND AGROSCIENCE MARKET SIZE, BY APPLICATION, 2018-2030 (USD MILLION)
- TABLE 92. TURKEY AGROSCIENCE MARKET SIZE, BY PRODUCT, 2018-2030 (USD MILLION)
- TABLE 93. TURKEY AGROSCIENCE MARKET SIZE, BY APPLICATION, 2018-2030 (USD MILLION)
- TABLE 94. UNITED ARAB EMIRATES AGROSCIENCE MARKET SIZE, BY PRODUCT, 2018-2030 (USD MILLION)
- TABLE 95. UNITED ARAB EMIRATES AGROSCIENCE MARKET SIZE, BY APPLICATION, 2018-2030 (USD MILLION)
- TABLE 96. UNITED KINGDOM AGROSCIENCE MARKET SIZE, BY PRODUCT, 2018-2030 (USD MILLION)
- TABLE 97. UNITED KINGDOM AGROSCIENCE MARKET SIZE, BY APPLICATION, 2018-2030 (USD MILLION)
- TABLE 98. AGROSCIENCE MARKET, FPNV POSITIONING MATRIX, 2023
- TABLE 99. AGROSCIENCE MARKET SHARE, BY KEY PLAYER, 2023
- TABLE 100. AGROSCIENCE MARKET LICENSE & PRICING
 农业助剂市场:依功能、配方、化学组、作物、应用分类 - 2024-2030 年全球预测
 农业科学市场 - 全球产业规模、份额、趋势、机会和预测,按产品类型(基因改造种子、生物农药、生物刺激剂)、最终用户、地区和竞争细分,2019-2029F
 2024-2032 年按产品(基因改造 (GM) 种子、生物农药、生物刺激剂)和地区分類的农业科学市场报告
 2024 年农业助剂全球市场报告
 农业助剂:市场占有率分析、产业趋势与统计、成长预测(2024-2029)
 农用助剂市场-2024年至2029年预测
 全球农业助剂的成长机会
 农业助剂市场报告(按类型(活化助剂、实用助剂)、作物类型(谷物和油籽、水果和蔬菜等)、应用(除草剂、杀菌剂、杀虫剂等)和地区 2024-2032
 2024 年农业科学全球市场报告
 农业用化学品的中国市场