


 |
市场调查报告书
商品编码
1434571
医用生物聚合物市场:按类型、来源、应用分类 - 2023-2030 年全球预测Biopolymers for Medical Applications Market by Type (Bio-Based Polyethylene, Bio-degradable Starch Blends, Bio-PC), Source (Natural, Synthetic), Application - Global Forecast 2023-2030 |
||||||
※ 本网页内容可能与最新版本有所差异。详细情况请与我们联繫。
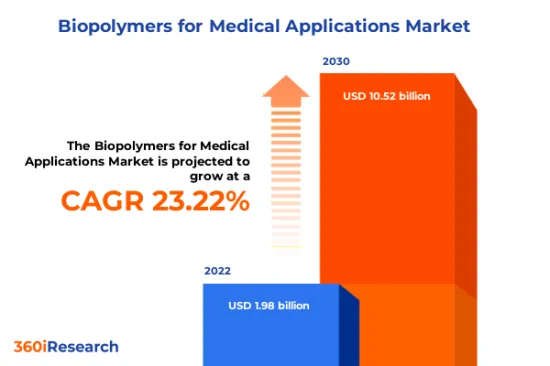
预计2022年医用生物聚合物市场规模为19.8亿美元,预计2023年将达24.3亿美元,2030年将达到105.2亿美元,复合年增长率为23.22%。
医用生物聚合物的全球市场
| 主要市场统计 | |
|---|---|
| 基准年[2022] | 19.8亿美元 |
| 预测年份 [2023] | 24.3亿美元 |
| 预测年份 [2030] | 105.2亿美元 |
| 复合年增长率(%) | 23.22% |
由于现代医疗产业不断变化的需求,医用生物聚合物市场正在经历显着成长。这些天然和生物合成的聚合物对于製造尖端医疗工具和设备至关重要,例如可生物分解性的支架、药物传输系统和缝合线,所有这些都与人体相容,因其耐用性、自然降解性而受到高度评价,且毒性低。其应用范围广泛,包括再生医学、製药和外科手术。对生物相容性材料的需求迅速增长、生物聚合物的突破性技术进步以及慢性病患病率的上升推动了市场的扩张。该市场充满了充满希望的机会,包括具有提高的生产效率和智慧功能特性(例如刺激响应性)的新型生物聚合物。然而,该行业面临一定的限制,包括不断上升的研发成本、严格的监管环境以及来自合成聚合物的激烈竞争。毫无疑问,创新和研究至关重要,包括开发满足特定医疗需求的生物聚合物并优化其临床使用性能。此外,探索永续生产方法并与医疗保健公司建立牢固的关係是发展这个令人兴奋的领域的关键。
区域洞察
美国由于其强大的医疗基础设施而处于医用生物聚合物消费和创新的前沿。先进的医疗设施、不断增长的老年人口以及对永续材料的强烈关注正在推动需求。加拿大的努力与美国一致,强调生态影响以及将生物聚合物整合到先进的伤口护理和整形外科中。北美拥有最新的专利、研究和投资,是生物聚合物创新的发源地。欧盟国家正积极努力减少对环境的影响,并积极支持生物聚合物在医疗领域的应用。大部分需求受到该地区医疗设备和材料强有力的法律规范的影响,特别是环保和永续的医疗设备和材料。欧盟最近的投资大量涌入专门研究生物聚合物的研究机构,欧洲专利局等机构继续发布新专利,展示了充满活力的创新格局。中国、日本和印度是亚太地区生物聚合物市场的领先参与者。该地区代表了一个消费者需求多样化的市场,从印度负担得起的医疗保健解决方案到日本先进的医疗技术。
FPNV定位矩阵
FPNV定位矩阵对于评估医用生物聚合物市场至关重要。我们检视与业务策略和产品满意度相关的关键指标,以对供应商进行全面评估。这种深入的分析使用户能够根据自己的要求做出明智的决策。根据评估,供应商被分为四个成功程度不同的像限:前沿(F)、探路者(P)、利基(N)和重要(V)。
市场占有率分析
市场占有率分析是一种综合工具,可以对医用生物聚合物市场供应商的现状进行深入而详细的研究。全面比较和分析供应商在整体收益、基本客群和其他关键指标方面的贡献,以便更好地了解公司的绩效及其在争夺市场占有率时面临的挑战。此外,该分析还提供了对该行业竞争特征的宝贵见解,包括在研究基准年观察到的累积、分散主导地位和合併特征等因素。这种详细程度的提高使供应商能够做出更明智的决策并制定有效的策略,从而在市场上获得竞争优势。
该报告对以下几个方面提供了宝贵的见解:
1-市场渗透率:提供有关主要企业所服务的市场的全面资讯。
2-市场开拓:我们深入研究利润丰厚的新兴市场并分析其在成熟细分市场的渗透率。
3- 市场多元化:提供有关新产品发布、开拓地区、最新发展和投资的详细资讯。
4-竞争力评估与资讯:对主要企业的市场占有率、策略、产品、认证、监管状况、专利状况、製造能力等进行全面评估。
5- 产品开发与创新:提供对未来技术、研发活动和突破性产品开发的见解。
本报告解决了以下关键问题:
1-医用生物聚合物市场的市场规模与预测是多少?
2-在医用生物聚合物市场的预测期内,有哪些产品、细分市场、应用和领域需要考虑投资?
3-医用生物聚合物市场的技术趋势和法律规范是什么?
4-医用生物聚合物市场主要供应商的市场占有率是多少?
5-进入医用生物聚合物市场合适的型态和策略手段是什么?
目录
第一章 前言
第二章调查方法
第三章执行摘要
第四章市场概况
第五章市场洞察
- 市场动态
- 促进因素
- 医疗设备和植入製造对生物聚合物的需求增加
- 扩大生物聚合物在先进影像和骨骼组织特异性治疗的应用
- 生物高分子灭菌技术的开发
- 抑制因素
- 与生物聚合物相关的性能问题
- 机会
- 生物聚合物创新与永续生产
- 奈米颗粒药物传输系统在癌症中的普及
- 任务
- 与合成生物聚合物相关的生物相容性问题
- 促进因素
- 市场区隔分析
- 类型:日益增强的永续性导向强调生物聚合物的医疗应用
- 资料来源:合成生物聚合物由于其增强的生物相容性、生物功能性、机械性能、降解率和免疫抗原性而受到越来越多的需求
- 应用:透过提升组织生成能力,扩大在药物发现和伤口闭合方面的应用
- 市场趋势分析
- COVID-19 的累积影响
- 俄罗斯-乌克兰衝突的累积影响
- 高通膨的累积效应
- 波特五力分析
- 价值炼和关键路径分析
- 法律规范
- 客户客製化
- 专利分析及趋势
第六章医用生物聚合物市场:依类型
- 生物基聚乙烯
- 生物分解性淀粉混合物
- 生物电脑
- Bio-Pet
- 生物聚氨酯
- 纤维素衍生物
- Pha
- 再生纤维素
第七章医用生物聚合物市场:依来源分类
- 自然的
- 合成
第八章医用生物聚合物市场:依应用分类
- 生物可吸收支架
- 牙科
- 药物输送系统
- 治疗产品
- 手术植入装置
- 治疗影像处理
- 伤口缝合
第九章美洲医用生物聚合物市场
- 阿根廷
- 巴西
- 加拿大
- 墨西哥
- 美国
第10章亚太医用生物聚合物市场
- 澳洲
- 中国
- 印度
- 印尼
- 日本
- 马来西亚
- 菲律宾
- 新加坡
- 韩国
- 台湾
- 泰国
- 越南
第十一章欧洲、中东和非洲医用生物聚合物市场
- 丹麦
- 埃及
- 芬兰
- 法国
- 德国
- 以色列
- 义大利
- 荷兰
- 奈及利亚
- 挪威
- 波兰
- 卡达
- 俄罗斯
- 沙乌地阿拉伯
- 南非
- 西班牙
- 瑞典
- 瑞士
- 土耳其
- 阿拉伯聯合大公国
- 英国
第十二章竞争形势
- FPNV定位矩阵
- 市场占有率分析:主要企业
- 主要企业竞争情境分析
- 併购
- 奖项/奖励/扩展
第13章竞争产品组合
- 主要公司简介
- BASF SE
- Biesterfeld AG
- BioPolymer GmbH & Co. KG
- Blafar Ltd.
- Corbion NV
- Danimer Scientific, Inc.
- DuPont de Nemours, Inc.
- Eastman Chemical Company
- Evonik Industries AG
- Geistlich Pharma AG
- GELITA AG
- Green Dot Bioplastics Inc.
- HTL
- HyMedPoly
- Invibio Ltd. by Victrex PLC
- ITV Denkendorf Product Service GmbH
- Merck & Co., Inc.
- NatureWorks LLC
- Rodenburg Productie BV
- Solvay SA
- SolyPlus GmbH
- Symatese
- Tate & Lyle PLC
- Thermo Fisher Scientific, Inc.
- Toray Industries Inc.
- 主要产品系列
第十四章附录
- 讨论指南
- 关于许可证和定价
[184 Pages Report] The Biopolymers for Medical Applications Market size was estimated at USD 1.98 billion in 2022 and expected to reach USD 2.43 billion in 2023, at a CAGR 23.22% to reach USD 10.52 billion by 2030.
Global Biopolymers for Medical Applications Market
| KEY MARKET STATISTICS | |
|---|---|
| Base Year [2022] | USD 1.98 billion |
| Estimated Year [2023] | USD 2.43 billion |
| Forecast Year [2030] | USD 10.52 billion |
| CAGR (%) | 23.22% |
Biopolymer market for medical applications is experiencing significant growth owing to the ever-evolving demands of the modern healthcare industry. These natural or biologically synthesized polymers are essential in the creation of cutting-edge medical tools and devices, including biodegradable stents, drug delivery systems, and sutures, all admired for their compatibility with the human body, natural decomposition, and reduced toxicity. Their applications are diverse, spanning regenerative medicine, pharmaceuticals, and surgical procedures. Market expansion is fueled by the surging need for biocompatible materials, groundbreaking technological progression in biopolymers, and a rising prevalence of chronic diseases. The market teems with opportunities, promising advances in production efficiency and novel biopolymers featuring smart functional properties such as stimuli-responsiveness. Nevertheless, the industry faces certain constraints, including the steep costs of research and development, stringent regulatory landscapes, and stiff competition from synthetic polymers. Undoubtedly, innovation and research are pivotal, focusing on developing tailored biopolymers for specific medical needs and optimizing performance to align with clinical applications. Additionally, exploring sustainable production methods and forging strong relationships with healthcare entities will be instrumental in advancing this exciting field.
Regional Insights
The United States is at the forefront in the consumption and innovation of biopolymers for medical applications due to its robust medical infrastructure. The demand is driven by advanced healthcare facilities, a growing elderly population, and a strong focus on sustainable materials. Canadian efforts align with those of the US, emphasizing ecological impact and the integration of biopolymers in advanced wound care and orthopedics. In terms of latest patents, research and investment, North America is a productive ground for innovation in biopolymer technology. EU countries exhibit a robust commitment to reducing environmental impact, which translates to active support for biopolymer applications in the medical sector. Much of the demand is influenced by the region's strong regulatory framework for medical devices and materials, particularly those that are eco-friendly and sustainable. Recent investments in the EU are funneled into research institutions focusing on biopolymers, and institutions such as the European Patent Office showcase a steady stream of new patents, indicating a dynamic innovation landscape. In Asia Pacific's biopolymer market, China, Japan, and India are prominent players. The region presents a diverse market with consumer needs varying from affordable healthcare solutions in India to advanced medical technologies in Japan.
FPNV Positioning Matrix
The FPNV Positioning Matrix is pivotal in evaluating the Biopolymers for Medical Applications Market. It offers a comprehensive assessment of vendors, examining key metrics related to Business Strategy and Product Satisfaction. This in-depth analysis empowers users to make well-informed decisions aligned with their requirements. Based on the evaluation, the vendors are then categorized into four distinct quadrants representing varying levels of success: Forefront (F), Pathfinder (P), Niche (N), or Vital (V).
Market Share Analysis
The Market Share Analysis is a comprehensive tool that provides an insightful and in-depth examination of the current state of vendors in the Biopolymers for Medical Applications Market. By meticulously comparing and analyzing vendor contributions in terms of overall revenue, customer base, and other key metrics, we can offer companies a greater understanding of their performance and the challenges they face when competing for market share. Additionally, this analysis provides valuable insights into the competitive nature of the sector, including factors such as accumulation, fragmentation dominance, and amalgamation traits observed over the base year period studied. With this expanded level of detail, vendors can make more informed decisions and devise effective strategies to gain a competitive edge in the market.
Key Company Profiles
The report delves into recent significant developments in the Biopolymers for Medical Applications Market, highlighting leading vendors and their innovative profiles. These include BASF SE, Biesterfeld AG, BioPolymer GmbH & Co. KG, Blafar Ltd., Corbion NV, Danimer Scientific, Inc., DuPont de Nemours, Inc., Eastman Chemical Company, Evonik Industries AG, Geistlich Pharma AG, GELITA AG, Green Dot Bioplastics Inc., HTL, HyMedPoly, Invibio Ltd. by Victrex PLC, ITV Denkendorf Product Service GmbH, Merck & Co., Inc., NatureWorks LLC, Rodenburg Productie B.V., Solvay S.A., SolyPlus GmbH, Symatese, Tate & Lyle PLC, Thermo Fisher Scientific, Inc., and Toray Industries Inc..
Market Segmentation & Coverage
This research report categorizes the Biopolymers for Medical Applications Market to forecast the revenues and analyze trends in each of the following sub-markets:
- Type
- Bio-Based Polyethylene
- Bio-degradable Starch Blends
- Bio-PC
- Bio-PET
- Bio-PUR
- Cellulose Derivatives
- PHA
- Regenerated Cellulose
- Source
- Natural
- Synthetic
- Application
- Bioresorbable Scaffolds
- Dentistry
- Drug Delivery Systems.
- Healing Products
- Surgical Implant Devices
- Therapeutic Imaging
- Wound Closure
- Region
- Americas
- Argentina
- Brazil
- Canada
- Mexico
- United States
- California
- Florida
- Illinois
- New York
- Ohio
- Pennsylvania
- Texas
- Asia-Pacific
- Australia
- China
- India
- Indonesia
- Japan
- Malaysia
- Philippines
- Singapore
- South Korea
- Taiwan
- Thailand
- Vietnam
- Europe, Middle East & Africa
- Denmark
- Egypt
- Finland
- France
- Germany
- Israel
- Italy
- Netherlands
- Nigeria
- Norway
- Poland
- Qatar
- Russia
- Saudi Arabia
- South Africa
- Spain
- Sweden
- Switzerland
- Turkey
- United Arab Emirates
- United Kingdom
- Americas
The report offers valuable insights on the following aspects:
1. Market Penetration: It presents comprehensive information on the market provided by key players.
2. Market Development: It delves deep into lucrative emerging markets and analyzes the penetration across mature market segments.
3. Market Diversification: It provides detailed information on new product launches, untapped geographic regions, recent developments, and investments.
4. Competitive Assessment & Intelligence: It conducts an exhaustive assessment of market shares, strategies, products, certifications, regulatory approvals, patent landscape, and manufacturing capabilities of the leading players.
5. Product Development & Innovation: It offers intelligent insights on future technologies, R&D activities, and breakthrough product developments.
The report addresses key questions such as:
1. What is the market size and forecast of the Biopolymers for Medical Applications Market?
2. Which products, segments, applications, and areas should one consider investing in over the forecast period in the Biopolymers for Medical Applications Market?
3. What are the technology trends and regulatory frameworks in the Biopolymers for Medical Applications Market?
4. What is the market share of the leading vendors in the Biopolymers for Medical Applications Market?
5. Which modes and strategic moves are suitable for entering the Biopolymers for Medical Applications Market?
Table of Contents
1. Preface
- 1.1. Objectives of the Study
- 1.2. Market Segmentation & Coverage
- 1.3. Years Considered for the Study
- 1.4. Currency & Pricing
- 1.5. Language
- 1.6. Limitations
- 1.7. Assumptions
- 1.8. Stakeholders
2. Research Methodology
- 2.1. Define: Research Objective
- 2.2. Determine: Research Design
- 2.3. Prepare: Research Instrument
- 2.4. Collect: Data Source
- 2.5. Analyze: Data Interpretation
- 2.6. Formulate: Data Verification
- 2.7. Publish: Research Report
- 2.8. Repeat: Report Update
3. Executive Summary
4. Market Overview
- 4.1. Introduction
- 4.2. Biopolymers for Medical Applications Market, by Region
5. Market Insights
- 5.1. Market Dynamics
- 5.1.1. Drivers
- 5.1.1.1. Increasing Biopolymers demand for Manufacturing of Medical Devices and Implants
- 5.1.1.2. Growing Adoption of Biopolymers for Advanced Imaging and Skeletal Tissue-Specific Therapeutics
- 5.1.1.3. Development of Sterilization Technology for Biopolymers
- 5.1.2. Restraints
- 5.1.2.1. Performance Issues Associated with the Biopolymers
- 5.1.3. Opportunities
- 5.1.3.1. Innovations and Sustainable Production of Biopolymers
- 5.1.3.2. Proliferation of Nano-Particle Drug Delivery Systems in Cancer
- 5.1.4. Challenges
- 5.1.4.1. Biocompatibility Issues Associated with Synthetic Biopolymers
- 5.1.1. Drivers
- 5.2. Market Segmentation Analysis
- 5.2.1. Type: Rising inclination toward the sustainability is emphasizing focus on application of biopolymers healthcare
- 5.2.2. Source: Synthetic biopolymers are in demand due to enhanced biocompatibility, biofunctionality, mechanical properties, degradation rates, and immunogenicity
- 5.2.3. Application: Expandable use in drug discovery, and wound closure owing to the rising tissue generation capability
- 5.3. Market Trend Analysis
- 5.4. Cumulative Impact of COVID-19
- 5.5. Cumulative Impact of Russia-Ukraine Conflict
- 5.6. Cumulative Impact of High Inflation
- 5.7. Porter's Five Forces Analysis
- 5.7.1. Threat of New Entrants
- 5.7.2. Threat of Substitutes
- 5.7.3. Bargaining Power of Customers
- 5.7.4. Bargaining Power of Suppliers
- 5.7.5. Industry Rivalry
- 5.8. Value Chain & Critical Path Analysis
- 5.9. Regulatory Framework
- 5.10. Client Customization
- 5.10.1. Patent Analysis & Trend
6. Biopolymers for Medical Applications Market, by Type
- 6.1. Introduction
- 6.2. Bio-Based Polyethylene
- 6.3. Bio-degradable Starch Blends
- 6.4. Bio-PC
- 6.5. Bio-PET
- 6.6. Bio-PUR
- 6.7. Cellulose Derivatives
- 6.8. PHA
- 6.9. Regenerated Cellulose
7. Biopolymers for Medical Applications Market, by Source
- 7.1. Introduction
- 7.2. Natural
- 7.3. Synthetic
8. Biopolymers for Medical Applications Market, by Application
- 8.1. Introduction
- 8.2. Bioresorbable Scaffolds
- 8.3. Dentistry
- 8.4. Drug Delivery Systems.
- 8.5. Healing Products
- 8.6. Surgical Implant Devices
- 8.7. Therapeutic Imaging
- 8.8. Wound Closure
9. Americas Biopolymers for Medical Applications Market
- 9.1. Introduction
- 9.2. Argentina
- 9.3. Brazil
- 9.4. Canada
- 9.5. Mexico
- 9.6. United States
10. Asia-Pacific Biopolymers for Medical Applications Market
- 10.1. Introduction
- 10.2. Australia
- 10.3. China
- 10.4. India
- 10.5. Indonesia
- 10.6. Japan
- 10.7. Malaysia
- 10.8. Philippines
- 10.9. Singapore
- 10.10. South Korea
- 10.11. Taiwan
- 10.12. Thailand
- 10.13. Vietnam
11. Europe, Middle East & Africa Biopolymers for Medical Applications Market
- 11.1. Introduction
- 11.2. Denmark
- 11.3. Egypt
- 11.4. Finland
- 11.5. France
- 11.6. Germany
- 11.7. Israel
- 11.8. Italy
- 11.9. Netherlands
- 11.10. Nigeria
- 11.11. Norway
- 11.12. Poland
- 11.13. Qatar
- 11.14. Russia
- 11.15. Saudi Arabia
- 11.16. South Africa
- 11.17. Spain
- 11.18. Sweden
- 11.19. Switzerland
- 11.20. Turkey
- 11.21. United Arab Emirates
- 11.22. United Kingdom
12. Competitive Landscape
- 12.1. FPNV Positioning Matrix
- 12.2. Market Share Analysis, By Key Player
- 12.3. Competitive Scenario Analysis, By Key Player
- 12.3.1. Merger & Acquisition
- 12.3.1.1. DuPont Completes Acquisition of Spectrum Plastics Group
- 12.3.1.2. Sanofi completes acquisition of Provention Bio, Inc.
- 12.3.2. Award, Recognition, & Expansion
- 12.3.2.1. Victrex Invests In New Medical Device Product Development Centre And Manufacturing Expansion
- 12.3.1. Merger & Acquisition
13. Competitive Portfolio
- 13.1. Key Company Profiles
- 13.1.1. BASF SE
- 13.1.2. Biesterfeld AG
- 13.1.3. BioPolymer GmbH & Co. KG
- 13.1.4. Blafar Ltd.
- 13.1.5. Corbion NV
- 13.1.6. Danimer Scientific, Inc.
- 13.1.7. DuPont de Nemours, Inc.
- 13.1.8. Eastman Chemical Company
- 13.1.9. Evonik Industries AG
- 13.1.10. Geistlich Pharma AG
- 13.1.11. GELITA AG
- 13.1.12. Green Dot Bioplastics Inc.
- 13.1.13. HTL
- 13.1.14. HyMedPoly
- 13.1.15. Invibio Ltd. by Victrex PLC
- 13.1.16. ITV Denkendorf Product Service GmbH
- 13.1.17. Merck & Co., Inc.
- 13.1.18. NatureWorks LLC
- 13.1.19. Rodenburg Productie B.V.
- 13.1.20. Solvay S.A.
- 13.1.21. SolyPlus GmbH
- 13.1.22. Symatese
- 13.1.23. Tate & Lyle PLC
- 13.1.24. Thermo Fisher Scientific, Inc.
- 13.1.25. Toray Industries Inc.
- 13.2. Key Product Portfolio
14. Appendix
- 14.1. Discussion Guide
- 14.2. License & Pricing
LIST OF FIGURES
- FIGURE 1. BIOPOLYMERS FOR MEDICAL APPLICATIONS MARKET RESEARCH PROCESS
- FIGURE 2. BIOPOLYMERS FOR MEDICAL APPLICATIONS MARKET SIZE, 2022 VS 2030
- FIGURE 3. BIOPOLYMERS FOR MEDICAL APPLICATIONS MARKET SIZE, 2018-2030 (USD MILLION)
- FIGURE 4. BIOPOLYMERS FOR MEDICAL APPLICATIONS MARKET SIZE, BY REGION, 2022 VS 2030 (%)
- FIGURE 5. BIOPOLYMERS FOR MEDICAL APPLICATIONS MARKET SIZE, BY REGION, 2022 VS 2023 VS 2030 (USD MILLION)
- FIGURE 6. BIOPOLYMERS FOR MEDICAL APPLICATIONS MARKET DYNAMICS
- FIGURE 7. BIOPOLYMERS FOR MEDICAL APPLICATIONS MARKET SIZE, BY TYPE, 2022 VS 2030 (%)
- FIGURE 8. BIOPOLYMERS FOR MEDICAL APPLICATIONS MARKET SIZE, BY TYPE, 2022 VS 2023 VS 2030 (USD MILLION)
- FIGURE 9. BIOPOLYMERS FOR MEDICAL APPLICATIONS MARKET SIZE, BY SOURCE, 2022 VS 2030 (%)
- FIGURE 10. BIOPOLYMERS FOR MEDICAL APPLICATIONS MARKET SIZE, BY SOURCE, 2022 VS 2023 VS 2030 (USD MILLION)
- FIGURE 11. BIOPOLYMERS FOR MEDICAL APPLICATIONS MARKET SIZE, BY APPLICATION, 2022 VS 2030 (%)
- FIGURE 12. BIOPOLYMERS FOR MEDICAL APPLICATIONS MARKET SIZE, BY APPLICATION, 2022 VS 2023 VS 2030 (USD MILLION)
- FIGURE 13. AMERICAS BIOPOLYMERS FOR MEDICAL APPLICATIONS MARKET SIZE, BY COUNTRY, 2022 VS 2030 (%)
- FIGURE 14. AMERICAS BIOPOLYMERS FOR MEDICAL APPLICATIONS MARKET SIZE, BY COUNTRY, 2022 VS 2023 VS 2030 (USD MILLION)
- FIGURE 15. UNITED STATES BIOPOLYMERS FOR MEDICAL APPLICATIONS MARKET SIZE, BY STATE, 2022 VS 2030 (%)
- FIGURE 16. UNITED STATES BIOPOLYMERS FOR MEDICAL APPLICATIONS MARKET SIZE, BY STATE, 2022 VS 2023 VS 2030 (USD MILLION)
- FIGURE 17. ASIA-PACIFIC BIOPOLYMERS FOR MEDICAL APPLICATIONS MARKET SIZE, BY COUNTRY, 2022 VS 2030 (%)
- FIGURE 18. ASIA-PACIFIC BIOPOLYMERS FOR MEDICAL APPLICATIONS MARKET SIZE, BY COUNTRY, 2022 VS 2023 VS 2030 (USD MILLION)
- FIGURE 19. EUROPE, MIDDLE EAST & AFRICA BIOPOLYMERS FOR MEDICAL APPLICATIONS MARKET SIZE, BY COUNTRY, 2022 VS 2030 (%)
- FIGURE 20. EUROPE, MIDDLE EAST & AFRICA BIOPOLYMERS FOR MEDICAL APPLICATIONS MARKET SIZE, BY COUNTRY, 2022 VS 2023 VS 2030 (USD MILLION)
- FIGURE 21. BIOPOLYMERS FOR MEDICAL APPLICATIONS MARKET, FPNV POSITIONING MATRIX, 2022
- FIGURE 22. BIOPOLYMERS FOR MEDICAL APPLICATIONS MARKET SHARE, BY KEY PLAYER, 2022
LIST OF TABLES
- TABLE 1. BIOPOLYMERS FOR MEDICAL APPLICATIONS MARKET SEGMENTATION & COVERAGE
- TABLE 2. UNITED STATES DOLLAR EXCHANGE RATE, 2018-2022
- TABLE 3. BIOPOLYMERS FOR MEDICAL APPLICATIONS MARKET SIZE, 2018-2030 (USD MILLION)
- TABLE 4. GLOBAL BIOPOLYMERS FOR MEDICAL APPLICATIONS MARKET SIZE, BY REGION, 2018-2030 (USD MILLION)
- TABLE 5. BIOPOLYMERS FOR MEDICAL APPLICATIONS MARKET SIZE, BY TYPE, 2018-2030 (USD MILLION)
- TABLE 6. BIOPOLYMERS FOR MEDICAL APPLICATIONS MARKET SIZE, BY BIO-BASED POLYETHYLENE, BY REGION, 2018-2030 (USD MILLION)
- TABLE 7. BIOPOLYMERS FOR MEDICAL APPLICATIONS MARKET SIZE, BY BIO-DEGRADABLE STARCH BLENDS, BY REGION, 2018-2030 (USD MILLION)
- TABLE 8. BIOPOLYMERS FOR MEDICAL APPLICATIONS MARKET SIZE, BY BIO-PC, BY REGION, 2018-2030 (USD MILLION)
- TABLE 9. BIOPOLYMERS FOR MEDICAL APPLICATIONS MARKET SIZE, BY BIO-PET, BY REGION, 2018-2030 (USD MILLION)
- TABLE 10. BIOPOLYMERS FOR MEDICAL APPLICATIONS MARKET SIZE, BY BIO-PUR, BY REGION, 2018-2030 (USD MILLION)
- TABLE 11. BIOPOLYMERS FOR MEDICAL APPLICATIONS MARKET SIZE, BY CELLULOSE DERIVATIVES, BY REGION, 2018-2030 (USD MILLION)
- TABLE 12. BIOPOLYMERS FOR MEDICAL APPLICATIONS MARKET SIZE, BY PHA, BY REGION, 2018-2030 (USD MILLION)
- TABLE 13. BIOPOLYMERS FOR MEDICAL APPLICATIONS MARKET SIZE, BY REGENERATED CELLULOSE, BY REGION, 2018-2030 (USD MILLION)
- TABLE 14. BIOPOLYMERS FOR MEDICAL APPLICATIONS MARKET SIZE, BY SOURCE, 2018-2030 (USD MILLION)
- TABLE 15. BIOPOLYMERS FOR MEDICAL APPLICATIONS MARKET SIZE, BY NATURAL, BY REGION, 2018-2030 (USD MILLION)
- TABLE 16. BIOPOLYMERS FOR MEDICAL APPLICATIONS MARKET SIZE, BY SYNTHETIC, BY REGION, 2018-2030 (USD MILLION)
- TABLE 17. BIOPOLYMERS FOR MEDICAL APPLICATIONS MARKET SIZE, BY APPLICATION, 2018-2030 (USD MILLION)
- TABLE 18. BIOPOLYMERS FOR MEDICAL APPLICATIONS MARKET SIZE, BY BIORESORBABLE SCAFFOLDS, BY REGION, 2018-2030 (USD MILLION)
- TABLE 19. BIOPOLYMERS FOR MEDICAL APPLICATIONS MARKET SIZE, BY DENTISTRY, BY REGION, 2018-2030 (USD MILLION)
- TABLE 20. BIOPOLYMERS FOR MEDICAL APPLICATIONS MARKET SIZE, BY DRUG DELIVERY SYSTEMS., BY REGION, 2018-2030 (USD MILLION)
- TABLE 21. BIOPOLYMERS FOR MEDICAL APPLICATIONS MARKET SIZE, BY HEALING PRODUCTS, BY REGION, 2018-2030 (USD MILLION)
- TABLE 22. BIOPOLYMERS FOR MEDICAL APPLICATIONS MARKET SIZE, BY SURGICAL IMPLANT DEVICES, BY REGION, 2018-2030 (USD MILLION)
- TABLE 23. BIOPOLYMERS FOR MEDICAL APPLICATIONS MARKET SIZE, BY THERAPEUTIC IMAGING, BY REGION, 2018-2030 (USD MILLION)
- TABLE 24. BIOPOLYMERS FOR MEDICAL APPLICATIONS MARKET SIZE, BY WOUND CLOSURE, BY REGION, 2018-2030 (USD MILLION)
- TABLE 25. AMERICAS BIOPOLYMERS FOR MEDICAL APPLICATIONS MARKET SIZE, BY TYPE, 2018-2030 (USD MILLION)
- TABLE 26. AMERICAS BIOPOLYMERS FOR MEDICAL APPLICATIONS MARKET SIZE, BY SOURCE, 2018-2030 (USD MILLION)
- TABLE 27. AMERICAS BIOPOLYMERS FOR MEDICAL APPLICATIONS MARKET SIZE, BY APPLICATION, 2018-2030 (USD MILLION)
- TABLE 28. AMERICAS BIOPOLYMERS FOR MEDICAL APPLICATIONS MARKET SIZE, BY COUNTRY, 2018-2030 (USD MILLION)
- TABLE 29. ARGENTINA BIOPOLYMERS FOR MEDICAL APPLICATIONS MARKET SIZE, BY TYPE, 2018-2030 (USD MILLION)
- TABLE 30. ARGENTINA BIOPOLYMERS FOR MEDICAL APPLICATIONS MARKET SIZE, BY SOURCE, 2018-2030 (USD MILLION)
- TABLE 31. ARGENTINA BIOPOLYMERS FOR MEDICAL APPLICATIONS MARKET SIZE, BY APPLICATION, 2018-2030 (USD MILLION)
- TABLE 32. BRAZIL BIOPOLYMERS FOR MEDICAL APPLICATIONS MARKET SIZE, BY TYPE, 2018-2030 (USD MILLION)
- TABLE 33. BRAZIL BIOPOLYMERS FOR MEDICAL APPLICATIONS MARKET SIZE, BY SOURCE, 2018-2030 (USD MILLION)
- TABLE 34. BRAZIL BIOPOLYMERS FOR MEDICAL APPLICATIONS MARKET SIZE, BY APPLICATION, 2018-2030 (USD MILLION)
- TABLE 35. CANADA BIOPOLYMERS FOR MEDICAL APPLICATIONS MARKET SIZE, BY TYPE, 2018-2030 (USD MILLION)
- TABLE 36. CANADA BIOPOLYMERS FOR MEDICAL APPLICATIONS MARKET SIZE, BY SOURCE, 2018-2030 (USD MILLION)
- TABLE 37. CANADA BIOPOLYMERS FOR MEDICAL APPLICATIONS MARKET SIZE, BY APPLICATION, 2018-2030 (USD MILLION)
- TABLE 38. MEXICO BIOPOLYMERS FOR MEDICAL APPLICATIONS MARKET SIZE, BY TYPE, 2018-2030 (USD MILLION)
- TABLE 39. MEXICO BIOPOLYMERS FOR MEDICAL APPLICATIONS MARKET SIZE, BY SOURCE, 2018-2030 (USD MILLION)
- TABLE 40. MEXICO BIOPOLYMERS FOR MEDICAL APPLICATIONS MARKET SIZE, BY APPLICATION, 2018-2030 (USD MILLION)
- TABLE 41. UNITED STATES BIOPOLYMERS FOR MEDICAL APPLICATIONS MARKET SIZE, BY TYPE, 2018-2030 (USD MILLION)
- TABLE 42. UNITED STATES BIOPOLYMERS FOR MEDICAL APPLICATIONS MARKET SIZE, BY SOURCE, 2018-2030 (USD MILLION)
- TABLE 43. UNITED STATES BIOPOLYMERS FOR MEDICAL APPLICATIONS MARKET SIZE, BY APPLICATION, 2018-2030 (USD MILLION)
- TABLE 44. UNITED STATES BIOPOLYMERS FOR MEDICAL APPLICATIONS MARKET SIZE, BY STATE, 2018-2030 (USD MILLION)
- TABLE 45. ASIA-PACIFIC BIOPOLYMERS FOR MEDICAL APPLICATIONS MARKET SIZE, BY TYPE, 2018-2030 (USD MILLION)
- TABLE 46. ASIA-PACIFIC BIOPOLYMERS FOR MEDICAL APPLICATIONS MARKET SIZE, BY SOURCE, 2018-2030 (USD MILLION)
- TABLE 47. ASIA-PACIFIC BIOPOLYMERS FOR MEDICAL APPLICATIONS MARKET SIZE, BY APPLICATION, 2018-2030 (USD MILLION)
- TABLE 48. ASIA-PACIFIC BIOPOLYMERS FOR MEDICAL APPLICATIONS MARKET SIZE, BY COUNTRY, 2018-2030 (USD MILLION)
- TABLE 49. AUSTRALIA BIOPOLYMERS FOR MEDICAL APPLICATIONS MARKET SIZE, BY TYPE, 2018-2030 (USD MILLION)
- TABLE 50. AUSTRALIA BIOPOLYMERS FOR MEDICAL APPLICATIONS MARKET SIZE, BY SOURCE, 2018-2030 (USD MILLION)
- TABLE 51. AUSTRALIA BIOPOLYMERS FOR MEDICAL APPLICATIONS MARKET SIZE, BY APPLICATION, 2018-2030 (USD MILLION)
- TABLE 52. CHINA BIOPOLYMERS FOR MEDICAL APPLICATIONS MARKET SIZE, BY TYPE, 2018-2030 (USD MILLION)
- TABLE 53. CHINA BIOPOLYMERS FOR MEDICAL APPLICATIONS MARKET SIZE, BY SOURCE, 2018-2030 (USD MILLION)
- TABLE 54. CHINA BIOPOLYMERS FOR MEDICAL APPLICATIONS MARKET SIZE, BY APPLICATION, 2018-2030 (USD MILLION)
- TABLE 55. INDIA BIOPOLYMERS FOR MEDICAL APPLICATIONS MARKET SIZE, BY TYPE, 2018-2030 (USD MILLION)
- TABLE 56. INDIA BIOPOLYMERS FOR MEDICAL APPLICATIONS MARKET SIZE, BY SOURCE, 2018-2030 (USD MILLION)
- TABLE 57. INDIA BIOPOLYMERS FOR MEDICAL APPLICATIONS MARKET SIZE, BY APPLICATION, 2018-2030 (USD MILLION)
- TABLE 58. INDONESIA BIOPOLYMERS FOR MEDICAL APPLICATIONS MARKET SIZE, BY TYPE, 2018-2030 (USD MILLION)
- TABLE 59. INDONESIA BIOPOLYMERS FOR MEDICAL APPLICATIONS MARKET SIZE, BY SOURCE, 2018-2030 (USD MILLION)
- TABLE 60. INDONESIA BIOPOLYMERS FOR MEDICAL APPLICATIONS MARKET SIZE, BY APPLICATION, 2018-2030 (USD MILLION)
- TABLE 61. JAPAN BIOPOLYMERS FOR MEDICAL APPLICATIONS MARKET SIZE, BY TYPE, 2018-2030 (USD MILLION)
- TABLE 62. JAPAN BIOPOLYMERS FOR MEDICAL APPLICATIONS MARKET SIZE, BY SOURCE, 2018-2030 (USD MILLION)
- TABLE 63. JAPAN BIOPOLYMERS FOR MEDICAL APPLICATIONS MARKET SIZE, BY APPLICATION, 2018-2030 (USD MILLION)
- TABLE 64. MALAYSIA BIOPOLYMERS FOR MEDICAL APPLICATIONS MARKET SIZE, BY TYPE, 2018-2030 (USD MILLION)
- TABLE 65. MALAYSIA BIOPOLYMERS FOR MEDICAL APPLICATIONS MARKET SIZE, BY SOURCE, 2018-2030 (USD MILLION)
- TABLE 66. MALAYSIA BIOPOLYMERS FOR MEDICAL APPLICATIONS MARKET SIZE, BY APPLICATION, 2018-2030 (USD MILLION)
- TABLE 67. PHILIPPINES BIOPOLYMERS FOR MEDICAL APPLICATIONS MARKET SIZE, BY TYPE, 2018-2030 (USD MILLION)
- TABLE 68. PHILIPPINES BIOPOLYMERS FOR MEDICAL APPLICATIONS MARKET SIZE, BY SOURCE, 2018-2030 (USD MILLION)
- TABLE 69. PHILIPPINES BIOPOLYMERS FOR MEDICAL APPLICATIONS MARKET SIZE, BY APPLICATION, 2018-2030 (USD MILLION)
- TABLE 70. SINGAPORE BIOPOLYMERS FOR MEDICAL APPLICATIONS MARKET SIZE, BY TYPE, 2018-2030 (USD MILLION)
- TABLE 71. SINGAPORE BIOPOLYMERS FOR MEDICAL APPLICATIONS MARKET SIZE, BY SOURCE, 2018-2030 (USD MILLION)
- TABLE 72. SINGAPORE BIOPOLYMERS FOR MEDICAL APPLICATIONS MARKET SIZE, BY APPLICATION, 2018-2030 (USD MILLION)
- TABLE 73. SOUTH KOREA BIOPOLYMERS FOR MEDICAL APPLICATIONS MARKET SIZE, BY TYPE, 2018-2030 (USD MILLION)
- TABLE 74. SOUTH KOREA BIOPOLYMERS FOR MEDICAL APPLICATIONS MARKET SIZE, BY SOURCE, 2018-2030 (USD MILLION)
- TABLE 75. SOUTH KOREA BIOPOLYMERS FOR MEDICAL APPLICATIONS MARKET SIZE, BY APPLICATION, 2018-2030 (USD MILLION)
- TABLE 76. TAIWAN BIOPOLYMERS FOR MEDICAL APPLICATIONS MARKET SIZE, BY TYPE, 2018-2030 (USD MILLION)
- TABLE 77. TAIWAN BIOPOLYMERS FOR MEDICAL APPLICATIONS MARKET SIZE, BY SOURCE, 2018-2030 (USD MILLION)
- TABLE 78. TAIWAN BIOPOLYMERS FOR MEDICAL APPLICATIONS MARKET SIZE, BY APPLICATION, 2018-2030 (USD MILLION)
- TABLE 79. THAILAND BIOPOLYMERS FOR MEDICAL APPLICATIONS MARKET SIZE, BY TYPE, 2018-2030 (USD MILLION)
- TABLE 80. THAILAND BIOPOLYMERS FOR MEDICAL APPLICATIONS MARKET SIZE, BY SOURCE, 2018-2030 (USD MILLION)
- TABLE 81. THAILAND BIOPOLYMERS FOR MEDICAL APPLICATIONS MARKET SIZE, BY APPLICATION, 2018-2030 (USD MILLION)
- TABLE 82. VIETNAM BIOPOLYMERS FOR MEDICAL APPLICATIONS MARKET SIZE, BY TYPE, 2018-2030 (USD MILLION)
- TABLE 83. VIETNAM BIOPOLYMERS FOR MEDICAL APPLICATIONS MARKET SIZE, BY SOURCE, 2018-2030 (USD MILLION)
- TABLE 84. VIETNAM BIOPOLYMERS FOR MEDICAL APPLICATIONS MARKET SIZE, BY APPLICATION, 2018-2030 (USD MILLION)
- TABLE 85. EUROPE, MIDDLE EAST & AFRICA BIOPOLYMERS FOR MEDICAL APPLICATIONS MARKET SIZE, BY TYPE, 2018-2030 (USD MILLION)
- TABLE 86. EUROPE, MIDDLE EAST & AFRICA BIOPOLYMERS FOR MEDICAL APPLICATIONS MARKET SIZE, BY SOURCE, 2018-2030 (USD MILLION)
- TABLE 87. EUROPE, MIDDLE EAST & AFRICA BIOPOLYMERS FOR MEDICAL APPLICATIONS MARKET SIZE, BY APPLICATION, 2018-2030 (USD MILLION)
- TABLE 88. EUROPE, MIDDLE EAST & AFRICA BIOPOLYMERS FOR MEDICAL APPLICATIONS MARKET SIZE, BY COUNTRY, 2018-2030 (USD MILLION)
- TABLE 89. DENMARK BIOPOLYMERS FOR MEDICAL APPLICATIONS MARKET SIZE, BY TYPE, 2018-2030 (USD MILLION)
- TABLE 90. DENMARK BIOPOLYMERS FOR MEDICAL APPLICATIONS MARKET SIZE, BY SOURCE, 2018-2030 (USD MILLION)
- TABLE 91. DENMARK BIOPOLYMERS FOR MEDICAL APPLICATIONS MARKET SIZE, BY APPLICATION, 2018-2030 (USD MILLION)
- TABLE 92. EGYPT BIOPOLYMERS FOR MEDICAL APPLICATIONS MARKET SIZE, BY TYPE, 2018-2030 (USD MILLION)
- TABLE 93. EGYPT BIOPOLYMERS FOR MEDICAL APPLICATIONS MARKET SIZE, BY SOURCE, 2018-2030 (USD MILLION)
- TABLE 94. EGYPT BIOPOLYMERS FOR MEDICAL APPLICATIONS MARKET SIZE, BY APPLICATION, 2018-2030 (USD MILLION)
- TABLE 95. FINLAND BIOPOLYMERS FOR MEDICAL APPLICATIONS MARKET SIZE, BY TYPE, 2018-2030 (USD MILLION)
- TABLE 96. FINLAND BIOPOLYMERS FOR MEDICAL APPLICATIONS MARKET SIZE, BY SOURCE, 2018-2030 (USD MILLION)
- TABLE 97. FINLAND BIOPOLYMERS FOR MEDICAL APPLICATIONS MARKET SIZE, BY APPLICATION, 2018-2030 (USD MILLION)
- TABLE 98. FRANCE BIOPOLYMERS FOR MEDICAL APPLICATIONS MARKET SIZE, BY TYPE, 2018-2030 (USD MILLION)
- TABLE 99. FRANCE BIOPOLYMERS FOR MEDICAL APPLICATIONS MARKET SIZE, BY SOURCE, 2018-2030 (USD MILLION)
- TABLE 100. FRANCE BIOPOLYMERS FOR MEDICAL APPLICATIONS MARKET SIZE, BY APPLICATION, 2018-2030 (USD MILLION)
- TABLE 101. GERMANY BIOPOLYMERS FOR MEDICAL APPLICATIONS MARKET SIZE, BY TYPE, 2018-2030 (USD MILLION)
- TABLE 102. GERMANY BIOPOLYMERS FOR MEDICAL APPLICATIONS MARKET SIZE, BY SOURCE, 2018-2030 (USD MILLION)
- TABLE 103. GERMANY BIOPOLYMERS FOR MEDICAL APPLICATIONS MARKET SIZE, BY APPLICATION, 2018-2030 (USD MILLION)
- TABLE 104. ISRAEL BIOPOLYMERS FOR MEDICAL APPLICATIONS MARKET SIZE, BY TYPE, 2018-2030 (USD MILLION)
- TABLE 105. ISRAEL BIOPOLYMERS FOR MEDICAL APPLICATIONS MARKET SIZE, BY SOURCE, 2018-2030 (USD MILLION)
- TABLE 106. ISRAEL BIOPOLYMERS FOR MEDICAL APPLICATIONS MARKET SIZE, BY APPLICATION, 2018-2030 (USD MILLION)
- TABLE 107. ITALY BIOPOLYMERS FOR MEDICAL APPLICATIONS MARKET SIZE, BY TYPE, 2018-2030 (USD MILLION)
- TABLE 108. ITALY BIOPOLYMERS FOR MEDICAL APPLICATIONS MARKET SIZE, BY SOURCE, 2018-2030 (USD MILLION)
- TABLE 109. ITALY BIOPOLYMERS FOR MEDICAL APPLICATIONS MARKET SIZE, BY APPLICATION, 2018-2030 (USD MILLION)
- TABLE 110. NETHERLANDS BIOPOLYMERS FOR MEDICAL APPLICATIONS MARKET SIZE, BY TYPE, 2018-2030 (USD MILLION)
- TABLE 111. NETHERLANDS BIOPOLYMERS FOR MEDICAL APPLICATIONS MARKET SIZE, BY SOURCE, 2018-2030 (USD MILLION)
- TABLE 112. NETHERLANDS BIOPOLYMERS FOR MEDICAL APPLICATIONS MARKET SIZE, BY APPLICATION, 2018-2030 (USD MILLION)
- TABLE 113. NIGERIA BIOPOLYMERS FOR MEDICAL APPLICATIONS MARKET SIZE, BY TYPE, 2018-2030 (USD MILLION)
- TABLE 114. NIGERIA BIOPOLYMERS FOR MEDICAL APPLICATIONS MARKET SIZE, BY SOURCE, 2018-2030 (USD MILLION)
- TABLE 115. NIGERIA BIOPOLYMERS FOR MEDICAL APPLICATIONS MARKET SIZE, BY APPLICATION, 2018-2030 (USD MILLION)
- TABLE 116. NORWAY BIOPOLYMERS FOR MEDICAL APPLICATIONS MARKET SIZE, BY TYPE, 2018-2030 (USD MILLION)
- TABLE 117. NORWAY BIOPOLYMERS FOR MEDICAL APPLICATIONS MARKET SIZE, BY SOURCE, 2018-2030 (USD MILLION)
- TABLE 118. NORWAY BIOPOLYMERS FOR MEDICAL APPLICATIONS MARKET SIZE, BY APPLICATION, 2018-2030 (USD MILLION)
- TABLE 119. POLAND BIOPOLYMERS FOR MEDICAL APPLICATIONS MARKET SIZE, BY TYPE, 2018-2030 (USD MILLION)
- TABLE 120. POLAND BIOPOLYMERS FOR MEDICAL APPLICATIONS MARKET SIZE, BY SOURCE, 2018-2030 (USD MILLION)
- TABLE 121. POLAND BIOPOLYMERS FOR MEDICAL APPLICATIONS MARKET SIZE, BY APPLICATION, 2018-2030 (USD MILLION)
- TABLE 122. QATAR BIOPOLYMERS FOR MEDICAL APPLICATIONS MARKET SIZE, BY TYPE, 2018-2030 (USD MILLION)
- TABLE 123. QATAR BIOPOLYMERS FOR MEDICAL APPLICATIONS MARKET SIZE, BY SOURCE, 2018-2030 (USD MILLION)
- TABLE 124. QATAR BIOPOLYMERS FOR MEDICAL APPLICATIONS MARKET SIZE, BY APPLICATION, 2018-2030 (USD MILLION)
- TABLE 125. RUSSIA BIOPOLYMERS FOR MEDICAL APPLICATIONS MARKET SIZE, BY TYPE, 2018-2030 (USD MILLION)
- TABLE 126. RUSSIA BIOPOLYMERS FOR MEDICAL APPLICATIONS MARKET SIZE, BY SOURCE, 2018-2030 (USD MILLION)
- TABLE 127. RUSSIA BIOPOLYMERS FOR MEDICAL APPLICATIONS MARKET SIZE, BY APPLICATION, 2018-2030 (USD MILLION)
- TABLE 128. SAUDI ARABIA BIOPOLYMERS FOR MEDICAL APPLICATIONS MARKET SIZE, BY TYPE, 2018-2030 (USD MILLION)
- TABLE 129. SAUDI ARABIA BIOPOLYMERS FOR MEDICAL APPLICATIONS MARKET SIZE, BY SOURCE, 2018-2030 (USD MILLION)
- TABLE 130. SAUDI ARABIA BIOPOLYMERS FOR MEDICAL APPLICATIONS MARKET SIZE, BY APPLICATION, 2018-2030 (USD MILLION)
- TABLE 131. SOUTH AFRICA BIOPOLYMERS FOR MEDICAL APPLICATIONS MARKET SIZE, BY TYPE, 2018-2030 (USD MILLION)
- TABLE 132. SOUTH AFRICA BIOPOLYMERS FOR MEDICAL APPLICATIONS MARKET SIZE, BY SOURCE, 2018-2030 (USD MILLION)
- TABLE 133. SOUTH AFRICA BIOPOLYMERS FOR MEDICAL APPLICATIONS MARKET SIZE, BY APPLICATION, 2018-2030 (USD MILLION)
- TABLE 134. SPAIN BIOPOLYMERS FOR MEDICAL APPLICATIONS MARKET SIZE, BY TYPE, 2018-2030 (USD MILLION)
- TABLE 135. SPAIN BIOPOLYMERS FOR MEDICAL APPLICATIONS MARKET SIZE, BY SOURCE, 2018-2030 (USD MILLION)
- TABLE 136. SPAIN BIOPOLYMERS FOR MEDICAL APPLICATIONS MARKET SIZE, BY APPLICATION, 2018-2030 (USD MILLION)
- TABLE 137. SWEDEN BIOPOLYMERS FOR MEDICAL APPLICATIONS MARKET SIZE, BY TYPE, 2018-2030 (USD MILLION)
- TABLE 138. SWEDEN BIOPOLYMERS FOR MEDICAL APPLICATIONS MARKET SIZE, BY SOURCE, 2018-2030 (USD MILLION)
- TABLE 139. SWEDEN BIOPOLYMERS FOR MEDICAL APPLICATIONS MARKET SIZE, BY APPLICATION, 2018-2030 (USD MILLION)
- TABLE 140. SWITZERLAND BIOPOLYMERS FOR MEDICAL APPLICATIONS MARKET SIZE, BY TYPE, 2018-2030 (USD MILLION)
- TABLE 141. SWITZERLAND BIOPOLYMERS FOR MEDICAL APPLICATIONS MARKET SIZE, BY SOURCE, 2018-2030 (USD MILLION)
- TABLE 142. SWITZERLAND BIOPOLYMERS FOR MEDICAL APPLICATIONS MARKET SIZE, BY APPLICATION, 2018-2030 (USD MILLION)
- TABLE 143. TURKEY BIOPOLYMERS FOR MEDICAL APPLICATIONS MARKET SIZE, BY TYPE, 2018-2030 (USD MILLION)
- TABLE 144. TURKEY BIOPOLYMERS FOR MEDICAL APPLICATIONS MARKET SIZE, BY SOURCE, 2018-2030 (USD MILLION)
- TABLE 145. TURKEY BIOPOLYMERS FOR MEDICAL APPLICATIONS MARKET SIZE, BY APPLICATION, 2018-2030 (USD MILLION)
- TABLE 146. UNITED ARAB EMIRATES BIOPOLYMERS FOR MEDICAL APPLICATIONS MARKET SIZE, BY TYPE, 2018-2030 (USD MILLION)
- TABLE 147. UNITED ARAB EMIRATES BIOPOLYMERS FOR MEDICAL APPLICATIONS MARKET SIZE, BY SOURCE, 2018-2030 (USD MILLION)
- TABLE 148. UNITED ARAB EMIRATES BIOPOLYMERS FOR MEDICAL APPLICATIONS MARKET SIZE, BY APPLICATION, 2018-2030 (USD MILLION)
- TABLE 149. UNITED KINGDOM BIOPOLYMERS FOR MEDICAL APPLICATIONS MARKET SIZE, BY TYPE, 2018-2030 (USD MILLION)
- TABLE 150. UNITED KINGDOM BIOPOLYMERS FOR MEDICAL APPLICATIONS MARKET SIZE, BY SOURCE, 2018-2030 (USD MILLION)
- TABLE 151. UNITED KINGDOM BIOPOLYMERS FOR MEDICAL APPLICATIONS MARKET SIZE, BY APPLICATION, 2018-2030 (USD MILLION)
- TABLE 152. BIOPOLYMERS FOR MEDICAL APPLICATIONS MARKET, FPNV POSITIONING MATRIX, 2022
- TABLE 153. BIOPOLYMERS FOR MEDICAL APPLICATIONS MARKET SHARE, BY KEY PLAYER, 2022
- TABLE 154. BIOPOLYMERS FOR MEDICAL APPLICATIONS MARKET LICENSE & PRICING
 按类型(聚乙烯(PE)、聚酰胺(PA)、聚乳酸(PLA)、聚对苯二甲酸乙二酯(PET)等)、应用(包装、纺织、汽车、工业、农业等)的生物基聚合物市场报告,以及地区 2024-2032
 电气和电子市场中的生物聚合物,按类型、按应用、国家和地区 - 2024-2032 年行业分析、市场规模、市场份额和预测
 生物基聚合物 - 市场占有率分析、产业趋势与统计、成长预测(2024 - 2029)
 生物聚合物全球市场规模、份额和趋势分析报告:2023-2030 年按最终用途、产品和地区分類的展望和预测
 可氧降解生物聚合物市场:按生物聚合物类型、製程和应用划分 - 2024-2030 年全球预测
 蓖麻油基生物聚合物市场:按聚合物类型、型态和最终用户划分 - 2024-2030 年全球预测
 生物聚合物市场规模、份额和趋势分析报告:2024-2030 年按产品、最终用途、应用、地区和细分市场进行的预测
 亚太地区蓖麻油基生物聚合物市场:2022-2031
 电气和电子市场中的生物聚合物 - 2018-2028 年全球行业规模、份额、趋势、机会和预测(按类型、按应用、按地区、竞争)
 生物聚合物薄膜市场:按原料、产品、技术和最终用户划分 - 全球预测 2023-2030