


 |
市场调查报告书
商品编码
1788493
银行业务的诈欺侦测·防止市场:2025-2030年Fraud Detection & Prevention in Banking Market: 2025-2030 |
||||||
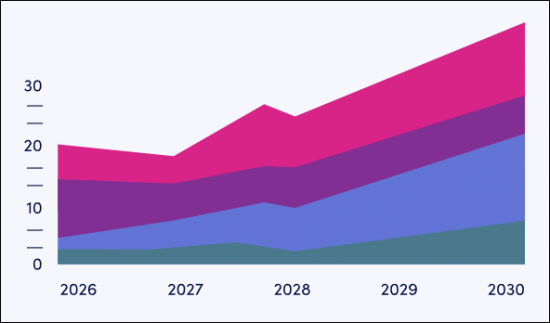
合成身分构成威胁,到 2030 年全球金融机构将因诈欺损失高达 583 亿美元
| 主要统计 | |
|---|---|
| 金融机构诈欺侦测与预防支出(2025 年): | 211亿美元 |
| 金融机构诈欺侦测与预防支出(2030 年): | 391亿美元 |
| 从2025年~2030年的市场成长率: | 85.5% |
| 预测期间: | 2025-2030年 |
概述
本研究套件提供全面深入分析各类诈欺及其打击方法。这使得包括银行、金融机构和金融科技公司在内的利害关係人能够了解未来的成长、关键趋势和竞争格局。本报告评估了银行业新兴的诈欺因素,重点介绍了关键市场趋势,并探讨了反诈欺解决方案采用的区域机会。
此套件包含多个选项,每个选项均可单独购买。这些选项包括:存取金融机构未来反诈骗解决方案支出的数据、揭示诈欺预防市场最新趋势和机会的深入研究,以及对15家领先反诈骗解决方案提供者的详细分析。此外,所有这些选项都可以作为完整的研究套件一起购买,并享受大幅折扣。
本报告是了解快速发展的诈欺情势的重要资源,使利害关係人能够制定有效的未来策略。其全面的见解和广泛的覆盖范围使该研究套件成为在快速增长的市场环境中支持规划和决策的极其有用的工具。
本报告提供全英文版本。
主要的特征
- 市场动态:本报告深入分析了主要趋势和市场扩张挑战,包括诈欺驱动因素和金融机构面临的主要挑战。本报告分析了反诈欺解决方案在交易风险监控中的作用、机器学习在诈欺防制中的应用,以及影响诈欺防制格局的法规。此外,报告还提供了国家准备指数,评估了八个主要地区诈欺预防市场的当前发展阶段和细分市场的成长情况,并提供了未来展望。
- 关键要点和策略建议:深入分析了诈欺预防解决方案市场中的关键成长机会和发现,并为利害关係人提供了策略建议。
- 基准产业预测:诈欺侦测与预防资料集包括诈欺交易总量预测、金融机构诈欺防制解决方案支出预测、各细分市场的交易量预测。
- Juniper Research 竞争排行榜:透过 Juniper Research 的竞争排行榜评估 15 家诈欺防制供应商的能力。
样品view
市场资料·预测报告
样品
市场趋势·策略报告
市场资料&预测报告
此研究套件包含完整的预测资料集,包含 54 个表格和 24,600 个资料点。
- 诈欺交易总量及金额
- 银行和金融机构在诈欺侦测和预防解决方案上的年度总支出(按细分):
- 银行和信用合作社
- 金融科技
- 投资公司
- 放债人
Juniper Research 的互动式预测 (Excel) 包含以下功能:
- 统计分析: 能够搜寻资料期间所有地区和国家/地区显示的特定指标。图表可以轻鬆修改并汇出到剪贴簿。
- 国家/地区资料工具: 此工具可让您查看预测期间所有地区和国家的指标。您可以使用搜寻栏缩小显示的指标范围。
- 国家比较工具: 让您选择特定的国家进行比较。此工具具有汇出图表的功能。
- 假设分析:五种互动式场景允许使用者比较预测假设。
竞争排行榜报告
|
|
目录
市场趋势·策略
第1章 市场摘要
- 重要点和策略性推荐事项
- 策略性建议
第2章 市场形势
- 市场形势和市场区隔
- 定义和范围
- 诈骗的种类
- 主要欺诈
- 申请诈欺与虚假帐户
- 钱钱骡
- 前置攻击
- 潜伏欺诈
- APP 欺诈
- 社会工程欺诈
- 洗钱
- 退款欺诈
- ATO(授权交易)
- 合成身分诈欺
- 基于人工智慧的欺诈
- 内部威胁
- 主要欺诈
- 发卡机构端诈欺侦测与预防解决方案
- 诈欺侦测与预防系统
- 生物辨识身份验证
- 权标化
- 行为分析
- 洗钱防制软体
- 诈欺侦测与预防系统
- 课题
- 通货膨胀和金融不稳定
- 技术进步
- 保护无银行帐户人群的紧迫性
- 快速演变的诈欺格局
- 网路安全人才短缺
第3章 部门分析:付款各类型
- 付款类型
- 开放银行
- 延期付款服务
- CBDC
- 加密货币
- 即时支付
- 汇款
- QR编码
- 解决方案和机会
- AI
- 机器学习
- API
- 耐量子密码
- 规则
第5章 市场区隔分析:各产业
- 市场区隔分析
- 银行和信用合作社
- 金融科技公司
- 放债人
- 投资公司
- 加值服务
- 发票融资
- 应付帐款和应收帐款自动化
- 贸易融资
- 现金流量预测与分析
- 对帐服务
竞争排行榜
第1章 竞争排行榜
- 为何阅读本报告?
- 发行人诈欺防制供应商资料
- Accertify
- ACI Worldwide
- ComplyAdvantage
- Discover Financial Services
- Entrust
- Feedzai
- Fiserv
- Hawk
- LexisNexis Risk Solutions
- Mastercard
- SEON
- Thales
- Tookitaki
- TransUnion
- Visa
资料·预测
第1章 市场概要
- 定义和范围
第2章 预测摘要
- 按发行商划分的诈欺预防预测摘要
- 实施诈欺侦测和预防解决方案的银行和其他金融机构数量
- 银行和金融机构在诈欺侦测和预防解决方案上的年度总支出
- 数位银行和汇款中的诈欺交易总数
- 银行和汇款中的诈欺交易总价值
第三章:银行和其他金融机构
- 使用诈欺侦测和预防解决方案的银行和信用合作社数量
- 诈欺侦测与预防总支出解决方案
第四章 金融科技
- 实施诈欺侦测和预防解决方案的金融科技公司数量
- 诈欺侦测与预防解决方案的总支出
第五章:投资公司
- 实施诈欺侦测和预防解决方案的投资公司数量
- 诈欺侦测与预防解决方案的总支出
第六章:放债人
- 使用诈欺侦测和预防解决方案的放债人数量
- 诈欺侦测与预防解决方案的总支出
第七章:银行与汇款中的诈欺交易
- 数位银行的诈欺交易总数
- 诈欺交易总价值数位银行
- 汇款诈欺交易总数
- 汇款诈欺交易总金额
'Fraud to Cost Financial Institutions $58.3 Billion by 2030 Globally, as Synthetic Identities Threaten Fraud Tidal Wave'
| KEY STATISTICS | |
|---|---|
| Spend on fraud detection and prevention by financial institutions in 2025: | $21.1 billion |
| Spend on fraud detection and prevention by financial institutions by 2030: | $39.1 billion |
| 2025 to 2030 market growth: | 85.5% |
| Forecast period: | 2025-2030 |
Overview
Our 'Fraud Detection and Prevention in Banking' research suite provides a comprehensive and in-depth analysis of the types of fraud, and methods that can be used to overcome them. This enables stakeholders such as banks, financial institutions, and fintechs to understand future growth, key trends and the competitive environment. The report evaluates emerging elements of banking fraud, highlights key market trends, and examines regional opportunities in fraud solution adoption.
The suite includes several different options that can be purchased separately, including access to data mapping the future spend on fraud solutions by financial institutions, an insightful study uncovering the latest trends and opportunities within the fraud prevention market, and a document containing extensive analysis of the 15 market leaders facilitating fraud prevention solutions. The coverage can also be purchased as a Full Research Suite, containing all these elements, at a substantial discount.
This report serves as an essential resource for understanding the rapidly evolving fraud landscape; empowering stakeholders to shape effective future strategies. With its comprehensive insights and extensive coverage, this research suite is an invaluable tool for navigating and planning in a fast-growing landscape.
All report content is delivered in the English language.
Key Features
- Market Dynamics: Insights into key trends and market expansion challenges within the fraud prevention solutions market, including drivers of fraud and major challenges faced by financial institutions regarding fraud. The report addresses the role of fraud prevention solutions in monitoring transactions for risk, the use of machine learning in fraud prevention, and the regulations affecting the fraud prevention landscape. The research also features a Country Readiness Index on the current development and segment growth of the fraud prevention market across eight key regions, as well as providing a future outlook.
- Key Takeaways & Strategic Recommendations: In-depth analysis of key development opportunities and findings within the solutions for fraud prevention market, accompanied by strategic recommendations for stakeholders.
- Benchmark Industry Forecasts: The fraud detection and prevention dataset includes forecasts for the total value of fraudulent transactions, including the spend on fraud prevention solutions by financial institutions, and the transaction volume of various market segments.
- Juniper Research Competitor Leaderboard: Key market player capability and capacity assessment for 15 fraud prevention vendors, via the Juniper Research Competitor Leaderboard; featuring market size for major players in the fraud prevention market.
SAMPLE VIEW
Market Data & Forecasting Report
The numbers tell you what's happening, but our written report details why, alongside the methodologies.
SAMPLE VIEW
Market Trends & Strategies Report
A comprehensive analysis of the current market landscape, alongside strategic recommendations.
Market Data & Forecasting Report
The market-leading research suite for the 'Fraud Detection and Prevention in Banking' market includes access to the full set of forecast data of 54 tables and 24,600 datapoints.
Metrics in the research suite include:
- Total Transaction Volume and Value of Fraudulent Transactions
- Total Annual Spend on Fraud Detection and Prevention Solutions by Banks and Financial Institutions, Split by the Following Market Segments:
- Banks and Credit Unions
- Fintechs
- Investment Companies
- Lending Companies
Juniper Research's Interactive Forecast Excel contains the following functionality:
- Statistics Analysis: Users benefit from the ability to search for specific metrics, displayed for all regions and countries across the data period. Graphs are easily modified and can be exported to the clipboard.
- Country Data Tool: This tool lets users look at metrics for all regions and countries in the forecast period. Users can refine the metrics displayed via a search bar.
- Country Comparison Tool: Users can select and compare specific countries. The ability to export graphs is included in this tool.
- What-if Analysis: Here, users can compare forecast metrics against their own assumptions, via five interactive scenarios.
Market Trends & Strategies Report
This report examines the 'Fraud Detection and Prevention in Banking' market landscape in depth; assessing trends and factors shaping the evolution of this rapidly growing market. The report delivers comprehensive analysis of the strategic opportunities for vendors providing fraud prevention solutions; addressing key verticals such as banks, credit unions, fintechs, investment companies, and lenders. This report also includes evaluation of key country-level opportunities for stakeholders in the fraud prevention market.
Competitor Leaderboard Report
The Competitor Leaderboard report provides a detailed evaluation and market positioning for 15 leading vendors in the fraud prevention space. The vendors are positioned as established leaders, leading challengers, or disruptors and challengers, based on capacity and capability assessments:
|
|
This document is centred around the Juniper Research Competitor Leaderboard; a vendor positioning tool that provides an at-a-glance view of the competitive landscape in a market, backed by a robust methodology.
Table of Contents
Market Trends & Strategies
1. Market Summary
- 1.1. Key Takeaways & Strategic Recommendations
- 1.2. Strategic Recommendations
2. Market Landscape
- 2.1. Market Landscape & Segmentation
- 2.1.1. Introduction
- 2.1.2. Definitions and Scope
- 2.2. Types of Fraud
- Figure 2.1: Types of Fraud
- 2.2.1. First-party Fraud
- i. Application Fraud and Fake Accounts
- ii. Money Mules
- iii. Fronting
- iv. Sleeper Fraud
- v. APP Fraud
- vi. Social Engineering Fraud
- 2.2.2. Money Laundering
- 2.2.3. Chargeback Fraud
- 2.2.4. ATO
- 2.2.5. Synthetic Identity
- i. Detection of Synthetic Identity Fraud
- 2.2.6. AI-driven Fraud
- 2.2.7. Insider Threat
- 2.3. Solutions Used in Issuer Fraud Detection & Prevention
- 2.3.1. Fraud Detection & Prevention Systems
- i. Biometric Identification
- ii. Tokenisation
- iii. Behavioural Analytics
- iv. AML Software
- 2.3.1. Fraud Detection & Prevention Systems
- 2.4. Challenges
- 2.4.1. Introduction
- Figure 2.2: Major Challenges Faced by Financial Institutions in the Fraud Landscape
- 2.4.2. Inflation and Financial Uncertainty
- 2.4.3. Technological Advancement
- 2.4.4. Urgent Need to Protect the 'Underbanked'
- 2.4.5. Rapidly Evolving Fraud Landscape
- 2.4.6. Cyber Security Talent Shortage
- 2.4.1. Introduction
3. Sector Analysis: Payment Types
- 3.1. Payment Types
- 3.1.1. Open Banking
- i. Avenues of Fraud Through Open Banking
- ii. How Open Banking Can Help Prevent Banking Fraud
- 3.1.2. Buy Now, Pay Later
- 3.1.3. CBDCs
- 3.1.4. Cryptocurrency
- 3.1.5. Instant Payments
- 3.1.6. Money Transfer
- 3.1.7. QR Codes
- i. Avenues of Fraud Via QR Code Payments
- ii. How QR Code Payments Can Reduce Fraud
- 3.1.1. Open Banking
- 4.1. Solutions & Opportunities
- 4.1.1. AI
- i. Advantages of AI in Fraud Detection and Prevention
- ii. Disadvantages of AI in Fraud Detection and Prevention
- 4.1.2. Machine Learning
- i. Advantages of Machine Learning in Fraud Detection and Prevention
- ii. Disadvantages of ML in Fraud Detection and Prevention
- 4.1.3. APIs
- i. Advantages of APIs in Fraud Detection and Prevention
- ii. Disadvantages of APIs in Fraud Detection and Prevention
- 4.1.4. Quantum-safe Cryptography
- i. Advantages of Quantum-safe Cryptography in Fraud Detection and Prevention
- ii. Disadvantages of Quantum-safe Cryptography in Fraud Detection and Prevention
- 4.1.1. AI
- 4.2. Regulations
- 4.2.1. UK Faster Payments Regulation
- 4.2.2. PSD2
- 4.2.3. Brazil's PIX Instant Payment Regulation
- 4.2.4. India's UPI and Real-time Payment Regulation
5. Segment Analysis: Business Verticals
- 5.1. Segment Analysis
- 5.1.1. Introduction
- 5.1.2. Banks and Credit Unions
- 5.1.3. Fintechs
- 5.1.4. Lenders
- 5.1.5. Investment Companies
- 5.1.6. Value-added Services
- 5.1.7. Invoice Financing
- 5.1.8. Accounts Payable (AP) and Accounts Receivable (AR) Automation
- 5.1.9. Trade Financing
- 5.1.10. Cashflow Forecasting and Analytics
- 5.1.11. Reconciliation Services
Competitor Leaderboard
1. Competitor Leaderboard
- 1.1. Why Read This Report
- Figure 1.1: Juniper Research Competitor Leaderboard: Fraud Detection & Prevention in Banking Vendor Product Portfolio
- Figure 1.2: Juniper Research Leaderboard: Fraud Detection & Prevention in Banking Vendors
- Table 1.3: Juniper Research Leaderboard: Fraud Detection & Prevention in Banking Vendor Positioning
- Figure 1.4: Juniper Research Leaderboard Heatmap: Fraud Detection & Prevention in Banking Vendors
- 1.2. Issuer Fraud Prevention Vendor Profiles
- 1.2.1. Accertify
- i. Corporate Information
- ii. Geographical Spread
- iii. Key Clients & Strategic Partnerships
- iv. High-level View of Offerings
- v. Juniper Research's View: Key Strengths & Strategic Development Opportunities
- 1.2.2. ACI Worldwide
- i. Corporate Information
- ii. Geographical Spread
- iii. Key Clients & Strategic Partnerships
- iv. High-level View of Offerings
- v. Juniper Research's View: Key Strengths & Strategic Development Opportunities
- 1.2.3. ComplyAdvantage
- i. Corporate Information
- ii. Geographical Spread
- iii. Key Clients & Strategic Partnerships
- iv. High-level View of Offerings
- v. Juniper Research's View: Key Strengths & Strategic Development Opportunities
- 1.2.4. Discover Financial Services
- i. Corporate Information
- ii. Geographical Spread
- iii. Key Clients & Strategic Partnerships
- iv. High-level View of Offerings
- v. Juniper Research's View: Key Strengths & Strategic Development Opportunities
- 1.2.5. Entrust
- i. Corporate Information
- ii. Geographical Spread
- iii. Key Clients & Strategic Partnerships
- iv. High-level View of Offerings
- v. Juniper Research's View: Key Strengths & Strategic Development Opportunities
- 1.2.6. Feedzai
- i. Corporate Information
- ii. Geographical Spread
- iii. Key Clients & Strategic Partnerships
- iv. High-level View of Offerings
- v. Juniper Research's View: Key Strengths & Strategic Development Opportunities
- 1.2.7. Fiserv
- i. Corporate Information
- ii. Geographical Spread
- iii. Key Clients & Strategic Partnerships
- iv. High-level View of Offerings
- v. Juniper Research's View: Key Strengths & Strategic Development Opportunities
- 1.2.8. Hawk
- i. Corporate Information
- ii. Geographical Spread
- iii. Key Clients & Strategic Partnerships
- iv. High-level View of Offerings
- v. Juniper Research's View: Key Strengths & Strategic Development Opportunities
- 1.2.9. LexisNexis Risk Solutions
- i. Corporate Information
- ii. Geographical Spread
- iii. Key Clients & Strategic Partnerships
- iv. High-level View of Offerings
- v. Juniper Research's View: Key Strengths & Strategic Development Opportunities
- 1.2.10. Mastercard
- i. Corporate Information
- ii. Geographical Spread
- iii. Key Clients & Strategic Partnerships
- iv. High-level View of Offerings
- v. Juniper Research's View: Key Strengths & Strategic Development Opportunities
- 1.2.11. SEON
- i. Corporate Information
- ii. Geographical Spread
- iii. Key Clients & Strategic Partnerships
- iv. High-level View of Offerings
- v. Juniper Research's View: Key Strengths & Strategic Development Opportunities
- 1.2.12. Thales
- i. Corporate Information
- ii. Geographical Spread
- iii. Key Clients & Strategic Partnerships
- iv. High-level View of Offerings
- v. Juniper Research's View: Key Strengths & Strategic Development Opportunities
- 1.2.13. Tookitaki
- i. Corporate Information
- ii. Geographical Spread
- iii. Key Clients & Strategic Partnerships
- iv. High-level View of Offerings
- v. Juniper Research's View: Key Strengths & Strategic Development Opportunities
- 1.2.14. TransUnion
- i. Corporate Information
- ii. Geographical Spread
- iii. Key Clients & Strategic Partnerships
- iv. High-level View of Offerings
- v. Juniper Research's View: Key Strengths & Strategic Development Opportunities
- 1.2.15. Visa
- i. Corporate Information
- ii. Geographical Spread
- iii. Key Clients & Strategic Partnerships
- iv. High-level View of Offerings
- v. Juniper Research's View: Key Strengths & Strategic Development Opportunities
- 1.2.1. Accertify
Data & Forecasting
1. Market Overview
- 1.1. Introduction
- 1.2. Definitions and Scope
- 1.2.1. Forecast Introduction
- 1.2.2. Methodology & Assumptions
- i. Methodology
- ii. Assumptions
- Figure 1.1: Fraud Detection & Prevention in Banking Market 2025-2030: Forecast Methodology
2. Forecast Summary
- 2.1. Issuer Fraud Prevention Forecast Summary
- 2.1.1. Number of Banks and Other Financial Institutions Using Fraud Detection & Prevention Solutions
- Figure & Table 2.1: Number of Banks & FIs Using FDP Solutions, Split by 8 Key Regions, 2025-2030
- 2.1.2. Total Annual Spend on Fraud Detection & Prevention Solutions by Banks & FIs
- Figure & Table 2.2: Total Annual Spend on FDP Solutions by Banks & FIs ($m), Split by 8 Key Regions, 2025-2030
- 2.1.3. Total Number of Fraudulent Transactions across Digital Banking and Money Transfers
- Figure & Table 2.3: Total Number of Fraudulent Transactions across Digital Banking and Money Transfer (m), Split by 8 Key Regions, 2025-2030
- 2.1.4. Total Value of Fraudulent Transactions across Banking and Money Transfers
- Figure & Table 2.4: Total Value of Fraudulent Banking & Money Transfer Transactions ($m), Split by 8 Key Regions, 2025-2030
- 2.1.1. Number of Banks and Other Financial Institutions Using Fraud Detection & Prevention Solutions
3. Banks and Other Financial Institutions
- 3.1.1. Number of Banks and Credit Unions Using Fraud Detection & Prevention Solutions
- Figure & Table 3.1: Banks & Credit Unions Using FDP Solutions, Split by 8 Key Regions, 2025-2030
- 3.1.2. Total Spend by Banks & Credit Unions on Fraud Detection & Prevention Solutions
- Figure & Table 3.2: Total Spend by Banks & Credit Unions on FDP Solutions ($m), Split by 8 Key Regions, 2025-2030
4. Fintechs
- 4.1.1. Number of Fintechs Using Fraud Detection & Prevention Solutions
- Figure & Table 4.1: Number of Fintechs Using FDP Solutions, Split by 8 Key Regions, 2025-2030
- 4.1.2. Total Spend by Fintechs on Fraud Detection & Prevention Solutions
- Figure & Table 4.2: Total Spend by Fintechs on FDP Solutions ($m), Split by 8 Key Regions, 2025-2030
5. Investment Companies
- 5.1.1. Number of Investment Companies Using Fraud Detection & Prevention Solutions
- Figure & Table 5.1: Number of Investment Companies Using FDP Solutions, Split by 8 Key Regions, 2025-2030
- 5.1.2. Total Spend by Investment Companies on Fraud Detection & Prevention Solutions
- Figure & Table 5.2: Total FDP Spend by Investment Companies ($m), Split by 8 Key Regions, 2025-2030
6. Lenders
- 6.1.1. Number of Lenders Using Fraud Detection & Prevention Solutions
- Figure & Table 6.1: Number of Lenders Using FDP Solutions, Split by 8 Key Regions, 2025-2030
- 6.1.2. Total Spend by Lenders on Fraud Detection & Prevention Solutions
- Figure & Table 6.2: Total Spend by Lenders on FDP Solutions ($m), Split by 8 Key Regions, 2025-2030
7. Fraudulent Transactions in Banking and Money Transfers
- 7.1.1. Total Number of Fraudulent Transactions in Digital Banking
- Figure & Table 7.1: Total Number of Fraudulent Transactions in Digital Banking (m), Split by 8 Key Regions, 2025-2030
- 7.1.2. Total Value of Fraudulent Transactions in Digital Banking
- Figure & Table 7.2: Total Value of Fraudulent Transactions in Digital Banking ($m), Split by 8 Key Regions, 2025-2030
- 7.1.3. Total Number of Fraudulent Transactions in Money Transfer
- Figure & Table 7.3: Total Number of Fraudulent Transactions in Money Transfer (m), Split by 8 Key Regions, 2025-2030
- 7.1.4. Total Fraudulent Transactions Value in Money Transfer
- Figure & Table 7.4: Total Fraudulent Transactions Value ($m), Split by 8 Key Regions, 2025-2030
 诈欺侦测与预防市场:2026-2032年全球市场预测(依组件、部署模式、技术、组织规模及最终用途划分)
 2026年全球诈骗侦测与预防市场报告2026年全球智慧人工智慧(AI)诈骗侦测与预防市场报告
 客户转型过程中的诈欺侦测与预防:人为安全
 诈欺侦测与预防市场分析及预测(至 2035 年):按类型、产品类型、服务、技术、组件、应用、部署类型、最终用户和解决方案划分诈欺侦测与预防市场规模、份额、成长率及全球产业分析:按类型、应用和地区分類的洞察,2026-2034 年预测
 诈骗侦测与预防市场 - 全球产业规模、份额、趋势、机会及预测(按组件、解决方案、应用、产业垂直领域、地区和竞争格局划分,2021-2031年)
 诈欺侦测与预防(FDP):市占率分析、产业趋势与统计、成长预测(2026-2031)
 日本诈欺侦测与预防市场报告(按组件、应用、组织规模、垂直行业和地区划分,2026-2034 年)
 全球诈骗侦测与预防市场:预测至 2032 年-按组件、部署方式、组织规模、诈欺类型、最终用户和地区进行分析