


 |
市场调查报告书
商品编码
1816818
A2A付款市场:2025-2030年A2A Payments Market: 2025-2030 |
||||||
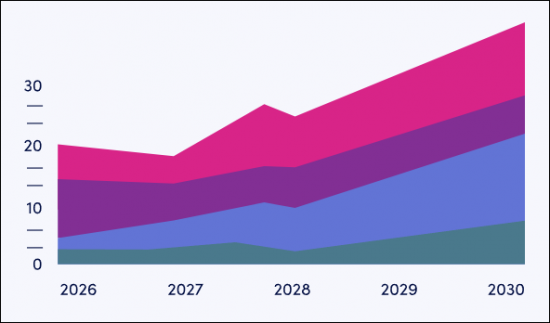
受加值服务发展驱动,到 2030 年,全球 A2A 交易金额将达到 195 兆美元
| 关键统计 | |
|---|---|
| 2025 年全球 A2A 交易额: | 540 亿 |
| 2029 年全球 A2A 交易额: | 10 亿 |
| 2025 年至 2030 年 A2A 交易成长率: | 83% |
| 预测期间: | 2025-2030 |
本研究套件对快速变化的 A2A 支付市场进行了深入分析,帮助 A2A 支付服务提供者了解关键的支付趋势和挑战、潜在的成长机会以及竞争格局。
本套件包含 A2A 支付市场未来成长的数据。我们深入的研究揭示了市场中的最新机会和趋势,并透过对 19 家 A2A 支付服务提供者的广泛分析提供了深刻的见解。报告也探讨了与现有支付基础设施相容性、降低企业成本以及提升客户体验相关的挑战。
这些因素使本套件成为了解快速成长的 A2A 支付市场的宝贵工具,使 A2A 支付供应商能够制定未来策略,并为其客户和合作伙伴提供有效且高效的支付服务。凭藉无与伦比的覆盖范围,本套件是衡量这个复杂市场未来发展的宝贵资源。
主要特点
- 市场动态: 深入了解 A2A 支付领域的主要支付趋势和市场扩张挑战。针对各市场缺乏专用解决方案、公众对支付解决方案认知度低以及潜在诈欺风险等挑战,本报告分析了 A2A 支付的多种用例,并展望了 A2A 支付的未来发展。
- 关键要点和策略建议:本报告深入分析了关键的市场成长机会和研究成果,并为 A2A 支付解决方案提供者提供了关于如何应对新兴趋势和市场未来发展的策略建议。
- 产业基准预测:预测数据包括对 A2A 支付的分析,这些支付细分为店内支付、线上支付、P2P 支付、跨境支付、B2B 支付和 B2C 支付。报告也提供了每个细分领域的交易量和平均交易额等指标。
- Juniper Research 竞争力排行榜:本报告评估了 19 家 A2A 支付供应商的能力和回应能力。
范例视图
市场数据与预测报告
范例
市场趋势与策略报告
市场数据与预测报告
此研究套件包含完整的预测资料集,其中包含 70 个表格和超过 27,000 个资料点。
摘要包含以下指标:
- A2A 支付交易数量
- A2A 支付交易额
- A2A 支付用户数量
以下细分市场也提供这些指标:
- 店内支付
- 线上支付(电子商务)
- P2P 支付
- 跨国消费者支付
- B2B 支付(跨国与境内)
- B2C 支付(跨国和境内)
Juniper Research 的互动式预测 (Excel) 提供以下功能:
- 统计分析:搜寻资料期间所有地区和国家显示的特定指标。图表可以轻鬆修改并汇出到剪贴簿。
- 国家/地区资料工具:此工具可让您查看预测期间内所有地区和国家的指标。使用者可以使用搜寻栏缩小显示的指标范围。
- 国家比较工具:允许使用者选择和比较各国。此工具包含汇出图表的功能。
- 假设分析:透过五个互动式场景,使用者可以比较预测假设。
竞争排行榜报告
竞争排行榜报告对 19 家领先供应商进行了详细的评估和市场定位。根据供应商的产能和能力评估、他们提供的 A2A 支付产品范围以及使其区别于竞争对手的其他技术,这些供应商被定位为既定领导者、领先挑战者或颠覆者-挑战者。
列出的公司:
|
|
|
目录
市场趋势与策略
第一章:要点与策略建议
- 要点
- 策略建议
第二章:市场格局
- 简介
- A2A 付款类型
- 支援技术
- 即时支付通道
- 开放银行
- 二维码支付
- NFC
- 当前市场
- A2A 支付系统
- A2A 支付趋势
- 关键驱动因素
- 新兴趋势
- A2A 支付的优势与挑战
- 优势
- 挑战
第三章:细分市场分析
- 零售、电商及其他服务
- P2P
- 跨国
- B2B/B2C
第四章:国家准备指数
- 国家准备指数:简介
- 重点市场
- 成长市场
- 新兴市场
- Juniper Research 全国准备指数热图
竞赛排行榜
第一章:Juniper Research 竞争排行榜
第二章:公司简介
- 供应商简介
- Aeropay
- Banked
- Brankas
- Brite Payments
- Dwolla
- Fiserv
- GoCardless
- Ivy
- Mastercard
- Plaid
- Prometeo
- Salt Edge
- Token.io
- TrueLayer
- Trustly
- Visa
- Volt
- Worldline
- Yapily
- 评估方法
- 相关研究
资料与预测
第一章:简介与研究方法
第二章:消费者 A2A:总结
- A2A 支付用户总数
- 消费者 A2A 交易总数
- 消费者 A2A 交易总价值
第三章:店内支付
- 店内 A2A 支付用户总数
- 店内 A2A 交易总数
- 店内 A2A 交易总价值
第四章:电子商务支付
- 线上 A2A 付款用户总数
- 线上 A2A 支付总数交易
- 线上 A2A 支付总交易额
第五章:P2P 支付
- P2P A2A 支付用户总数
- P2P A2A 支付交易总数
- P2P A2A 支付总交易额
第六章:跨境支付
- 跨国 A2A 支付用户总数
- 跨国消费者 A2A 支付交易总数
- 跨国消费者 A2A 支付交易总额
第七章:B2B 支付
- 境内 A2A B2B 交易总数
- 境内 A2A B2B 交易总额
- 跨国 A2A B2B 交易总数
- 跨国 A2A B2B 交易总额
第八章:B2C 支付
- 境内 A2A B2C 交易总数
- 境内 A2A B2C 交易总额
- 跨国 A2A B2C 交易总数价值
- 跨国 A2A B2C 交易总额
'A2A Transaction Value to Reach $195 Trillion in 2030 Globally, Driven by Advanced Value-added Services'
| KEY STATISTICS | |
|---|---|
| A2A transactions globally in 2025: | 54bn |
| A2A transactions globally by 2029: | 1tn |
| Growth in A2A transactions from 2025 to 2030: | 83% |
| Forecast period: | 2025-2030 |
Overview
Our "Account-to-Account (A2A) Payments" research suite provides detailed analysis of this rapidly changing market; enabling A2A payments service providers to gain an understanding of key payment trends and challenges, potential growth opportunities, and the competitive environment.
Providing multiple options which can be purchased separately, the research suite includes access to data mapping the future growth of the A2A payments market. The detailed study reveals the latest opportunities and trends within the market and offers an insightful document containing an extensive analysis of 19 A2A payments service providers within the space. Aspects such as challenges regarding compatibility with existing payments infrastructure, lower fees for businesses, and enhanced customer experience are explored throughout the report. The coverage can also be purchased as a Full Research Suite, containing all of these elements, and includes a substantial discount.
Collectively, these elements provide an effective tool for understanding this rapidly emerging market; allowing A2A payments vendors to set out their future strategies to provide effective and efficient payment services to their customers and clients. Its unparalleled coverage makes this research suite an incredibly useful resource for gauging the future of this complex market.
All report content is delivered in the English language.
Key Features
- Market Dynamics: Insights into key payment trends and market expansion challenges within the A2A payments space. It addresses the challenges posed by a lack of dedicated solutions in different markets, limited public knowledge of the payment solution, and potential fraud risks; analysing multiple use cases where A2A payments are employed. The research also provides a future outlook on the landscape of A2A payments.
- Key Takeaways & Strategic Recommendations: In-depth analysis of key development opportunities and findings within the market, accompanied by key strategic recommendations for A2A payments solution providers on emerging trends and how the market is expected to evolve.
- Benchmark Industry Forecasts: The forecasts include data on A2A payments, split by in-store, online, peer-to-peer (P2P), cross-border, business-to-business (B2B), and business-to-consumer (B2C). These include metrics such as the number of transactions and average transaction value for each segment.
- Juniper Research Competitor Leaderboard: Key player capability and capacity assessment for 19 A2A payments vendors, via the Juniper Research Competitor Leaderboard; featuring analysis around major players in the A2A payments industry.
SAMPLE VIEW
Market Data & Forecasting Report
The numbers tell you what's happening, but our written report details why, alongside the methodologies.
SAMPLE VIEW
Market Trends & Strategies Report
A comprehensive analysis of the current market landscape, alongside strategic recommendations.
Market Data & Forecasting Report
The market-leading research suite for the "A2A Payments" market includes access to the full set of forecast data, consisting of 70 tables and over 27,000 datapoints.
Metrics in the research suite summary include:
- Number of A2A Payments Transactions
- Value of A2A Payments Transactions
- Number of A2A Payment Users
These metrics are also available for the following segments:
- In-store payments
- Online payments (eCommerce)
- P2P payments
- Cross-border consumer payments
- B2B payments (split by cross-border versus domestic)
- B2C payments (split by cross-border versus domestic)
The Juniper Research Interactive Forecast Excel contains the following functionality:
- Statistics Analysis: Users benefit from the ability to search for specific metrics, displayed for all regions and countries across the data period. Graphs are easily modified and can be exported to the clipboard.
- Country Data Tool: This tool allows the user to review metrics for all regions and countries in the forecast period. Users can refine the metrics displayed via the search bar.
- Country Comparison Tool: Users can select and compare each of the countries. The ability to export graphs is included in this tool.
- What-if Analysis: Here, users can compare forecast metrics against their own assumptions, via five interactive scenarios.
Market Trends & Strategies Report
This report examines the "A2A Payments" market landscape in detail. It assesses different market trends and factors that are shaping the evolution of this rapidly emerging market, such as how A2A payments are promoting financial inclusion, Open Banking and the role it is playing in driving growth of this payment method, and regulations and initiatives that are shaping adoption; advising how vendors should navigate these emerging trends.
In addition to looking at A2A payment use cases, it also includes evaluation of the different markets in which A2A payments are seeing use, and how vendors can better adapt to serve these markets.
Competitor Leaderboard Report
The Competitor Leaderboard report provides a detailed evaluation and market positioning for 19 leading vendors in the "A2A Payments" space. These vendors are positioned as an established leader, leading challenger, or disruptor and challenger, based on capacity and capability assessments, their range of A2A payment products on offer, and any additional technologies that set them apart from their competitors.
Juniper Research's Competitor Leaderboard for the "A2A Payments" market includes the following key players:
|
|
|
This document is centred around the Juniper Research Competitor Leaderboard; a vendor positioning tool that provides an at-a-glance view of the competitive landscape, backed by a robust methodology.
Table of Contents
Market Trends & Strategies
1. Key Takeaways & Strategic Recommendations
- 1.1. Key Takeaways
- 1.2. Strategic Recommendations
2. Market Landscape
- 2.1. Introduction
- 2.1.1. Types of A2A Payments
- 2.1.2. Surrounding Technologies
- i. Instant Payment Rails
- ii. Open Banking
- iii. QR Code Payments
- iv. NFC
- 2.2. Current Market
- 2.2.1. A2A Payment Systems
- Figure 2.1: Examples of National A2A Payment Schemes
- i. National Payment Schemes
- ii. Fintech Solutions
- 2.2.1. A2A Payment Systems
- 2.3. A2A Payment Trends
- 2.3.1. Key Drivers
- i. Technological Developments
- ii. Government Regulations & Initiatives
- 2.3.2. Newly-emerging Trends
- i. VRPs
- ii. QR Code Payments
- iii. Payment Interoperability
- iv. AML, Fraud, & Compliance
- 2.3.1. Key Drivers
- 2.4. Benefits & Challenges to A2A Payments
- 2.4.1. Benefits
- Figure 2.2: A2A Payments' Benefits Summary
- i. Lower Costs
- ii. Enhanced Customer Experience
- iii. Safer Instant Payments
- 2.4.2. Challenges
- Figure 2.3: A2A Payments' Challenges Summary
- i. Lack of Dedicated Solutions Across Multiple Markets
- ii. Fraud Risks
- iii. Compatibility With Pre-existing Payments Infrastructure
- iv. Banks Not Yet Convinced to Invest
- v. Limited Knowledge Restricts Progress
- 2.4.1. Benefits
3. Segment Analysis
- 3.1. Introduction
- 3.2. Retail, eCommerce, & Other Services
- Figure 3.1: Total Value of In-store & Online A2A Payments ($m), Globally, 2025-2030
- 3.3. P2P
- Figure 3.2: Total Transaction Volume of A2A-based P2P Payments (m), Split by 8 Key Regions, 2025-2030
- 3.4. Cross-border
- Figure 3.3: Global Volume of Cross-border A2A Transactions (m), Split by 8 Key Regions, 2025
- 3.5. B2B & B2C
- Figure 3.4: Total Volume of A2A-based B2B Payments (m), Globally, Split by 8 Key Regions, 2025
4. Country Readiness Index
- 4.1. Introduction to Country Readiness Index
- Figure 4.1: Juniper Research Country Readiness Index Regional Definitions
- Table 4.2: Juniper Research Country Readiness Index Scoring Criteria: A2A Payments
- Figure 4.3: Juniper Research Country Readiness Index: A2A Payments
- Figure 4.4: A2A Payments Country Readiness Index: Market Segments
- 4.1.1. Focus Markets
- i. National Payments Schemes
- Figure 4.5: Number of A2A Cross-border Transactions (m), Split by 8 Focus Markets, 2025-2030
- ii. Open Banking Adoption
- iii. A2A Payment Vendors Are Innovating Amidst High Competition
- i. National Payments Schemes
- 4.1.2. Growth Markets
- i. Instant Payment Rail (IPR) Implementation
- Figure 4.6: Number of A2A B2B Transactions (m), Split by Four Growth Markets, 2025-2030
- ii. Emerging A2A Payment Frameworks & Initiatives Pushing Growth
- i. Instant Payment Rail (IPR) Implementation
- 4.1.3. Developing Markets
- 4.2. Juniper Research A2A Payments Country Readiness Index Heatmaps
- i. North America
- Table 4.7: Juniper Research A2A Payments Country Readiness Index Heatmap: North America
- ii. Latin America
- Table 4.8: Juniper Research A2A Payments Country Readiness Index Heatmap: Latin America
- iii. West Europe
- Table 4.9: Juniper Research A2A Payments Country Readiness Index Heatmap: West Europe
- iv. Central & East Europe
- Table 4.10: Juniper Research A2A Payments Country Readiness Index Heatmap: Central & East Europe
- v. Far East & China
- Table 4.11: Juniper Research A2A Payments Country Readiness Index Heatmap: Far East & China
- vi. Indian Subcontinent
- Table 4.12: Juniper Research A2A Payments Country Readiness Index Heatmap: Indian Subcontinent
- vii. Rest of Asia Pacific
- Table 4.13: Juniper Research A2A Payments Country Readiness Index Heatmap: Rest of Asia Pacific
- viii. Africa & Middle East
- Table 4.14: Juniper Research A2A Payments Country Readiness Index Heatmap: Africa & Middle East
- i. North America
Competitor Leaderboard
1. Juniper Research Competitor Leaderboard
- 1.1. Why Read This Report?
- Table 1.1: Juniper Research Competitor Leaderboard: A2A Payment Vendors Included & Product Portfolios
- Figure 1.2: Juniper Research Competitor Leaderboard for A2A Payments Vendors
- Table 1.3: Juniper Research A2A Payments Vendors & Positioning
- Table 1.4: Juniper Research Competitor Leaderboard Heatmap for A2A Payments Vendors
2. Company Profiles
- 2.1. Vendor Profiles
- 2.1.1. Aeropay
- i. Corporate
- Table 2.1: Aeropay Funding Rounds ($m), 2017-2024
- ii. Geographical Spread
- iii. Key Clients & Strategic Partnerships
- iv. High-level View of Offerings
- v. Juniper Research's View: Key Strengths & Strategic Development Opportunities
- i. Corporate
- 2.1.2. Banked
- i. Corporate
- Table 2.2: Banked Funding Rounds ($m), 2018-2022
- ii. Geographical Spread
- iii. Key Clients & Strategic Partnerships
- iv. High-level View of Offerings
- v. Juniper Research's View: Key Strengths & Strategic Development Opportunities
- i. Corporate
- 2.1.3. Brankas
- i. Corporate
- Table 2.3: Brankas Funding Rounds ($m), 2018-2022
- ii. Geographical Spread
- iii. Key Clients & Strategic Partnerships
- iv. High-level View of Offerings
- v. Juniper Research's View: Key Strengths & Strategic Development Opportunities
- i. Corporate
- 2.1.4. Brite Payments
- i. Corporate
- Figure 2.4: Brite Payments Funding Rounds ($m), 2021 & 2023
- ii. Geographical Spread
- iii. Key Clients & Strategic Partnerships
- iv. High-level View of Offerings
- v. Juniper Research's View: Key Strengths & Strategic Development Opportunities
- i. Corporate
- 2.1.5. Dwolla
- i. Corporate
- Table 2.5: Dwolla Funding Rounds ($m), 2009-2021
- ii. Geographical Spread
- iii. Key Clients & Strategic Partnerships
- iv. High-level View of Offerings
- v. Juniper Research's View: Key Strengths & Strategic Development Opportunities
- i. Corporate
- 2.1.6. Fiserv
- i. Corporate
- Table 2.6: Fiserv, Financial Snapshot ($m), 2023-2024
- ii. Geographical Spread
- iii. Key Clients & Strategic Opportunities
- iv. High-level View of Offerings
- v. Juniper Research's View: Key Strengths & Strategic Development Opportunities
- i. Corporate
- 2.1.7. GoCardless
- i. Corporate
- Table 2.7: GoCardless, Financial Snapshot ($m), 2023-2024
- ii. Geographical Spread
- iii. Key Clients & Strategic Partnerships
- iv. High-level View of Offerings
- v. Juniper Research's View: Key Strengths & Strategic Development Opportunities
- i. Corporate
- 2.1.8. Ivy
- i. Corporate
- Table 2.8: Ivy Funding Rounds ($m), 2023
- ii. Geographical Spread
- iii. Key Clients & Strategic Partnerships
- iv. High-level View of Offerings
- v. Juniper Research's View: Key Strengths & Strategic Development Opportunities
- i. Corporate
- 2.1.9. Mastercard
- i. Corporate
- Figure 2.9: Mastercard Financial Snapshot ($m), 2023-2024
- ii. Geographical Spread
- iii. Key Clients & Strategic Partnerships
- iv. High-level View of Offerings
- v. Juniper Research's View: Key Strengths & Strategic Development Opportunities
- i. Corporate
- 2.1.10. Plaid
- i. Corporate
- Table 2.10: Plaid Funding Rounds ($m), 2013-2025
- ii. Geographical Spread
- iii. Key Clients & Strategic Partnerships
- iv. High-level View of Offerings
- v. Juniper Research's View: Key Strengths & Strategic Development Opportunities
- i. Corporate
- 2.1.11. Prometeo
- i. Corporate
- Table 2.11: Prometeo Funding Rounds ($m), 2018-2024
- ii. Geographical Spread
- iii. Key Clients & Strategic Partnerships
- iv. High-level View of Offerings
- v. Juniper Research's View: Key Strengths & Strategic Development Opportunities
- i. Corporate
- 2.1.12. Salt Edge
- i. Corporate
- Table 2.12: Salt Edge Funding Round ($m), 2018
- ii. Geographical Spread
- iii. Key Clients & Strategic Partnerships
- iv. High-level View of Offerings
- v. Juniper Research's View: Key Strengths & Strategic Development Opportunities
- i. Corporate
- 2.1.13. Token.io
- i. Corporate
- Table 2.13: Token.io Funding Rounds ($m), 2016-2025
- ii. Geographical Spread
- iii. Key Clients & Strategic Partnerships
- iv. High-level View of Offerings
- v. Juniper Research's View: Key Strengths & Strategic Development Opportunities
- i. Corporate
- 2.1.14. TrueLayer
- i. Corporate
- Table 2.14: TrueLayer Funding Rounds ($m), 2017-2024
- ii. Geographical Spread
- iii. Key Clients & Strategic Partnerships
- iv. High-level View of Offerings
- v. Juniper Research's View: Key Strengths & Strategic Development Opportunities
- i. Corporate
- 2.1.15. Trustly
- i. Corporate
- Table 2.15: Trustly Funding Rounds ($m), 2011-2020
- ii. Geographical Spread
- iii. Key Clients & Strategic Partnerships
- iv. High-level View of Offerings
- v. Juniper Research's View: Key Strengths & Strategic Development Opportunities
- i. Corporate
- 2.1.16. Visa
- i. Corporate
- Table 2.16: Visa Financial Snapshot ($m), 2023-2024
- ii. Geographical Spread
- iii. Key Clients & Strategic Partnerships
- iv. High-level View of Offerings
- v. Juniper Research's View: Key Strengths & Strategic Development Opportunities
- i. Corporate
- 2.1.17. Volt
- i. Corporate
- Table 2.17: Volt Funding Rounds ($m), 2020-2023
- ii. Geographical Spread
- iii. Key Clients & Strategic Partnerships
- iv. High-level View of Offerings
- Figure 2.18: Example of Volt Transformer Prompt
- v. Juniper Research's View: Key Strengths & Strategic Development Opportunities
- i. Corporate
- 2.1.18. Worldline
- i. Corporate
- Table 2.19: Worldline Revenue ($m), 2023-2024
- ii. Geographical Spread
- iii. Key Clients & Strategic Partnerships
- iv. High-level View of Offerings
- v. Juniper Research's View: Key Strengths & Strategic Development Opportunities
- i. Corporate
- 2.1.19. Yapily
- i. Corporate
- Table 2.20: Yapily Funding Rounds ($m), 2017-2021
- ii. Geographical Spread
- iii. Key Clients & Strategic Partnerships
- iv. High-level View of Offerings
- v. Juniper Research's View: Key Strengths & Strategic Development Opportunities
- i. Corporate
- 2.1.1. Aeropay
- 2.2. Juniper Research Leaderboard Assessment Methodology
- 2.2.1. Limitations & Interpretations
- Table 2.21: Juniper Research Competitor Leaderboard Scoring Criteria - A2A Payments
- 2.2.1. Limitations & Interpretations
- 2.3. Related Research
Data & Forecasting
1. Introduction & Methodology
- 1.1. Introduction
- 1.2. Methodology & Assumptions
- Figure 1.1: In-store A2A Payments Forecast Methodology
- Figure 1.2: eCommerce A2A Payments Forecast Methodology
- Figure 1.3: A2A-based P2P Payments Forecast Methodology
- Figure 1.4: Consumer Cross-border A2A Payments Forecast Methodology
- Figure 1.5: B2B Payments in the A2A Market Forecast Methodology
- Figure 1.6: B2C Payments in the A2A Market Forecast Methodology
2. Consumer A2A Summary
- 2.1. Total Number of A2A Payment Users
- Figure & Table 2.1: Total Number of A2A Payment Users (m), Globally, Split by 8 Key Regions, 2025-2030
- 2.2. Total Number of Consumer A2A Transactions
- Figure & Table 2.2: Total Number of Consumer A2A Transactions (m), Globally, Split by 8 Key Regions, 2025-2030
- 2.3. Total Value of Consumer A2A Transactions
- Figure & Table 2.3: Total Value of Consumer A2A Transactions ($m), Globally, Split by 8 Key Regions, 2025-2030
3. In-store Payments
- 3.1. Total Number of In-store A2A Payment Users
- Figure & Table 3.1: Total Number of In-store Payment Users (m), Globally, Split by 8 Key Regions, 2025-2030
- 3.2. Total Transaction Volume of In-store A2A Payments
- Figure & Table 3.2: Transaction Volume of In-store A2A Payments (m), Globally, Split by 8 Key Regions, 2025-2030
- 3.3. Total Transaction Value of In-store A2A Payments
- Figure & Table 3.3: Total Transaction Value of In-store A2A Payments (m), Globally, Split by 8 Key Regions, 2025-2030
4. eCommerce Payments
- 4.1. Total Number of Online A2A Payment Users
- Figure & Table 4.1: Total Number of Online A2A Payment Users (m), Globally, Split by 8 Key Regions, 2025-2030
- 4.2. Total Transaction Volume of Online A2A Payments
- Figure & Table 4.2: Total Transaction Volume of Online A2A Payments (m), Globally, Split by 8 Key Regions, 2025-2030
- 4.3. Total Transaction Value of Online A2A Payments
- Figure & Table 4.3: Total Transaction Value of Online A2A Payments ($m), Globally, Split by 8 Key Regions, 2025-2030
5. P2P Payments
- 5.1. Total Number of P2P A2A Payment Users
- Figure & Table 5.1: Total Number of P2P A2A Payment Users (m), Globally, Split by 8 Key Regions, 2025-2030
- 5.2. Total Transaction Volume of P2P A2A Payments
- Figure & Table 5.2: Total Transaction Volume of P2P A2A Payments (m), Globally, Split by 8 Key Regions, 2025-2030
- 5.3. Total Transaction Value of P2P A2A Payments
- Figure & Table 5.3: Total Transaction Value of P2P A2A Payments ($m), Globally, Split by 8 Key Regions, 2025-2030
6. Cross-border Payments
- 6.1. Total Number of Cross-border A2A Payment Users
- Figure & Table 6.1: Total Number of Cross-border A2A Payment Users (m), Globally, Split by 8 Key Regions, 2025-2030
- 6.2. Total Transaction Volume of Cross-border Consumer A2A Payments
- Figure & Table 6.2: Total Transaction Volume of Cross-border Consumer A2A Payments (m), Globally, Split by 8 Key Regions, 2025-2030
- 6.3. Total Transaction Value of Cross-border Consumer A2A Payments
- Figure & Table 6.3: Total Transaction Value of Cross-border Consumer A2A Payments ($m), Globally, Split by 8 Key Regions, 2025-2030
7. B2B Payments
- 7.1. Total Number of Domestic A2A B2B Transactions
- Figure & Table 7.1: Total Number of Domestic A2A B2B Transactions (m), Globally, Split by 8 Key Regions, 2025-2030
- 7.2. Total Value of Domestic A2A B2B Transactions
- Figure & Table 7.2: Total Value of Domestic A2A B2B Transactions ($m), Globally, Split by 8 Key Regions, 2025-2030
- 7.3. Total Number of Cross-border A2A B2B Transactions
- Figure & Table 7.3: Total Number of Cross-border A2A B2B Transactions (m), Globally, Split by 8 Key Regions, 2025-2030
- 7.4. Total Value of Cross-border A2A B2B Transactions
- Figure & Table 7.4: Total Value of Cross-border A2A B2B Transactions ($m), Globally, Split by 8 Key Regions, 2025-2030
8. B2C Payments
- 8.1. Total Number of Domestic A2A B2C Transaction
- Figure & Table 8.1: Total Number of Domestic A2A B2C Transactions (m), Globally, Split by 8 Key Regions, 2025-2030
- 8.2. Total Value of Domestic A2A B2C Transactions
- Figure & Table 8.2: Total Value of Domestic A2A B2C Transactions ($m), Globally, Split by 8 Key Regions, 2025-2030
- 8.3. Total Number of Cross-border A2A B2C Transactions
- Figure & Table 8.3: Total Number of Cross-border A2A B2C Transactions (m), Globally, Split by 8 Key Regions, 2025-2030
- 8.4. Total Value of Cross-border A2A B2C Transactions
- Figure & Table 8.4: Total Value of Cross-border A2A B2C Transactions ($m), Globally, Split by 8 Key Regions, 2025-2030
 即时支付市场分析及至2035年预测:依类型、产品、服务、技术、组件、应用、最终用户、部署模式及类型划分
 支付编配市场:按产品、支付方式、部署模式和垂直产业划分 - 2026-2032 年全球预测
 2025年即时支付全球市场报告2025年支付监控全球市场报告
 印度 POS 支付市场评估:依组件、依终端类型、依部署、依最终用户、依地区、机会、预测,2018-2032年日本 POS 支付市场评估:依组件、按终端类型、按作业系统、依最终用户、依地区、机会、预测,2018-2032年美国 POS 支付市场评估:依组件、依终端类型、依作业系统、依最终用户、依地区、机会、预测(2017-2031年)全球 POS 支付市场评估:依组件、终端类型、最终用户、地区、机会和预测(2017-2031年)
 即时支付的监管状况和合规挑战在新兴市场导入即时支付解决方案