


 |
市场调查报告书
商品编码
1807082
全球整形外科支架和支撑市场(按产品、类型、应用、分销管道和地区划分)- 预测至 2030 年Orthopedic Braces & Supports Market by Product (Knee, Ankle, Hip, Spine, Shoulder, Neck, Elbow, Hand, Wrist), Category (Soft, Rigid, Hinged), Application (Ligament (ACL, LCL), Preventive, OA), Distribution (Pharmacies) - Global Forecast to 2030 |
||||||
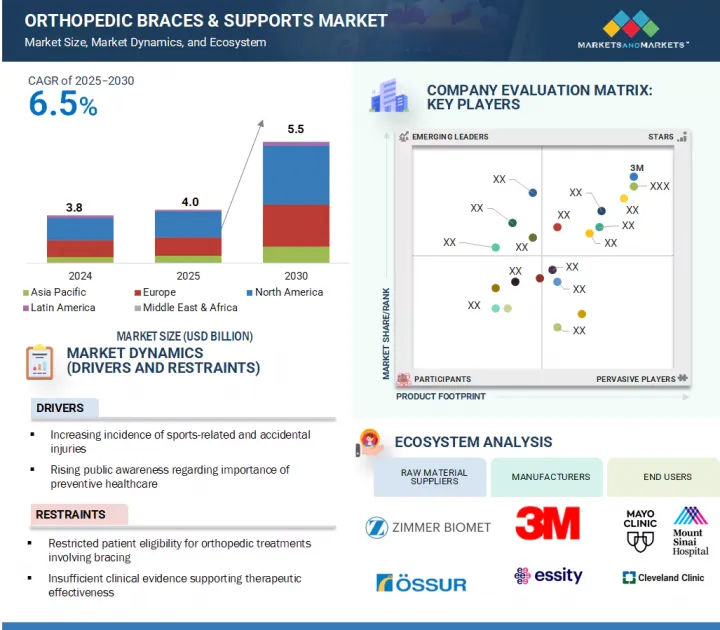
全球整形外科支架和支撑市场预计将从 2025 年的 40.8 亿美元成长到 2030 年的 55.951 亿美元,2025 年至 2030 年的复合年增长率为 6.5%。
受人口结构变化、医疗保健需求、技术进步以及消费行为转变的推动,整形外科支架和支援市场正经历强劲成长。由于人口老化和久坐不动的生活方式,肌肉骨骼疾病的发生率不断上升,这显着增加了对这些产品的需求。
| 调查范围 | |
|---|---|
| 调查年份 | 2024-2030 |
| 基准年 | 2024 |
| 预测期 | 2025-2030 |
| 对价单位 | 金额(十亿美元) |
| 部分 | 按产品、类型、应用、分销管道和地区 |
| 目标区域 | 北美、欧洲、亚太地区、拉丁美洲、中东和非洲 |
同时,体育运动和体力活动的参与度不断提高,导致扭伤、骨折和断裂等损伤的发生率也随之上升,进一步扩大了市场规模。轻量透气材料、3D列印以及配备感测器的智慧矫正器具等技术创新,正在提升矫正器具的舒适度、贴合度和治疗效果,使其更具吸引力。此外,对预防性护理和非侵入性治疗的关注、医疗保健支出的不断增长,以及电子商务和保险覆盖率的提高,正在推动矫正器的全球应用和市场扩张。
按产品类型,整形外科支架和支援市场分为膝关节矫正器具和支撑、踝矫正器具和矫正器具、足部助行器和支架、背部、臀部和脊椎矫正器具和支撑(颈部、颈椎和下脊椎)、肩部矫正器具和矫正器具、肘部矫正器具和支撑、手部、腕关节支架和支撑以及脸部矫正器具和支撑。膝关节矫正器具和支撑部分占整形外科支架和支撑支援市场的最大收入。由于各种因素,膝关节矫正器具和支援市场正在经历强劲成长。人口老化、肥胖增加和更积极的生活方式是导致膝关节损伤和骨关节炎等退化性疾病发病率上升的主要原因,这些疾病的需求正在稳步增加。人们越来越多地参与体育和健身活动,导致急性和重复性劳损激增,促使运动员和健身爱好者寻求预防和康復矫正器具。轻质透气材料、铰链设计、可调节压缩功能以及3D列印客製化矫正器具等技术创新显着提升了产品的舒适度、功能性和使用者依从性。此外,医疗保健提供者和消费者对非侵入性治疗方案的认识不断提高,也推动了其接受度。线上平台和零售通路产品供应的增加以及报销覆盖范围的扩大,进一步推动了这一趋势,从而推动了市场的成长。
按类型,整形外科支架和支援市场分为软弹性矫正器具和支撑、硬矫正器具和支撑以及铰链矫正器具和支撑。整形外科支架和支援市场中软弹性矫正器具和支撑的成长受到几个关键因素的驱动,包括扭伤、拉伤和关节不稳定等肌肉骨骼疾病的盛行率上升,尤其是在老年人和身体活跃的人群中。这些产品因其舒适性、灵活性、轻巧的设计和易用性而广受欢迎,使其成为日常穿着、预防保健和早期康復的理想选择。对非侵入性和负担得起的治疗方案的需求不断增长,进一步推动了软矫正器具的采用。吸湿排汗、透气和抗菌纺织品等织物材料的进步正在提高舒适度和依从性。此外,这些矫正器具的非处方和网上销售、消费者意识的提高以及医疗保健专业人士对保守治疗轻微整形外科问题的建议,都促进了这一领域的增长。
根据应用,整形外科支架和支援市场可细分为预防保健、韧带损伤(前十字韧带损伤、外侧副韧带损伤和其他韧带损伤)、术后復健、骨关节炎、压迫疗法和骨折管理。预防保健是整形外科支架和支援市场中成长最快的部分。这一部分的增长受到以下几个关键因素的推动:特别是运动员和健身爱好者越来越意识到在受伤前保护关节和支撑肌肉的重要性;医疗保健提供者越来越倾向于在早期和易受压力的情况下进行保守、非侵入性治疗;轻质透气材料和无缝设计的进步提高了矫正器具的舒适性和耐磨性;职场健康计划和人体工学倡议的增加提倡使用矫正器具来减少肌肉骨骼劳损;通过非处方和在线销售管道更容易获得预防性矫正器具,矫正器具更容易获得併鼓励儘早采用。
整形外科支架和支援市场涵盖五个主要区域:北美、欧洲、亚太地区、拉丁美洲以及中东和非洲。北美整形外科支架和支援市场由于多种关键因素而经历强劲成长。由于人口老化、肥胖率上升和生活方式更加活跃,关节炎、骨质疏鬆症和运动相关损伤等肌肉骨骼疾病的盛行率不断上升,这极大地推动了需求。该地区受益于成熟的医疗保健基础设施、支持性的法规环境(包括 FDA 批准)以及医疗保险、医疗补助和私人保险公司提供的优惠报销选择,所有这些都提高了医疗服务的可及性和可负担性。 3D 列印、智慧材料、透气材料和嵌入式感测器矫正器具等技术创新正在提高产品性能、客製化和用户舒适度。此外,体育和健身活动的日益普及,以及职场健康和人体工学倡议,正在推动对预防性整形外科解决方案的需求。此外,与医疗保健专业人士的策略性合併、收购和合作帮助该公司拓宽了其产品范围并加强了其在全部区域的分销网络。
本报告研究了全球整形外科支架和支援市场,并根据产品、类型、应用、分销管道、区域趋势和参与市场的公司概况对其进行细分。
目录
第一章 引言
第二章调查方法
第三章执行摘要
第四章重要考察
第五章市场概述
- 介绍
- 市场动态
- 监管状况
- 还款情境分析
- 价值链分析
- 供应链分析
- 生态系市场图
- 贸易分析
- 专利分析
- 定价分析
- 技术分析
- 波特五力分析
- 主要相关人员和采购标准
- 大型会议及活动
- 案例研究分析
- 影响客户业务的趋势/中断
- 投资金筹措场景
- 未满足的需求
- 人工智慧对整形外科支架和支援市场的影响
- 2025年美国关税的影响-整形外科支架与支援市场
第六章整形外科支架和支援市场(按产品)
- 介绍
- 膝关节支架和支撑
- 踝关节支架和支撑
- 助行器和矫正器
- 背部、腰部和脊椎支架和支撑
- 肩部支架和支撑
- 肘部支架和支撑
- 手部和腕部支架和支撑
- 脸部支架和支撑
第七章整形外科支架和支援市场(按类型)
- 介绍
- 柔软、灵活的支架和支撑
- 硬支架和支撑
- 铰链支架和支撑
第八章整形外科矫正器具和支撑市场(按应用)
- 介绍
- 预防保健
- 韧带损伤
- 术后康復
- 骨关节炎
- 压迫疗法
- 骨折管理
- 其他的
第九章整形外科支架和支援市场(按分销管道)
- 介绍
- 医院和外科中心
- 整形外科诊所
- 药局和零售店
- 电商平台
- DME经销商
- 其他的
第十章整形外科支架和支援市场(按地区)
- 介绍
- 北美洲
- 北美:宏观经济展望
- 美国
- 加拿大
- 欧洲
- 欧洲:宏观经济展望
- 德国
- 英国
- 法国
- 义大利
- 西班牙
- 其他的
- 亚太地区
- 亚太地区:宏观经济展望
- 中国
- 日本
- 印度
- 澳洲
- 韩国
- 其他的
- 拉丁美洲
- 拉丁美洲:宏观经济展望
- 巴西
- 墨西哥
- 其他的
- 中东和非洲
- 中东与非洲:宏观经济展望
- 海湾合作委员会国家
- 其他的
第十一章竞争格局
- 介绍
- 主要参与企业的策略/优势
- 2022-2024年收益分析
- 2024年市场占有率分析
- 2024年市场排名分析
- 公司估值矩阵:2024 年关键参与企业
- 公司估值矩阵:Start-Ups/中小企业,2024 年
- 竞争场景
- 估值和财务指标
- 品牌/产品比较
第十二章:公司简介
- 主要参与企业
- 3M COMPANY
- ESSITY HEALTH & MEDICAL
- OSSUR
- THUASNE
- ZIMMER BIOMET HOLDINGS, INC.
- BIRD & CRONIN, LLC(DYNATRONICS CORPORATION)
- ENOVIS CORPORATION
- OTTOBOCK
- BAUERFEIND
- BREG, INC
- DEROYAL INDUSTRIES, INC.
- ALCARE CO., LTD
- NIPPON SIGMAX CO., LTD.
- MEDI GMBH & CO. KG
- TRULIFE
- 其他公司
- FOUNDATION WELLNESS(FORMERLY KNOWN AS REMINGTON PRODUCTS COMPANY)
- MCDAVID, INC.(A PART OF SHOCK DOCTOR)
- MUELLER SPORTS MEDICINE, INC.
- BECKER ORTHOPEDIC
- ORLIMAN SLU(A PART OF MAGNUM INDUSTRIAL PARTNERS)
- FRANK STUBBS COMPANY INC.
- ASPEN MEDICAL PRODUCTS LLC
- DARCO INTERNATIONAL, INC.
- UNITED MEDICARE
- VISSCO REHABILITATION AIDS PVT. LTD.
第十三章 附录
The global orthopedic braces & supports market is anticipated to grow from USD 4,080.0 million in 2025 to USD 5,595.1 million in 2030 at a CAGR of 6.5% from 2025 to 2030. The orthopedic braces & supports market is experiencing strong growth, driven by demographic changes, healthcare needs, technological advances, and shifts in consumer behavior. The rising occurrence of musculoskeletal disorders-mainly due to an aging population and sedentary lifestyles-has greatly increased demand for these products.
| Scope of the Report | |
|---|---|
| Years Considered for the Study | 2024-2030 |
| Base Year | 2024 |
| Forecast Period | 2025-2030 |
| Units Considered | Value (USD billion) |
| Segments | Product, Type, Application, Distribution Channel, and Region |
| Regions covered | North America, Europe, Asia Pacific, Latin America, and Middle East & Africa |
At the same time, more participation in sports and physical activities has led to a rise in injuries such as sprains, fractures, and ligament tears, further expanding the market. Innovations like lightweight, breathable materials, 3D printing, and smart braces with sensors are improving comfort, fit, and treatment results, making these devices more attractive. Additionally, the focus on preventive care and non-invasive treatments, along with higher healthcare spending and better access through e-commerce and insurance coverage, is boosting adoption and market reach worldwide.
"The knee braces & supports segment accounted for the highest growth rate in the orthopedic braces & supports products market in 2024."
By product, the orthopedic braces & supports market is segmented into knee braces & supports, ankle braces & supports, foot walkers & orthoses, back, hip and spine braces & supports (neck and cervical, lower spine), shoulder braces & supports, elbow braces & supports, hand & wrist braces & supports, facial braces & supports. The knee braces & supports segment accounted for the greatest amount of revenue in the orthopedic braces & supports market . The knee braces & supports market is experiencing strong growth, driven by a combination of factors. The rising incidence of knee-related injuries and degenerative conditions like osteoarthritis-mainly due to aging populations, increasing obesity levels, and more active lifestyles-has resulted in a steady increase in demand. Greater participation in sports and fitness activities has led to a surge in both acute and repetitive strain injuries, prompting athletes and fitness enthusiasts to seek preventive and rehabilitative bracing solutions. Innovations in technology, such as lightweight, breathable materials, hinged designs, adjustable compression features, and 3D-printed custom braces, have greatly improved product comfort, functionality, and user compliance. Additionally, growing awareness among healthcare providers and consumers about non-invasive treatment options has increased acceptance. This trend is further supported by easier product access through online platforms, retail channels, and improved reimbursement coverage, collectively fueling market growth.
"The soft & elastic braces & supports segment held the largest market share, by type, in 2024."
Based on the type, the market for orthopedic braces & supports is divided into soft & elastic braces & supports, hard braces & supports, and hinged braces & supports. The growth of soft & elastic braces & supports in the orthopedic braces & supports market is driven by several key factors, including the increasing prevalence of musculoskeletal conditions like sprains, strains, and joint instability, especially among the elderly and physically active groups. These products are popular for their comfort, flexibility, lightweight design, and ease of use, making them ideal for daily wear, preventive care, and early-stage rehabilitation. The rising demand for non-invasive, affordable treatment options has further boosted the adoption of soft braces. Advances in fabric materials-such as moisture-wicking, breathable, and antimicrobial textiles-have enhanced user experience and compliance. Moreover, the availability of these braces over the counter and online, along with growing consumer awareness and recommendations from healthcare professionals for conservative management of mild orthopedic issues, significantly contributes to the growth of this segment.
"The preventive care application segment held the largest share of the market in 2024."
Based on the application, the market for orthopedic braces & supports is divided into preventive care, ligament injury (anterior cruciate ligament injury, lateral collateral ligament injury, other ligament injury), post-operative rehabilitation, osteoarthritis, compression therapy, and fracture management. Preventive care is seeing the highest growth in the orthopedic braces & supports market . This sector is gaining momentum due to several key factors: increased awareness among individuals-especially athletes and fitness enthusiasts-about the importance of joint protection and muscle support before injuries happen; a growing preference among healthcare providers for conservative, non-invasive treatments in early-stage or stress-prone conditions; improvements in brace comfort and wearability through advancements in lightweight, breathable materials and seamless designs; a rise in workplace wellness programs and ergonomics initiatives promoting brace use to reduce musculoskeletal strain; and expanded access via over-the-counter products and online sales channels, making preventive braces more accessible and encouraging early adoption.
"The North American market is expected to hold a significant market share for orthopedic braces & supports market in 2024."
The market for orthopedic braces & supports encompasses five significant geographies: North America, Europe, the Asia Pacific, Latin America, and the Middle East & Africa. The North American orthopedic braces & supports market is experiencing robust growth, fueled by several key factors. The rising incidence of musculoskeletal conditions like arthritis, osteoporosis, and sports-related injuries-mainly due to an aging population, increasing obesity rates, and more active lifestyles-has significantly boosted demand. The region benefits from a mature healthcare infrastructure, a supportive regulatory environment (including FDA approvals), and favorable reimbursement options through Medicare, Medicaid, and private insurers, all of which improve access and affordability. Technological innovations such as 3D printing, smart materials, breathable fabrics, and sensor-embedded braces are enhancing product performance, customization, and user comfort. Additionally, the rising popularity of sports and fitness activities, along with workplace wellness and ergonomic initiatives, is fueling demand for preventive orthopedic solutions. Moreover, strategic mergers, acquisitions, and collaborations with healthcare professionals are helping companies broaden their product ranges and strengthen distribution networks throughout the region.
The primary interviews conducted for this report can be categorized as follows:
- By Company Type: Tier 1: 20%, Tier 2: 45%, and Tier 3: 35%
- By Designation: C-level: 30%, Director-level: 20%, and Others: 50%
- By Region: North America: 36%, Europe: 25%, Asia Pacific: 27%, and Rest of the World: 12%
List of key Companies Profiled in the Report:
The prominent players in the orthopedic braces & supports market are Alcare Co., Ltd. (Japan), Aspen Medical, LLC (Australia), Becker Orthopedic (US), Bauerfeind (Germany), Breg, Inc. (US), DARCO International, Inc. (US), DeRoyal Industries, Inc. (US), ESSITY HEALTH & MEDICAL (Sweden), FOUNDATION WELLNESS (US), Frank stubbs company inc (US), Mueller Sports Medicine, Inc (US ), MEDI GMBH & CO. KG (Germany), and MCDAVID (US ) among others.
Research Coverage:
This report examines the orthopedic braces & supports market based on product, type, application, distribution channel, and region. It also discusses the factors influencing market growth, analyzes the various opportunities and challenges, and provides details about the competitive landscape for market leaders. Additionally, the report assesses micro markets in terms of their individual growth trends and forecasts revenue for market segments across five main regions and their respective countries.
Key Benefits of Buying the Report:
The report will assist market leaders and new entrants by providing approximate revenue figures for the overall orthopedic braces & supports market and its subsegments. It will also help stakeholders better understand the competitive landscape and gain insights to more effectively position their business and develop appropriate go-to-market strategies. This report will enable stakeholders to grasp the market's pulse and offer information on key market drivers, restraints, opportunities, and challenges.
The report provides insights on the following pointers:
- Analysis of key drivers (rising incidence of orthopedic conditions and musculoskeletal disorders), restraints (restricted eligibility of patients for orthopedic treatment involving bracing), opportunities (growth in sales of ready-to-use and e-commerce-based orthopedic products), and challenges (widespread reliance on pain medications as an alternative to bracing solutions).
- Product Development/Innovation: Detailed insights on upcoming technologies, research and development activities, and new product approvals/launches in the orthopedic braces & supports market.
- Market Development: Comprehensive information about lucrative markets-the report analyses the market across varied regions.
- Market Diversification: Exhaustive information about new products, untapped geographies, recent developments, and investments in the orthopedic braces & supports market
- Competitive Assessment: In-depth assessment of market shares, growth strategies, and product offerings of leading players. A detailed analysis of the key industry players has been done to provide insights into their key strategies, product launches/ approvals, pipeline analysis, acquisitions, partnerships, agreements, collaborations, other recent developments, investment and funding activities, brand/product comparative analysis, and vendor valuation and financial metrics of the orthopedic braces & supports market."
TABLE OF CONTENTS
1 INTRODUCTION
- 1.1 STUDY OBJECTIVES
- 1.2 MARKET DEFINITION
- 1.3 STUDY SCOPE
- 1.3.1 MARKETS COVERED AND REGIONAL SCOPE
- 1.3.2 INCLUSIONS & EXCLUSIONS
- 1.3.3 YEARS CONSIDERED
- 1.3.4 CURRENCY CONSIDERED
- 1.4 STAKEHOLDERS
- 1.5 SUMMARY OF CHANGES
2 RESEARCH METHODOLOGY
- 2.1 RESEARCH APPROACH
- 2.2 RESEARCH DATA SOURCES
- 2.2.1 SECONDARY RESEARCH SOURCES
- 2.2.2 PRIMARY RESEARCH SOURCES
- 2.2.2.1 Primary sources
- 2.2.2.2 Key industry insights
- 2.2.2.3 Breakdown of primaries
- 2.3 MARKET SIZE ESTIMATION METHODOLOGY
- 2.3.1 APPROACH 1: COMPANY REVENUE ESTIMATION APPROACH
- 2.3.2 APPROACH 2: CUSTOMER-BASED MARKET ESTIMATION
- 2.4 MARKET FORECASTING APPROACH
- 2.4.1.1 CAGR projections
- 2.5 DATA TRIANGULATION APPROACH
- 2.6 STUDY ASSUMPTIONS
- 2.7 RISK ASSESSMENT
- 2.7.1 RISK ASSESSMENT: ORTHOPEDIC BRACES & SUPPORTS MARKET
3 EXECUTIVE SUMMARY
4 PREMIUM INSIGHTS
- 4.1 ORTHOPEDIC BRACES & SUPPORTS MARKET OVERVIEW
- 4.2 REGIONAL SNAPSHOT OF ORTHOPEDIC BRACES & SUPPORTS MARKET
5 MARKET OVERVIEW
- 5.1 INTRODUCTION
- 5.2 MARKET DYNAMICS
- 5.2.1 DRIVERS
- 5.2.1.1 Rise in incidence of musculoskeletal and joint-related conditions
- 5.2.1.2 Growth in incidence of athletic and accident-induced musculoskeletal injuries
- 5.2.1.3 Increase in consciousness around preventive orthopedic health
- 5.2.2 RESTRAINTS
- 5.2.2.1 Low public awareness regarding available orthopedic treatment options
- 5.2.2.2 Reimbursement challenges in emerging and developed markets
- 5.2.3 OPPORTUNITIES
- 5.2.3.1 Expansion in pediatric and geriatric orthopedics
- 5.2.3.2 Shift toward at-home rehabilitation and remote patient monitoring
- 5.2.3.3 Rising demand for ready-to-use orthopedic supports via eCommerce platforms
- 5.2.4 CHALLENGES
- 5.2.4.1 Shortage of trained orthotists and technicians
- 5.2.4.2 Poor fitness and bulkiness of braces affect wearability and long-term usage
- 5.2.1 DRIVERS
- 5.3 REGULATORY LANDSCAPE
- 5.3.1 KEY REGULATORY GUIDELINES
- 5.3.1.1 North America
- 5.3.1.2 Europe
- 5.3.1.2.1 UK
- 5.3.1.2.2 France
- 5.3.1.2.3 Germany
- 5.3.1.3 Asia Pacific
- 5.3.1.3.1 China
- 5.3.1.3.2 Japan
- 5.3.1.3.3 India
- 5.3.1.4 Latin America
- 5.3.1.4.1 Brazil
- 5.3.1.4.2 Mexico
- 5.3.1.5 Middle East & Africa
- 5.3.1.5.1 Saudi Arabia
- 5.3.1.5.2 United Arab Emirates (UAE)
- 5.3.1.5.3 South Africa
- 5.3.1 KEY REGULATORY GUIDELINES
- 5.4 REIMBURSEMENT SCENARIO ANALYSIS
- 5.5 VALUE CHAIN ANALYSIS
- 5.5.1 R&D
- 5.5.2 RAW MATERIAL PROCUREMENT & PRODUCT DEVELOPMENT
- 5.5.3 MARKETING, SALES, AND DISTRIBUTION
- 5.5.4 POST-SALES SERVICES
- 5.6 SUPPLY CHAIN ANALYSIS
- 5.6.1 RAW MATERIAL
- 5.6.2 MANUFACTURING
- 5.6.3 SALES & DISTRIBUTIONS
- 5.6.4 END USERS
- 5.7 ECOSYSTEM MARKET MAP
- 5.8 TRADE ANALYSIS
- 5.8.1 IMPORT SCENARIO (HS CODE 902110)
- 5.8.2 EXPORT SCENARIO (HS CODE 902110)
- 5.9 PATENT ANALYSIS
- 5.10 PRICING ANALYSIS
- 5.10.1 AVERAGE SELLING PRICE TREND FOR ORTHOPEDIC BRACES
- 5.10.2 AVERAGE SELLING PRICE TREND OF KEY PLAYERS FOR ORTHOPEDIC BRACES
- 5.10.3 AVERAGE SELLING PRICE TREND OF ORTHOPEDIC BRACES, BY REGION
- 5.11 TECHNOLOGY ANALYSIS
- 5.11.1 KEY TECHNOLOGIES
- 5.11.1.1 Advanced material technologies
- 5.11.2 COMPLEMENTARY TECHNOLOGIES
- 5.11.2.1 Mobile health (M-health) & tele-rehabilitation platforms
- 5.11.3 ADJACENT TECHNOLOGIES
- 5.11.3.1 Prosthetics and orthotics technologies
- 5.11.1 KEY TECHNOLOGIES
- 5.12 PORTER'S FIVE FORCES ANALYSIS
- 5.12.1 THREAT OF NEW ENTRANTS
- 5.12.2 THREAT OF SUBSTITUTES
- 5.12.3 BARGAINING POWER OF SUPPLIERS
- 5.12.4 BARGAINING POWER OF BUYERS
- 5.12.5 INTENSITY OF COMPETITIVE RIVALRY
- 5.13 KEY STAKEHOLDERS & BUYING CRITERIA
- 5.13.1 KEY STAKEHOLDERS IN BUYING PROCESS
- 5.13.2 KEY BUYING CRITERIA
- 5.14 KEY CONFERENCES & EVENTS
- 5.15 CASE STUDY ANALYSIS
- 5.15.1 RAPID BRACING INTERVENTION ENABLES ACTIVE LIFESTYLE DESPITE KNEE INJURY: SAMANTHA'S JOURNEY WITH ARTHRITIS & INJURY CARE CENTRE
- 5.16 TRENDS/DISRUPTIONS IMPACTING CUSTOMERS' BUSINESSES
- 5.17 INVESTMENT & FUNDING SCENARIO
- 5.18 UNMET NEEDS
- 5.19 IMPACT OF AI ON ORTHOPEDIC BRACES & SUPPORTS MARKET
- 5.19.1 INTRODUCTION
- 5.19.2 MARKET POTENTIAL OF AI ON ORTHOPEDIC BRACES & SUPPORTS
- 5.19.3 AI USE CASES
- 5.19.4 KEY COMPANIES IMPLEMENTING AI
- 5.19.5 FUTURE OF AI ON ORTHOPEDIC BRACES & SUPPORTS MARKET
- 5.20 IMPACT OF 2025 US TARIFF - ORTHOPEDIC BRACES & SUPPORTS MARKET
- 5.20.1 INTRODUCTION
- 5.20.2 KEY TARIFF RATES
- 5.20.3 PRICE IMPACT ANALYSIS
- 5.20.4 IMPACT ON COUNTRY/REGION
- 5.20.4.1 US
- 5.20.4.2 Europe
- 5.20.4.3 Asia Pacific
- 5.20.5 IMPACT ON END-USE INDUSTRIES
6 ORTHOPEDIC BRACES & SUPPORTS MARKET, BY PRODUCT
- 6.1 INTRODUCTION
- 6.2 KNEE BRACES & SUPPORTS
- 6.2.1 GROWTH IN ELDERLY POPULATION COUPLED WITH SURGE IN SPORTS-RELATED INJURIES
- 6.3 ANKLE BRACES & SUPPORTS
- 6.3.1 INCREASE IN INCIDENCE OF ANKLE INJURIES AND ANKLE OSTEOARTHRITIS
- 6.4 FOOT WALKER & ORTHOSES
- 6.4.1 RISE IN INCIDENCE OF DIABETES AND AWARENESS ABOUT PREVENTIVE FOOT CARE
- 6.5 BACK, HIP, AND SPINE BRACES & SUPPORTS
- 6.5.1 INCREASE IN INCIDENCE OF LOWER BACK PAIN, SPINAL STENOSIS, SCOLIOSIS, HERNIATED DISCS, AND DEGENERATIVE DISC DISEASES
- 6.5.2 NECK AND CERVICAL BRACES & SUPPORTS
- 6.5.2.1 Increase in incidence of neck injuries caused by road accidents, sports-related incidents, and occupational hazards
- 6.5.3 LOWER SPINE BRACES & SUPPORTS
- 6.5.3.1 Growth in aging population prone to lower spine degeneration
- 6.6 SHOULDER BRACES & SUPPORTS
- 6.6.1 RISE IN CASES OF SPORTS INJURIES, ROAD ACCIDENTS, AND AGE-RELATED MUSCULOSKELETAL DISORDERS
- 6.7 ELBOW BRACES & SUPPORTS
- 6.7.1 GROWTH IN PARTICIPATION IN PHYSICAL AND ATHLETIC ACTIVITIES, COUPLED WITH GREATER AWARENESS OF NON-INVASIVE ORTHOPEDIC TREATMENTS AND EARLY INTERVENTION
- 6.8 HAND & WRIST BRACES & SUPPORTS
- 6.8.1 AGING POPULATION AND REPETITIVE STRAIN INJURIES AMONG WORKERS
- 6.9 FACIAL BRACES & SUPPORTS
- 6.9.1 INCREASE IN DEMAND FOR FACIAL RECONSTRUCTION SURGERIES AND RISE IN INCIDENCE OF CONGENITAL CRANIAL DEFORMITIES
7 ORTHOPEDIC BRACES & SUPPORTS MARKET, BY TYPE
- 7.1 INTRODUCTION
- 7.2 SOFT AND ELASTIC BRACES & SUPPORTS
- 7.2.1 ADVANTAGES OF SOFT & ELASTIC BRACES AND SUPPORTS INCLUDE THEIR FLEXIBILITY AND EASE OF USE
- 7.3 HARD BRACES & SUPPORTS
- 7.3.1 SUPPORTIVE REIMBURSEMENT SCENARIO AND RISING PREVALENCE OF TARGET DISEASES
- 7.4 HINGED BRACES & SUPPORTS
- 7.4.1 GROWTH IN GERIATRIC POPULATION AND RISE IN INCIDENCE OF LIGAMENT INJURIES
8 ORTHOPEDIC BRACES & SUPPORTS MARKET, BY APPLICATION
- 8.1 INTRODUCTION
- 8.2 PREVENTIVE CARE
- 8.2.1 INCREASE IN PUBLIC PARTICIPATION IN SPORTS-RELATED ACTIVITIES
- 8.3 LIGAMENT INJURY
- 8.3.1 ANTERIOR CRUCIATE LIGAMENT (ACL) INJURY
- 8.3.1.1 ACL injury applications to register highest growth rate during forecast period
- 8.3.2 LATERAL COLLATERAL LIGAMENT (LCL) INJURY
- 8.3.2.1 Rise in reimbursements of LCL-related surgical procedures
- 8.3.3 OTHER LIGAMENT INJURY
- 8.3.1 ANTERIOR CRUCIATE LIGAMENT (ACL) INJURY
- 8.4 POST-OPERATIVE REHABILITATION
- 8.4.1 INCREASE IN NUMBER OF ORTHOPEDIC RECONSTRUCTIVE SURGERIES
- 8.5 OSTEOARTHRITIS
- 8.5.1 RISE IN OSTEOARTHRITIS CASES AND PUBLIC AWARENESS ON SIDE-EFFECTS OF ORAL MEDICATION FOR PAIN MANAGEMENT
- 8.6 COMPRESSION THERAPY
- 8.6.1 INNOVATION OF TECHNOLOGICALLY ADVANCED COMPRESSION BRACES
- 8.7 FRACTURE MANAGEMENT
- 8.7.1 RISE IN FRACTURE INCIDENCE, AGING POPULATIONS WITH OSTEOPOROSIS, AND GROWING PREFERENCE FOR NON-SURGICAL, EARLY MOBILIZATION SOLUTIONS
- 8.8 OTHER APPLICATIONS
9 ORTHOPEDIC BRACES & SUPPORTS MARKET, BY DISTRIBUTION CHANNEL
- 9.1 INTRODUCTION
- 9.2 HOSPITALS & SURGICAL CENTERS
- 9.2.1 INCREASE IN INVESTMENTS IN HOSPITAL INFRASTRUCTURE
- 9.3 ORTHOPEDIC CLINICS
- 9.3.1 SHORTER HOSPITAL STAYS, REDUCED TREATMENT COSTS, AND IMPROVED POST-OPERATIVE CARE
- 9.4 PHARMACIES & RETAILERS
- 9.4.1 WIDESPREAD AVAILABILITY OF PRODUCTS THROUGH RETAIL STORES AND PHARMACIES
- 9.5 E-COMMERCE PLATFORMS
- 9.5.1 GROWTH IN POPULARITY OF ECOMMERCE AND ITS CONVENIENCE
- 9.6 DME DEALERS
- 9.6.1 GROWTH IN ELDERLY POPULATION AND RISE IN INCIDENCE OF CHRONIC HEALTH CONDITIONS
- 9.7 OTHER DISTRIBUTION CHANNELS
10 ORTHOPEDIC BRACES & SUPPORTS MARKET, BY REGION
- 10.1 INTRODUCTION
- 10.2 NORTH AMERICA
- 10.2.1 NORTH AMERICA: MACROECONOMIC OUTLOOK
- 10.2.2 US
- 10.2.2.1 Rise in cases of osteoarthritis and rheumatoid arthritis and growth in preference for minimally invasive procedures
- 10.2.3 CANADA
- 10.2.3.1 Increase in prevalence of degenerative bone disorders and uptick in road accident-related injuries
- 10.3 EUROPE
- 10.3.1 EUROPE: MACROECONOMIC OUTLOOK
- 10.3.2 GERMANY
- 10.3.2.1 Rise in engagement in sports activities and growing awareness of healthy living
- 10.3.3 UK
- 10.3.3.1 Rise in awareness of orthopedic health issues challenged by rising costs of procedures
- 10.3.4 FRANCE
- 10.3.4.1 Increase in incidence of musculoskeletal disorders
- 10.3.5 ITALY
- 10.3.5.1 High incidence of sports-related injuries often managed non-invasively
- 10.3.6 SPAIN
- 10.3.6.1 Increase in presence of leading manufacturers and surge in osteoarthritis and osteoporosis cases
- 10.3.7 REST OF EUROPE
- 10.4 ASIA PACIFIC
- 10.4.1 ASIA PACIFIC: MACROECONOMIC OUTLOOK
- 10.4.2 CHINA
- 10.4.2.1 Need for effective rehabilitation solutions and related products with expanding target patient population
- 10.4.3 JAPAN
- 10.4.3.1 Rapidly aging population and supportive government initiatives
- 10.4.4 INDIA
- 10.4.4.1 Shift from traditional analog systems to modern digital systems utilizing flat panel detectors (FPDs)
- 10.4.5 AUSTRALIA
- 10.4.5.1 Expanding patient base, advancements in product design, and ongoing efforts to improve musculoskeletal care
- 10.4.6 SOUTH KOREA
- 10.4.6.1 Hub for technological innovation in medical devices, with domestic companies investing in smart, wearable technologies
- 10.4.7 REST OF ASIA PACIFIC
- 10.5 LATIN AMERICA
- 10.5.1 LATIN AMERICA: MACROECONOMIC OUTLOOK
- 10.5.2 BRAZIL
- 10.5.2.1 Strong global player presence supported by extensive distribution networks
- 10.5.3 MEXICO
- 10.5.3.1 Improved access to healthcare services and increasing availability of ecommerce platforms
- 10.5.4 REST OF LATIN AMERICA
- 10.6 MIDDLE EAST & AFRICA
- 10.6.1 MIDDLE EAST & AFRICA: MACROECONOMIC OUTLOOK
- 10.6.2 GCC COUNTRIES
- 10.6.2.1 Focus on infrastructure development and improved healthcare accessibility
- 10.6.3 REST OF MIDDLE EAST & AFRICA
11 COMPETITIVE LANDSCAPE
- 11.1 INTRODUCTION
- 11.2 KEY PLAYER STRATEGIES/RIGHT TO WIN
- 11.3 REVENUE ANALYSIS, 2022-2024
- 11.4 MARKET SHARE ANALYSIS, 2024
- 11.5 MARKET RANKING ANALYSIS, 2024
- 11.6 COMPANY EVALUATION MATRIX: KEY PLAYERS, 2024
- 11.6.1 STARS
- 11.6.2 EMERGING LEADERS
- 11.6.3 PERVASIVE PLAYERS
- 11.6.4 PARTICIPANTS
- 11.6.5 COMPANY FOOTPRINT: KEY PLAYERS, 2024
- 11.6.5.1 Company footprint
- 11.6.5.2 Product footprint
- 11.6.5.3 Regional footprint
- 11.6.5.4 Type footprint
- 11.6.5.5 Application footprint
- 11.6.5.6 Distribution channel footprint
- 11.7 COMPANY EVALUATION MATRIX: STARTUPS/SMES, 2024
- 11.7.1 PROGRESSIVE COMPANIES
- 11.7.2 RESPONSIVE COMPANIES
- 11.7.3 DYNAMIC COMPANIES
- 11.7.4 STARTING BLOCKS
- 11.7.5 COMPETITIVE BENCHMARKING OF STARTUPS/SMES, 2024
- 11.7.5.1 Detailed list of key startups/SMEs
- 11.7.5.2 Competitive benchmarking of key startups/SMEs
- 11.8 COMPETITIVE SCENARIO
- 11.8.1 PRODUCT LAUNCHES AND APPROVALS
- 11.8.2 DEALS
- 11.9 COMPANY VALUATION & FINANCIAL METRICS
- 11.10 BRAND/PRODUCT COMPARISON
12 COMPANY PROFILES
- 12.1 KEY PLAYERS
- 12.1.1 3M COMPANY
- 12.1.1.1 Business overview
- 12.1.1.2 Products offered
- 12.1.1.3 MnM view
- 12.1.1.3.1 Key strengths/Right to win
- 12.1.1.3.2 Strategic choices
- 12.1.1.3.3 Weaknesses and competitive threats
- 12.1.2 ESSITY HEALTH & MEDICAL
- 12.1.2.1 Business overview
- 12.1.2.2 Products offered
- 12.1.2.3 Recent developments
- 12.1.2.3.1 Deals
- 12.1.2.4 MnM view
- 12.1.2.4.1 Key strengths/Right to win
- 12.1.2.4.2 Strategic choices
- 12.1.2.4.3 Weaknesses and competitive threats
- 12.1.3 OSSUR
- 12.1.3.1 Business overview
- 12.1.3.2 Products offered
- 12.1.3.3 Recent developments
- 12.1.3.3.1 Product launches and approvals
- 12.1.3.3.2 Deals
- 12.1.3.4 MnM view
- 12.1.3.4.1 Key strengths/Right to win
- 12.1.3.4.2 Strategic choices
- 12.1.3.4.3 Weaknesses and competitive threats
- 12.1.4 THUASNE
- 12.1.4.1 Business overview
- 12.1.4.2 Products offered
- 12.1.4.3 Recent developments
- 12.1.4.3.1 Deals
- 12.1.4.4 MnM view
- 12.1.4.4.1 Key strengths/Right to win
- 12.1.4.4.2 Strategic choices
- 12.1.4.4.3 Weaknesses and competitive threats
- 12.1.5 ZIMMER BIOMET HOLDINGS, INC.
- 12.1.5.1 Business overview
- 12.1.5.2 Products offered
- 12.1.5.3 Recent development
- 12.1.5.3.1 Deals
- 12.1.5.4 MnM view
- 12.1.5.4.1 Key strengths/Right to win
- 12.1.5.4.2 Strategic choices
- 12.1.5.4.3 Weaknesses and competitive threats
- 12.1.6 BIRD & CRONIN, LLC (DYNATRONICS CORPORATION)
- 12.1.6.1 Business overview
- 12.1.6.2 Products offered
- 12.1.7 ENOVIS CORPORATION
- 12.1.7.1 Business overview
- 12.1.7.2 Products offered
- 12.1.8 OTTOBOCK
- 12.1.8.1 Business overview
- 12.1.8.2 Products offered
- 12.1.9 BAUERFEIND
- 12.1.9.1 Business overview
- 12.1.9.2 Products offered
- 12.1.10 BREG, INC
- 12.1.10.1 Business overview
- 12.1.10.2 Products offered
- 12.1.11 DEROYAL INDUSTRIES, INC.
- 12.1.11.1 Business overview
- 12.1.11.2 Products offered
- 12.1.12 ALCARE CO., LTD
- 12.1.12.1 Business overview
- 12.1.12.2 Products offered
- 12.1.13 NIPPON SIGMAX CO., LTD.
- 12.1.13.1 Business overview
- 12.1.13.2 Products offered
- 12.1.14 MEDI GMBH & CO. KG
- 12.1.14.1 Business overview
- 12.1.14.2 Products offered
- 12.1.15 TRULIFE
- 12.1.15.1 Business overview
- 12.1.15.2 Products offered
- 12.1.1 3M COMPANY
- 12.2 OTHER PLAYERS
- 12.2.1 FOUNDATION WELLNESS (FORMERLY KNOWN AS REMINGTON PRODUCTS COMPANY)
- 12.2.2 MCDAVID, INC. (A PART OF SHOCK DOCTOR)
- 12.2.3 MUELLER SPORTS MEDICINE, INC.
- 12.2.4 BECKER ORTHOPEDIC
- 12.2.5 ORLIMAN S.L.U (A PART OF MAGNUM INDUSTRIAL PARTNERS)
- 12.2.6 FRANK STUBBS COMPANY INC.
- 12.2.7 ASPEN MEDICAL PRODUCTS LLC
- 12.2.8 DARCO INTERNATIONAL, INC.
- 12.2.9 UNITED MEDICARE
- 12.2.10 VISSCO REHABILITATION AIDS PVT. LTD.
13 APPENDIX
- 13.1 DISCUSSION GUIDE
- 13.2 KNOWLEDGESTORE: MARKETSANDMARKETS' SUBSCRIPTION PORTAL
- 13.3 CUSTOMIZATION OPTIONS
- 13.4 RELATED REPORTS
- 13.5 AUTHOR DETAILS
List of Tables
- TABLE 1 ORTHOPEDIC BRACES & SUPPORTS MARKET: INCLUSIONS & EXCLUSIONS
- TABLE 2 NORTH AMERICA: LIST OF REGULATORY BODIES, GOVERNMENT AGENCIES, AND OTHER ORGANIZATIONS
- TABLE 3 EUROPE: LIST OF REGULATORY BODIES, GOVERNMENT AGENCIES, AND OTHER ORGANIZATIONS
- TABLE 4 ASIA PACIFIC: LIST OF REGULATORY BODIES, GOVERNMENT AGENCIES, AND OTHER ORGANIZATIONS
- TABLE 5 LATIN AMERICA: LIST OF REGULATORY BODIES, GOVERNMENT AGENCIES, AND OTHER ORGANIZATIONS
- TABLE 6 MIDDLE EAST & AFRICA: LIST OF REGULATORY BODIES, GOVERNMENT AGENCIES, AND OTHER ORGANIZATIONS
- TABLE 7 CPT CODES FOR VARIOUS PROCEDURES
- TABLE 8 ORTHOPEDIC BRACES & SUPPORTS MARKET: ROLE IN ECOSYSTEM
- TABLE 9 IMPORT SCENARIO FOR ORTHOPEDIC OR FRACTURE APPLIANCES (HS CODE 902110), BY COUNTRY, 2020-2024 (USD THOUSAND)
- TABLE 10 EXPORT SCENARIO FOR ORTHOPEDIC OR FRACTURE APPLIANCES (HS CODE 902110), BY COUNTRY, 2020-2024 (USD THOUSAND)
- TABLE 11 ORTHOPEDIC BRACES & SUPPORTS MARKET: INNOVATIONS AND PATENT REGISTRATIONS, 2022-2024
- TABLE 12 AVERAGE SELLING PRICE OF ORTHOPEDIC BRACES, BY KEY PLAYER, 2024 (USD)
- TABLE 13 AVERAGE SELLING PRICE OF ORTHOPEDIC BRACES, BY REGION, 2022-2024 (USD)
- TABLE 14 PORTER'S FIVE FORCES ANALYSIS: ORTHOPEDIC BRACES & SUPPORTS MARKET
- TABLE 15 INFLUENCE OF STAKEHOLDERS ON BUYING PROCESS FOR PRODUCT SEGMENTS
- TABLE 16 INFLUENCE OF STAKEHOLDERS ON BUYING PROCESS FOR DISTRIBUTION CHANNELS
- TABLE 17 LIST OF KEY CONFERENCES & EVENTS IN ORTHOPEDIC BRACES & SUPPORTS, JANUARY 2025-DECEMBER 2026
- TABLE 18 ORTHOPEDIC BRACES & SUPPORTS MARKET: LIST OF UNMET NEEDS
- TABLE 19 US ADJUSTED RECIPROCAL TARIFF RATES
- TABLE 20 ORTHOPEDIC BRACES & SUPPORTS MARKET, BY PRODUCT, 2023-2030 (USD MILLION)
- TABLE 21 ORTHOPEDIC KNEE BRACES & SUPPORTS MARKET, BY REGION, 2023-2030 (USD MILLION)
- TABLE 22 ORTHOPEDIC ANKLE BRACES & SUPPORTS MARKET, BY REGION, 2023-2030 (USD MILLION)
- TABLE 23 ORTHOPEDIC FOOT WALKER & ORTHOSES MARKET, BY REGION, 2023-2030 (USD MILLION)
- TABLE 24 ORTHOPEDIC BACK, HIP, AND SPINE BRACES & SUPPORTS MARKET, BY PRODUCT, 2023-2030 (USD MILLION)
- TABLE 25 ORTHOPEDIC BACK, HIP, AND SPINE BRACES & SUPPORTS MARKET, BY REGION, 2023-2030 (USD MILLION)
- TABLE 26 ORTHOPEDIC NECK AND CERVICAL BRACES & SUPPORTS MARKET, BY REGION, 2023-2030 (USD MILLION)
- TABLE 27 ORTHOPEDIC LOWER SPINE BRACES & SUPPORTS MARKET, BY REGION, 2023-2030 (USD MILLION)
- TABLE 28 ORTHOPEDIC SHOULDER BRACES & SUPPORTS MARKET, BY REGION, 2023-2030 (USD MILLION)
- TABLE 29 ORTHOPEDIC ELBOW BRACES & SUPPORTS MARKET, BY REGION, 2023-2030 (USD MILLION)
- TABLE 30 ORTHOPEDIC HAND & WRIST BRACES & SUPPORTS MARKET, BY REGION, 2023-2030 (USD MILLION)
- TABLE 31 ORTHOPEDIC FACIAL BRACES & SUPPORTS MARKET, BY REGION, 2023-2030 (USD MILLION)
- TABLE 32 ORTHOPEDIC BRACES & SUPPORTS MARKET, BY TYPE, 2023-2030 (USD MILLION)
- TABLE 33 SOFT AND ELASTIC BRACES & SUPPORTS MARKET, BY REGION, 2023-2030 (USD MILLION)
- TABLE 34 HARD BRACES & SUPPORTS MARKET, BY REGION, 2023-2030 (USD MILLION)
- TABLE 35 HINGED BRACES & SUPPORTS MARKET, BY REGION, 2023-2030 (USD MILLION)
- TABLE 36 ORTHOPEDIC BRACES & SUPPORTS MARKET, BY APPLICATION, 2023-2030 (USD MILLION)
- TABLE 37 ORTHOPEDIC BRACES & SUPPORTS MARKET FOR PREVENTIVE CARE, BY REGION, 2023-2030 (USD MILLION)
- TABLE 38 ORTHOPEDIC BRACES & SUPPORTS MARKET FOR LIGAMENT INJURY, BY REGION, 2023-2030 (USD MILLION)
- TABLE 39 ORTHOPEDIC BRACES & SUPPORTS MARKET FOR ANTERIOR CRUCIATE LIGAMENT (ACL) INJURY, BY REGION, 2023-2030 (USD MILLION)
- TABLE 40 ORTHOPEDIC BRACES & SUPPORTS MARKET FOR LATERAL COLLATERAL LIGAMENT INJURY, BY REGION, 2023-2030 (USD MILLION)
- TABLE 41 ORTHOPEDIC BRACES & SUPPORTS MARKET FOR OTHER LIGAMENT INJURY, BY REGION, 2023-2030 (USD MILLION)
- TABLE 42 ORTHOPEDIC BRACES & SUPPORTS MARKET FOR POST-OPERATIVE REHABILITATION, BY REGION, 2023-2030 (USD MILLION)
- TABLE 43 ORTHOPEDIC BRACES & SUPPORTS MARKET FOR BONE MARROW BIOPSY, BY REGION, 2023-2030 (USD MILLION)
- TABLE 44 ORTHOPEDIC BRACES & SUPPORTS MARKET FOR COMPRESSION THERAPY, BY REGION, 2023-2030 (USD MILLION)
- TABLE 45 ORTHOPEDIC BRACES & SUPPORTS MARKET FOR FRACTURE MANAGEMENT, BY REGION, 2023-2030 (USD MILLION)
- TABLE 46 ORTHOPEDIC BRACES & SUPPORTS MARKET FOR OTHER APPLICATIONS, BY REGION, 2023-2030 (USD MILLION)
- TABLE 47 ORTHOPEDIC BRACES & SUPPORTS MARKET, BY DISTRIBUTION CHANNEL, 2023-2030 (USD MILLION)
- TABLE 48 ORTHOPEDIC BRACES & SUPPORTS MARKET FOR HOSPITALS & SURGICAL CENTERS, BY REGION, 2023-2030 (USD MILLION)
- TABLE 49 ORTHOPEDIC BRACES & SUPPORTS MARKET FOR ORTHOPEDIC CLINICS, BY REGION, 2023-2030 (USD MILLION)
- TABLE 50 ORTHOPEDIC BRACES & SUPPORTS MARKET FOR PHARMACIES & RETAILERS, BY REGION, 2023-2030 (USD MILLION)
- TABLE 51 ORTHOPEDIC BRACES & SUPPORTS MARKET FOR E-COMMERCE PLATFORMS, BY REGION, 2023-2030 (USD MILLION)
- TABLE 52 ORTHOPEDIC BRACES & SUPPORTS MARKET FOR DME DEALERS, BY REGION, 2023-2030 (USD MILLION)
- TABLE 53 ORTHOPEDIC BRACES & SUPPORTS MARKET FOR OTHER END USERS, BY REGION, 2023-2030 (USD MILLION)
- TABLE 54 ORTHOPEDIC BRACES & SUPPORTS MARKET, BY REGION, 2023-2030 (USD MILLION)
- TABLE 55 NORTH AMERICA: MACROECONOMIC OUTLOOK
- TABLE 56 NORTH AMERICA: ORTHOPEDIC BRACES & SUPPORTS MARKET, BY COUNTRY, 2023-2030 (USD MILLION)
- TABLE 57 NORTH AMERICA: ORTHOPEDIC BRACES & SUPPORTS MARKET, BY PRODUCT, 2023-2030 (USD MILLION)
- TABLE 58 NORTH AMERICA: ORTHOPEDIC BRACES & SUPPORTS MARKET, BY TYPE, 2023-2030 (USD MILLION)
- TABLE 59 NORTH AMERICA: ORTHOPEDIC BRACES & SUPPORTS MARKET, BY APPLICATION, 2023-2030 (USD MILLION)
- TABLE 60 NORTH AMERICA: ORTHOPEDIC BRACES & SUPPORTS MARKET, BY DISTRIBUTION CHANNEL, 2023-2030 (USD MILLION)
- TABLE 61 US: ORTHOPEDIC BRACES & SUPPORTS MARKET, BY PRODUCT, 2023-2030 (USD MILLION)
- TABLE 62 US: ORTHOPEDIC BACK, HIP, AND SPINE BRACES & SUPPORTS MARKET, BY PRODUCT, 2023-2030 (USD MILLION)
- TABLE 63 CANADA: ORTHOPEDIC BRACES & SUPPORTS MARKET, BY PRODUCT, 2023-2030 (USD MILLION)
- TABLE 64 CANADA: ORTHOPEDIC BACK, HIP, AND SPINE BRACES & SUPPORTS MARKET, BY PRODUCT, 2023-2030 (USD MILLION)
- TABLE 65 EUROPE: MACROECONOMIC OUTLOOK
- TABLE 66 EUROPE: ORTHOPEDIC BRACES & SUPPORTS MARKET, BY COUNTRY, 2023-2030 (USD MILLION)
- TABLE 67 EUROPE: ORTHOPEDIC BRACES & SUPPORTS MARKET, BY PRODUCT, 2023-2030 (USD MILLION)
- TABLE 68 EUROPE: ORTHOPEDIC BRACES & SUPPORTS MARKET, BY TYPE, 2023-2030 (USD MILLION)
- TABLE 69 EUROPE: ORTHOPEDIC BRACES & SUPPORTS MARKET, BY APPLICATION, 2023-2030 (USD MILLION)
- TABLE 70 EUROPE: ORTHOPEDIC BRACES & SUPPORTS MARKET, BY DISTRIBUTION CHANNEL, 2023-2030 (USD MILLION)
- TABLE 71 GERMANY: ORTHOPEDIC BRACES & SUPPORTS MARKET, BY PRODUCT, 2023-2030 (USD MILLION)
- TABLE 72 GERMANY: ORTHOPEDIC BACK, HIP, AND SPINE BRACES & SUPPORTS MARKET, BY PRODUCT, 2023-2030 (USD MILLION)
- TABLE 73 UK: ORTHOPEDIC BRACES & SUPPORTS MARKET, BY PRODUCT, 2023-2030 (USD MILLION)
- TABLE 74 UK: ORTHOPEDIC BACK, HIP, AND SPINE BRACES & SUPPORTS MARKET, BY PRODUCT, 2023-2030 (USD MILLION)
- TABLE 75 FRANCE: ORTHOPEDIC BRACES & SUPPORTS MARKET, BY PRODUCT, 2023-2030 (USD MILLION)
- TABLE 76 FRANCE: ORTHOPEDIC BACK, HIP, AND SPINE BRACES & SUPPORTS MARKET, BY PRODUCT, 2023-2030 (USD MILLION)
- TABLE 77 ITALY: ORTHOPEDIC BRACES & SUPPORTS MARKET, BY PRODUCT, 2023-2030 (USD MILLION)
- TABLE 78 ITALY: ORTHOPEDIC BACK, HIP, AND SPINE BRACES & SUPPORTS MARKET, BY PRODUCT, 2023-2030 (USD MILLION)
- TABLE 79 SPAIN: ORTHOPEDIC BRACES & SUPPORTS MARKET, BY PRODUCT, 2023-2030 (USD MILLION)
- TABLE 80 SPAIN: ORTHOPEDIC BACK, HIP, AND SPINE BRACES & SUPPORTS MARKET, BY PRODUCT, 2023-2030 (USD MILLION)
- TABLE 81 REST OF EUROPE: ORTHOPEDIC BRACES & SUPPORTS MARKET, BY PRODUCT, 2023-2030 (USD MILLION)
- TABLE 82 REST OF EUROPE: ORTHOPEDIC BACK, HIP, AND SPINE BRACES & SUPPORTS MARKET, BY PRODUCT, 2023-2030 (USD MILLION)
- TABLE 83 ASIA PACIFIC: MACROECONOMIC INDICATORS
- TABLE 84 ASIA PACIFIC: ORTHOPEDIC BRACES & SUPPORTS MARKET, BY COUNTRY, 2023-2030 (USD MILLION)
- TABLE 85 ASIA PACIFIC: ORTHOPEDIC BRACES & SUPPORTS MARKET, BY PRODUCT, 2023-2030 (USD MILLION)
- TABLE 86 ASIA PACIFIC: ORTHOPEDIC BRACES & SUPPORTS MARKET, BY TYPE, 2023-2030 (USD MILLION)
- TABLE 87 ASIA PACIFIC: ORTHOPEDIC BRACES & SUPPORTS MARKET, BY APPLICATION, 2023-2030 (USD MILLION)
- TABLE 88 ASIA PACIFIC: ORTHOPEDIC BRACES & SUPPORTS MARKET, BY DISTRIBUTION CHANNEL, 2023-2030 (USD MILLION)
- TABLE 89 CHINA: ORTHOPEDIC BRACES & SUPPORTS MARKET, BY PRODUCT, 2023-2030 (USD MILLION)
- TABLE 90 CHINA: ORTHOPEDIC BACK, HIP, AND SPINE BRACES & SUPPORTS MARKET, BY PRODUCT, 2023-2030 (USD MILLION)
- TABLE 91 JAPAN: ORTHOPEDIC BRACES & SUPPORTS MARKET, BY PRODUCT, 2023-2030 (USD MILLION)
- TABLE 92 JAPAN: ORTHOPEDIC BACK, HIP, AND SPINE BRACES & SUPPORTS MARKET, BY PRODUCT, 2023-2030 (USD MILLION)
- TABLE 93 INDIA: ORTHOPEDIC BRACES & SUPPORTS MARKET, BY PRODUCT, 2023-2030 (USD MILLION)
- TABLE 94 INDIA: ORTHOPEDIC BACK, HIP, AND SPINE BRACES & SUPPORTS MARKET, BY PRODUCT, 2023-2030 (USD MILLION)
- TABLE 95 AUSTRALIA: ORTHOPEDIC BRACES & SUPPORTS MARKET, BY PRODUCT, 2023-2030 (USD MILLION)
- TABLE 96 AUSTRALIA: ORTHOPEDIC BACK, HIP, AND SPINE BRACES & SUPPORTS MARKET, BY PRODUCT, 2023-2030 (USD MILLION)
- TABLE 97 SOUTH KOREA: ORTHOPEDIC BRACES & SUPPORTS MARKET, BY PRODUCT, 2023-2030 (USD MILLION)
- TABLE 98 SOUTH KOREA: ORTHOPEDIC BACK, HIP, AND SPINE BRACES & SUPPORTS MARKET, BY PRODUCT, 2023-2030 (USD MILLION)
- TABLE 99 REST OF ASIA PACIFIC: ORTHOPEDIC BRACES & SUPPORTS MARKET, BY PRODUCT, 2023-2030 (USD MILLION)
- TABLE 100 REST OF ASIA PACIFIC: ORTHOPEDIC BACK, HIP, AND SPINE BRACES & SUPPORTS MARKET, BY PRODUCT, 2023-2030 (USD MILLION)
- TABLE 101 LATIN AMERICA: MACROECONOMIC OUTLOOK
- TABLE 102 LATIN AMERICA: ORTHOPEDIC BRACES & SUPPORTS MARKET, BY COUNTRY, 2023-2030 (USD MILLION)
- TABLE 103 LATIN AMERICA: ORTHOPEDIC BRACES & SUPPORTS MARKET, BY PRODUCT, 2023-2030 (USD MILLION)
- TABLE 104 LATIN AMERICA: ORTHOPEDIC BRACES & SUPPORTS MARKET, BY TYPE, 2023-2030 (USD MILLION)
- TABLE 105 LATIN AMERICA: ORTHOPEDIC BRACES & SUPPORTS MARKET, BY APPLICATION, 2023-2030 (USD MILLION)
- TABLE 106 LATIN AMERICA: ORTHOPEDIC BRACES & SUPPORTS MARKET, BY DISTRIBUTION CHANNEL, 2023-2030 (USD MILLION)
- TABLE 107 BRAZIL: ORTHOPEDIC BRACES & SUPPORTS MARKET, BY PRODUCT, 2023-2030 (USD MILLION)
- TABLE 108 BRAZIL: ORTHOPEDIC BACK, HIP, AND SPINE BRACES & SUPPORTS MARKET, BY PRODUCT, 2023-2030 (USD MILLION)
- TABLE 109 MEXICO: ORTHOPEDIC BRACES & SUPPORTS MARKET, BY PRODUCT, 2023-2030 (USD MILLION)
- TABLE 110 MEXICO: ORTHOPEDIC BACK, HIP, AND SPINE BRACES & SUPPORTS MARKET, BY PRODUCT, 2023-2030 (USD MILLION)
- TABLE 111 REST OF LATIN AMERICA: ORTHOPEDIC BRACES & SUPPORTS MARKET, BY PRODUCT, 2023-2030 (USD MILLION)
- TABLE 112 REST OF LATIN AMERICA: ORTHOPEDIC BACK, HIP, AND SPINE BRACES & SUPPORTS MARKET, BY PRODUCT, 2023-2030 (USD MILLION)
- TABLE 113 MIDDLE EAST & AFRICA: MACROECONOMIC OUTLOOK
- TABLE 114 MIDDLE EAST & AFRICA: ORTHOPEDIC BRACES & SUPPORTS MARKET, BY COUNTRY, 2023-2030 (USD MILLION)
- TABLE 115 MIDDLE EAST & AFRICA: ORTHOPEDIC BRACES & SUPPORTS MARKET, BY PRODUCT, 2023-2030 (USD MILLION)
- TABLE 116 MIDDLE EAST & AFRICA: ORTHOPEDIC BRACES & SUPPORTS MARKET, BY TYPE, 2023-2030 (USD MILLION)
- TABLE 117 MIDDLE EAST & AFRICA: ORTHOPEDIC BRACES & SUPPORTS MARKET, BY APPLICATION, 2023-2030 (USD MILLION)
- TABLE 118 MIDDLE EAST & AFRICA: ORTHOPEDIC BRACES & SUPPORTS MARKET, BY DISTRIBUTION CHANNEL, 2023-2030 (USD MILLION)
- TABLE 119 GCC COUNTRIES: ORTHOPEDIC BRACES & SUPPORTS MARKET, BY PRODUCT, 2023-2030 (USD MILLION)
- TABLE 120 GCC COUNTRIES: ORTHOPEDIC BACK, HIP, AND SPINE BRACES & SUPPORTS MARKET, BY PRODUCT, 2023-2030 (USD MILLION)
- TABLE 121 ROMEA: ORTHOPEDIC BRACES & SUPPORTS MARKET, BY PRODUCT, 2023-2030 (USD MILLION)
- TABLE 122 ROMEA: ORTHOPEDIC BACK, HIP, AND SPINE BRACES & SUPPORTS MARKET, BY PRODUCT, 2023-2030 (USD MILLION)
- TABLE 123 OVERVIEW OF STRATEGIES ADOPTED BY PLAYERS IN ORTHOPEDIC BRACE & SUPPORTS MARKET
- TABLE 124 ORTHOPEDIC BRACES & SUPPORTS MARKET: DEGREE OF COMPETITION
- TABLE 125 ORTHOPEDIC BRACE & SUPPORTS MARKET: PRODUCT FOOTPRINT, 2024
- TABLE 126 ORTHOPEDIC BRACES & SUPPORTS MARKET: REGIONAL FOOTPRINT, 2024
- TABLE 127 ORTHOPEDIC BRACES & SUPPORTS MARKET: TYPE FOOTPRINT, 2024
- TABLE 128 ORTHOPEDIC BRACES & SUPPORTS: APPLICATION FOOTPRINT, 2024
- TABLE 129 ORTHOPEDIC BRACES & SUPPORTS: DISTRIBUTION CHANNEL FOOTPRINT, 2024
- TABLE 130 ORTHOPEDIC BRACES & SUPPORT MARKET: DETAILED LIST OF KEY STARTUPS/SMES, 2024
- TABLE 131 ORTHOPEDIC BRACES & SUPPORTS MARKET: COMPETITIVE BENCHMARKING OF KEY STARTUPS/SMES BY PRODUCT TYPE, 2024
- TABLE 132 ORTHOPEDIC BRACES & SUPPORTS MARKET: COMPETITIVE BENCHMARKING OF KEY STARTUPS/SMES BY REGION, 2024
- TABLE 133 ORTHOPEDIC BRACES & SUPPORTS MARKET: PRODUCT LAUNCHES AND APPROVALS, JANUARY 2021-MARCH 2024
- TABLE 134 ORTHOPEDIC BRACES & SUPPORTS MARKET: DEALS, JANUARY 2021-MAY 2024
- TABLE 135 3M COMPANY: COMPANY OVERVIEW
- TABLE 136 3M COMPANY: PRODUCTS OFFERED
- TABLE 137 ESSITY HEALTH & MEDICAL: COMPANY OVERVIEW
- TABLE 138 ESSITY HEALTH & MEDICAL: PRODUCTS OFFERED
- TABLE 139 ESSITY HEALTH & MEDICAL: DEALS
- TABLE 140 OSSUR: COMPANY OVERVIEW
- TABLE 141 OSSUR: PRODUCTS OFFERED
- TABLE 142 OSSUR: PRODUCT LAUNCHES AND APPROVALS
- TABLE 143 OSSUR: DEALS
- TABLE 144 THUASNE: COMPANY OVERVIEW
- TABLE 145 THUASNE: PRODUCTS OFFERED
- TABLE 146 THUASNE: DEALS
- TABLE 147 ZIMMER BIOMET HOLDINGS, INC.: COMPANY OVERVIEW
- TABLE 148 ZIMMER BIOMET HOLDINGS, INC.: PRODUCTS OFFERED
- TABLE 149 ZIMMER BIOMET HOLDINGS, INC.: DEALS
- TABLE 150 DYNATRONICS CORPORATION: COMPANY OVERVIEW
- TABLE 151 BIRD & CRONIN LLC: PRODUCTS OFFERED
- TABLE 152 ENOVIS CORPORATION: COMPANY OVERVIEW
- TABLE 153 ENOVIS CORPORATION: PRODUCTS OFFERED
- TABLE 154 OTTOBOCK: COMPANY OVERVIEW
- TABLE 155 OTTOBOCK: PRODUCTS OFFERED
- TABLE 156 BAUERFEIND: COMPANY OVERVIEW
- TABLE 157 BAUERFEIND: PRODUCTS OFFERED
- TABLE 158 BREG, INC.: COMPANY OVERVIEW
- TABLE 159 BREG, INC.: PRODUCTS OFFERED
- TABLE 160 DEROYAL INDUSTRIES, INC.: COMPANY OVERVIEW
- TABLE 161 DEROYAL INDUSTRIES, INC.: PRODUCTS OFFERED
- TABLE 162 ALCARE CO., LTD.: COMPANY OVERVIEW
- TABLE 163 ALCARE CO., LTD.: PRODUCTS OFFERED
- TABLE 164 NIPPON SIGMAX CO., LTD.: COMPANY OVERVIEW
- TABLE 165 NIPPON SIGMAX CO., LTD.: PRODUCTS OFFERED
- TABLE 166 MEDI GMBH & CO KG: COMPANY OVERVIEW
- TABLE 167 MEDI GMBH & CO KG: PRODUCTS OFFERED
- TABLE 168 TRULIFE: COMPANY OVERVIEW
- TABLE 169 TRULIFE: PRODUCTS OFFERED
List of Figures
- FIGURE 1 ORTHOPEDIC BRACES & SUPPORTS MARKET SEGMENTATION AND REGIONAL SCOPE
- FIGURE 2 STUDY PERIOD CONSIDERED
- FIGURE 3 ORTHOPEDIC BRACES & SUPPORTS MARKET: RESEARCH DESIGN METHODOLOGY
- FIGURE 4 PRIMARY SOURCES LIST OF KEY PRIMARY STAKEHOLDERS INTERVIEWED
- FIGURE 5 KEY INDUSTRY INSIGHTS
- FIGURE 6 BREAKDOWN OF PRIMARY INTERVIEWS: SUPPLY-SIDE AND DEMAND-SIDE PARTICIPANTS
- FIGURE 7 BREAKDOWN OF PRIMARY INTERVIEWS, BY COMPANY TYPE, DESIGNATION, AND REGION
- FIGURE 8 RESEARCH METHODOLOGY: HYPOTHESIS BUILDING
- FIGURE 9 MARKET SIZE ESTIMATION FOR ORTHOPEDIC BRACES & SUPPORTS MARKET: APPROACH 1 (COMPANY REVENUE ESTIMATION)
- FIGURE 10 BOTTOM-UP APPROACH FOR MARKET SIZE ESTIMATION: ORTHOPEDIC BRACES & SUPPORTS MARKET
- FIGURE 11 CAGR PROJECTIONS ANALYSIS
- FIGURE 12 DATA TRIANGULATION METHODOLOGY
- FIGURE 13 ORTHOPEDIC BRACES & SUPPORTS MARKET, BY PRODUCT, 2025 VS. 2030 (USD MILLION)
- FIGURE 14 ORTHOPEDIC BRACES & SUPPORTS MARKET, BY TYPE, 2025 VS. 2030 (USD MILLION)
- FIGURE 15 ORTHOPEDIC BRACES & SUPPORTS MARKET, BY APPLICATION, 2025 VS. 2030 (USD MILLION)
- FIGURE 16 ORTHOPEDIC BRACES & SUPPORTS MARKET, BY DISTRIBUTION CHANNEL, 2025 VS. 2030 (USD MILLION)
- FIGURE 17 GEOGRAPHIC SNAPSHOT OF ORTHOPEDIC BRACES & SUPPORTS MARKET
- FIGURE 18 GREATER SALES TRACTION VIA DIGITAL PLATFORMS AND HIGHER MARKET ACCESS TO FUEL DEMAND FOR ORTHOPEDIC BRACES & SUPPORTS
- FIGURE 19 CHINA TO REGISTER HIGHEST CAGR DURING FORECAST PERIOD
- FIGURE 20 DRIVERS, RESTRAINTS, OPPORTUNITIES, AND CHALLENGES IN ORTHOPEDIC BRACES & SUPPORTS MARKET
- FIGURE 21 ORTHOPEDIC BRACES & SUPPORTS MARKET: VALUE CHAIN ANALYSIS
- FIGURE 22 ORTHOPEDIC BRACES & SUPPORTS MARKET: SUPPLY CHAIN ANALYSIS
- FIGURE 23 ORTHOPEDIC BRACES & SUPPORTS MARKET: ECOSYSTEM MARKET MAP
- FIGURE 24 IMPORT SCENARIO FOR ORTHOPEDIC OR FRACTURE APPLIANCES (HS CODE 902110), BY COUNTRY, 2020-2024 (USD THOUSAND)
- FIGURE 25 EXPORT SCENARIO FOR ORTHOPEDIC OR FRACTURE APPLIANCES (HS CODE 902110), BY COUNTRY, 2020-2024 (USD THOUSAND)
- FIGURE 26 PATENT DETAILS FOR ORTHOPEDIC BRACES & SUPPORTS MARKET, JANUARY 2014-JUNE 2025
- FIGURE 27 AVERAGE SELLING PRICE TREND OF ORTHOPEDIC BRACES, BY PRODUCT, 2024 (USD)
- FIGURE 28 AVERAGE SELLING PRICE TREND OF ORTHOPEDIC BRACES, BY REGION, 2022-2024 (USD)
- FIGURE 29 ORTHOPEDIC BRACES & SUPPORTS MARKET: PORTER'S FIVE FORCES ANALYSIS
- FIGURE 30 INFLUENCE OF STAKEHOLDERS ON BUYING PROCESS, BY PRODUCT
- FIGURE 31 KEY BUYING CRITERIA FOR DISTRIBUTION CHANNELS
- FIGURE 32 TRENDS/DISRUPTIONS IMPACTING CUSTOMERS' BUSINESSES
- FIGURE 33 INVESTMENTS AND FUNDING SCENARIO, 2019-2023 (USD MILLION)
- FIGURE 34 NUMBER OF DEALS IN MARKET, BY KEY PLAYER, 2019-2023
- FIGURE 35 VALUE OF DEALS IN MARKET, BY KEY PLAYER, 2019-2023 (USD)
- FIGURE 36 AI USE CASES
- FIGURE 37 NORTH AMERICA: ORTHOPEDIC BRACES & SUPPORTS MARKET SNAPSHOT
- FIGURE 38 ASIA PACIFIC: ORTHOPEDIC BRACES & SUPPORTS MARKET SNAPSHOT
- FIGURE 39 REVENUE ANALYSIS OF TOP FIVE PLAYERS IN ORTHOPEDIC BRACES & SUPPORTS MARKET, 2022-2024 (USD MILLION)
- FIGURE 40 MARKET SHARE ANALYSIS OF KEY PLAYERS IN ORTHOPEDIC BRACES & SUPPORTS, 2024
- FIGURE 41 RANKING OF KEY PLAYERS IN ORTHOPEDIC BRACES & SUPPORTS MARKET FOR TOTAL MARKET, 2024
- FIGURE 42 ORTHOPEDIC BRACES & SUPPORTS MARKET: COMPANY EVALUATION MATRIX (KEY PLAYERS), 2024
- FIGURE 43 ORTHOPEDIC BRACES & SUPPORTS MARKET: COMPANY FOOTPRINT, 2024
- FIGURE 44 ORTHOPEDIC BRACES & SUPPORTS MARKET: COMPANY EVALUATION MATRIX (STARTUPS/SMES), 2024
- FIGURE 45 EV/EBITDA OF KEY VENDORS, 2025
- FIGURE 46 YEAR-TO-DATE (YTD) PRICE TOTAL RETURN AND 5-YEAR STOCK BETA OF KEY VENDORS, 2025
- FIGURE 47 ORTHOPEDIC BRACES & SUPPORTS MARKET: BRAND/PRODUCT COMPARISON
- FIGURE 48 3M COMPANY: COMPANY SNAPSHOT, 2024
- FIGURE 49 ESSITY HEALTH & MEDICAL: COMPANY SNAPSHOT, 2024
- FIGURE 50 OSSUR: COMPANY SNAPSHOT, 2024
- FIGURE 51 ZIMMER BIOMET HOLDINGS, INC.: COMPANY SNAPSHOT (2024)
- FIGURE 52 DYNATRONICS CORPORATION: COMPANY SNAPSHOT (2024)
- FIGURE 53 ENOVIS CORPORATION: COMPANY SNAPSHOT (2024)
 整形外科矫正器具和支援市场:2026-2032年全球市场预测(按产品类型、材料、年龄层、活动能力、销售管道和应用划分)背部和肩部支援市场:按产品类型、分销管道、应用、材料和最终用户划分-2026-2032年全球市场预测
 2026年全球整形外科支架、支撑装置及设备市场报告
 全球整形外科矫正器具及支架市场规模、份额、趋势及成长分析报告(2026-2034)全球整形外科矫正器具市场规模、份额、趋势和成长分析报告(2026-2034)
 整形外科矫正器具和支撑产品市场规模、份额、趋势和预测(按产品、类型、应用、最终用户和地区划分),2026-2034年3D列印下肢矫正器市场:按产品类型、材料类型、技术、分销管道、应用和最终用户划分,全球预测(2026-2032年)整形外科矫正器具、支撑、石膏和夹板市场(按产品类型、解剖位置、临床应用和最终用户划分)—2026-2032年全球预测行动按摩市场:按服务类型、价格范围、订阅模式、治疗时间、客户类型和预约管道划分,全球预测,2026-2032年日本整形外科矫正器具及支撑产品市场规模、份额、趋势及预测(按产品、类型、应用、最终用户和地区划分,2026-2034年)