


 |
市场调查报告书
商品编码
1808971
全球光电市场按产品类型、波长、应用、材料、最终用途产业和地区划分-预测至 2030 年Photonics Market by Product Type (LED), Wavelength (Infrared, Visible), Material (Silicon, Glass), Application (Information & Communication Technology), End-use Industry (Industrial, Media & Telecommunication), & Region - Global Forecast to 2030 |
||||||
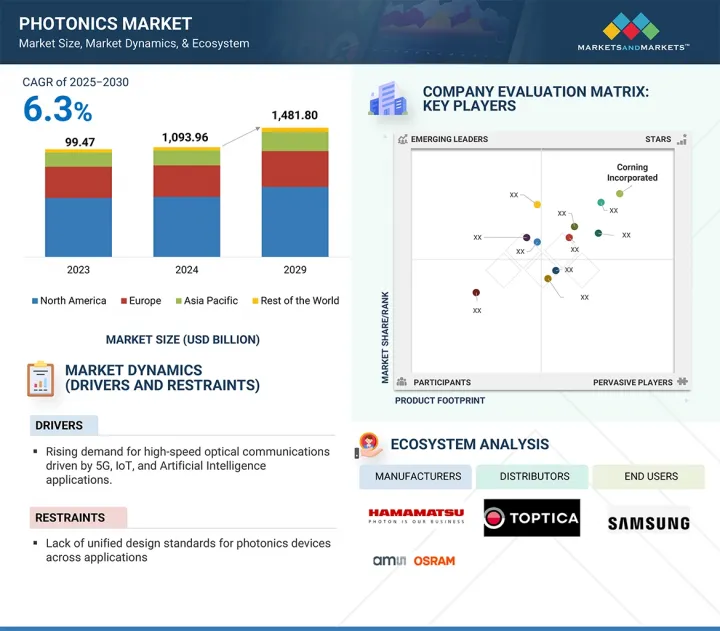
光电市场预计将从 2025 年的 1,9,396 亿美元成长到 2030 年的 1,4,818 亿美元,预测期内的复合年增长率为 6.3%。
光电市场受到高频宽通讯解决方案日益增长的需求驱动,尤其是5G技术、云端运算和物联网(IoT)通讯协定的兴起。这些进步需要能够提高资料传输速度的光纤和收发器。
| 调查范围 | |
|---|---|
| 调查年份 | 2021-2030 |
| 基准年 | 2024 |
| 预测期 | 2025-2030 |
| 对价单位 | 金额(百万美元/十亿美元) |
| 部分 | 按产品类型、波长、应用、材料、最终用途行业和地区 |
| 目标区域 | 北美、欧洲、中东/非洲、南美 |
在工业製造领域,雷射和光学感测器正在提高切割、焊接和品管流程的精度,促进自动化组装的兴起,并推动工业4.0的蓬勃发展。在医疗保健领域,红外光谱和生医光电等非侵入式诊断技术的日益普及,正在刺激市场成长,以应对老龄化社会。此外,在家用电子电器领域,智慧型手机、扩增实境(AR) 和虚拟实境 (VR) 装置等产品的需求旺盛。这种需求推动了对可见光波长LED和MicroLED显示器的需求。
预计在预测期内,侦测器、感测器和成像设备领域将成为光电市场中成长最快的领域。这一增长得益于它们在汽车、医疗保健、消费电子、国防和工业自动化等多个高成长产业的广泛应用。高精度智慧系统对光电感测器的日益依赖,推动了各种应用对即时数据采集的需求。例如,在汽车领域,高级驾驶辅助系统 (ADAS) 和全自动驾驶汽车的出现显着增加了雷射雷达 (LiDAR) 系统、红外线检测器和 3D 成像感测器的产量。这些技术依靠光电来探测障碍物、扫描地形并增强各种天气条件下的安全性。在医疗保健领域,光学相干断层扫描 (OCT)、萤光成像和生医光电感测器等光子影像设备能够比以往更早、更准确地诊断疾病。使用近红外线 (NIR) 和可见光模式进行非侵入性成像和即时监测已成为外科手术和诊断中照护现场环境中必不可少的技术。随着全球人口老化和慢性病的增加,对先进诊断能力的需求预计将会成长。
玻璃凭藉其优异的光学性能、化学耐久性以及在广泛应用领域的多功能性,成为光电市场中成长最快的材料领域。这种成长主要得益于其在光纤製造中的应用,而光纤正是高速网路服务、5G 网路和远距资料传输基础设施的基础。随着全球资料传输和云端运算的持续快速扩张,电信业者在光纤网路上投入巨资,这得益于硅基玻璃的低光衰减和高传输效率。此外,玻璃越来越多地被用于高性能透镜、基板、棱镜和波导管,用于成像(眼科)、感测(光子)和雷射应用。特殊玻璃,如硼硅酸、石英玻璃和硫系玻璃,具有多种光学性能,包括耐高温、紫外线和红外线渗透性以及低色散,使其适用于各种专业应用,包括航太、国防、医疗保健和工业雷射。随着诊断影像系统和手术器械等高精度医疗设备,玻璃零件的广泛应用也日益普及。玻璃的生物相容性和尺寸稳定性使其对製造商日益重要。
可见光波长段预计将成为光电市场中成长最快的部分,因为它具有广泛的应用范围,包括成像、显示、照明和家用电子电器。可见光的波长约为 400 至 700 奈米,是促进人机互动最相关的频谱,并且易于整合到人们日常生活中使用的所有应用技术中。 OLED、microLED 和量子点显示器正在推动手机、电视、显示器和 AR/VR 显示器的发展。对这些显示器技术的既定需求正在推动可见光光子学的应用。韩国、中国和日本等拥有先进电子和显示器市场的国家的公司正在大力投资可见光光子光电以用于新的显示技术。固态照明 (SSL)计划,包括 LED(主要影响可见光和公共红外线光),也是一个主要的成长动力,因为政府要求在商业、住宅和公共基础设施项目中实施固体效率指标并大规模部署 LED。
受节能照明光源日益普及、都市化加快以及全球碳中和目标的推动,照明已成为光电市场中成长最快的应用领域。从传统白炽灯和萤光转向固体照明(SSL),尤其是发光二极体(LED)和有机发光二极体(OLED)的转变,正推动对光电技术的巨大需求。与传统技术相比,光子技术具有更高的发光效率、更长的使用寿命和更低的能耗,使其成为商业、住宅、工业和公共基础设施应用的可行解决方案。亚太地区、欧洲和北美各国政府正在颁布严格的能源效率法规和补贴/授权,以鼓励采用基于 LED 的照明解决方案,从而进一步影响预期的市场成长。采用基于光电的控制和感测器的现实捕捉智慧照明系统在智慧家庭和智慧城市中越来越受欢迎,其消费量也越来越大。这些智慧照明系统利用基于光电的组件,例如光感测器、检测器和控制设备,根据占用情况和环境动态调整亮度和色温。
媒体和通讯领域是光电市场中成长最快的终端应用领域,这主要得益于对长距离高速资料传输、5G 基础设施和先进光纤通讯系统日益增长的需求。光电技术,尤其是光纤技术和光收发器,是一种尖端的通讯解决方案,它使当今的通讯网路能够以更快、更安全、更大的频宽、更少的损耗和远距运作。随着全球网路使用量的增加,资料流量速度和容量也在增加,电讯目前正从铜缆基础设施迁移到光纤网路。这种转变对通讯光子元件的需求庞大。 5G 商用网路的发展以及预期向 6G 的扩展也将需要光子解决方案来适应连接到网路的越来越多的设备。扩增实境(AR)、虚拟实境 (VR) 和云端处理等应用,以及串流内容设备数量的增加和延迟要求的提高,将需要更高频宽和更低延迟的通讯基础架构。光子积体电路 (PIC)、雷射和光电探测器正被整合到尖端资料中心和无线通讯枢纽中,以满足未来的频宽和延迟需求。分波多工(WDM) 和连贯光系统的新发展显着提高了光纤通讯系统的效率,进一步增加了媒体和通讯领域对光子技术的需求。
本报告研究了全球光电市场,并提供了按产品类型、波长、应用、材料、最终用途行业和地区分類的趋势信息,以及参与市场的公司概况。
目录
第一章 引言
第二章调查方法
第三章执行摘要
第四章重要考察
第五章市场概述
- 介绍
- 市场动态
- 生成式人工智慧对光电市场的影响
第六章 产业趋势
- 介绍
- 影响客户业务的趋势/中断
- 价值链分析
- 投资金筹措场景
- 生态系分析
- 定价分析
- 技术分析
- 专利分析
- 贸易分析
- 2024-2025年重要会议和活动
- 关税和监管状况
- 波特五力分析
- 主要相关人员和采购标准
- 宏观经济展望
- 案例研究分析
第七章光电市场(依产品类型)
- 介绍
- 光源
- 雷射和雷射系统
- 检测器、感测器和成像设备
- 光纤通讯与网路
- 光学元件和系统
- 光电子学和积体光子电路
第 8 章光电市场(依波长)
- 介绍
- 紫外线
- 可见的
- 红外线的
第九章光电市场(按应用)
- 介绍
- 展示
- 资讯和通讯技术
- 太阳能发电
- 医疗技术与生命科学
- 测量和自动化视觉
- 照明
- 其他的
第 10 章光电市场(按材料)
- 介绍
- 硅
- 玻璃
- 磷化铟(INP)
- 砷化镓
- 氮化镓
- 铌酸锂
- 其他的
第 11 章光电市场(依最终用途产业)
- 介绍
- 建造
- 媒体与通讯
- 医疗保健
- 安全和国防
- 工业
- 其他的
第十二章光电市场(按地区)
- 介绍
- 亚太地区
- 中国
- 日本
- 印度
- 韩国
- 台湾
- 其他的
- 北美洲
- 美国
- 加拿大
- 墨西哥
- 欧洲
- 德国
- 义大利
- 法国
- 英国
- 荷兰
- 其他的
- 其他地区
- 沙乌地阿拉伯
- 阿拉伯聯合大公国
- 阿曼
- 埃及
- 南非
- 其他的
第十三章竞争格局
- 介绍
- 主要参与企业的策略/优势
- 市场占有率分析
- 收益分析
- 品牌/产品比较
- 公司估值矩阵:2024 年关键参与企业
- 公司估值矩阵:Start-Ups/中小企业,2024 年
- 2024 年估值与财务指标
- 竞争场景
第十四章:公司简介
- 主要参与企业
- THORALABS, INC.
- AMS-OSRAM
- HAMAMATSU PHOTONICS KK
- LUMENTUM OPERATIONS LLC
- IPG PHOTONICS CORPORATION
- SIGNIFY HOLDING
- CORNING INCORPORATED
- ON SEMICONDUCTOR CORPORATION
- OFS FITEL, LLC
- COHERENT CORP.
- NICHIA CORPORATION
- 其他公司
- TOPTICA PHOTONICS
- M SQUARED LASERS LIMITED
- FREEDOM PHOTONICS LLC
- SCINTIL PHOTONICS
- PHOTONICS INDUSTRIES INTERNATIONAL. INC.
- LUMILEDS HOLDINGS BV
- EXCELITAS TECHNOLOGIES CORP.
- TRUMPF
- EMERSON ELECTRIC CO
- SAMSUNG ELECTRONICS
第十五章 附录
The photonics market is projected to grow from USD 1,093.96 billion in 2025 to USD 1,481.80 billion by 2030, at a CAGR of 6.3% during the forecast period. The photonics market is driven by the growing need for high-bandwidth communication solutions, particularly due to advancements in 5G technology, cloud computing, and the increasing number of Internet of Things (IoT) protocols. These advancements require optical fibers and transceivers to enhance data transmission speeds.
| Scope of the Report | |
|---|---|
| Years Considered for the Study | 2021-2030 |
| Base Year | 2024 |
| Forecast Period | 2025-2030 |
| Units Considered | Value (USD Million/Billion) |
| Segments | Product Type, Material, Wavelength, Application, and End-use Industry, and Region |
| Regions covered | North America, Europe, the Middle East & Africa, and South America |
In the realm of industrial manufacturing, lasers and optical sensors are improving the precision of cutting, welding, and quality control processes, contributing to the rise of automated assembly lines, much like the impact of Industry 4.0. In healthcare, the rising use of non-invasive diagnostic techniques, such as infrared spectroscopy and biophotonics, is stimulating market growth to support an aging population. Additionally, in consumer electronics, there is a high demand for products like smartphones, as well as augmented reality (AR) and virtual reality (VR) devices. This demand is driving the need for visible-wavelength LEDs and micro-LED displays.
"Detectors, sensors, and imaging devices segment to register the fastest growth during the forecast period ."
The detectors, sensors, and imaging devices segment is projected to register the fastest growth in the photonics market during the forecast period. This growth is driven by their widespread adoption in diverse, high-growth industries such as automotive, healthcare, consumer electronics, defense, and industrial automation. The increasing reliance on photonic sensors for high-precision smart systems is fueling the demand for real-time data acquisition across various applications. In the automotive sector, for example, the emergence of advanced driver-assistance systems (ADAS) and fully autonomous vehicles has significantly increased the production volumes of LiDAR systems, infrared detectors, and 3D imaging sensors. These technologies depend on photonics to detect obstacles, scan terrain, and enhance safety in all weather conditions. In healthcare, photonic imaging devices such as optical coherence tomography (OCT), fluorescence imaging, and bio-photonic sensors are enabling earlier and more accurate disease diagnoses than ever before. Non-invasive imaging and real-time monitoring, using both near-infrared (NIR) and visible light modalities, have become essential in surgical applications and diagnostic point-of-care settings. As the global population ages and the prevalence of chronic conditions rises, the demand for advanced diagnostic capabilities is expected to grow.
"Glass segment to register the fastest growth in the photonics market in terms of value."
Glass is the fastest-growing material segment in the photonics market due to its excellent optical properties, chemical durability, and versatility across a wide range of applications. Its growth is primarily driven by its use in the manufacture of optical fibers, which enable high-speed internet services, 5G networks, and long-haul data transmission infrastructures. As global data transfer and cloud computing continue to expand rapidly, telecom companies have made significant investments in fiber optic networks that benefit from the low optical attenuation and high transmission efficiency of silica-based glass. Additionally, glass is increasingly utilized in high-performance lenses, substrates, prisms, and waveguides for imaging (ocular), sensing (photonic), and laser applications. Specialty glasses, such as borosilicate, fused silica, and chalcogenide glass, offer a diverse range of optical properties like high thermal resistance, UV or IR transparency, and low dispersion, making them suitable for various specialized applications in aerospace, defense, healthcare, and industrial lasers. The growing acceptance of glass components is also fueled by the rise of high-precision medical devices, including diagnostic imaging systems and surgical tools. Glass is becoming indispensable for manufacturers due to its biocompatibility and dimensional stability.
"Visible wavelength segment to register the fastest growth in the photonics market in terms of value."
The visible wavelength segment is projected to register the fastest growth in the photonics market due to its wide applications in imaging, display, lighting, and consumer electronics. With wavelengths ranging from roughly 400 to 700 nanometers, visible light is the most relevant spectrum to drive human interactions, making it easier to permit possible integration into any applicable technology that would be used in the daily lives of people. The drive for high-resolution display panels has grown significantly over the past few years, with OLED, micro-LED, and quantum dot displays driving displays in phones, TVs, monitors, and AR/VR. This established demand for display screen technology has driven the adoption of visible light photonic technologies. Companies in countries like South Korea, China, and Japan, familiar with the electronics and display market, are investing heavily in visible-light photonics in new display technologies. Another major driver of growth is solid-state lighting (SSL) technologies, including LEDs (which mostly impact visible light and some IR), as governments are requiring energy efficiency metrics and mass LED adoption in commercial, residential, and public infrastructure projects.
"Lighting segment to register the fastest growth in the photonics market in terms of value."
Lighting is emerging as the fastest-growing application segment of the photonics market, owing to the increased adoption of energy-efficient lighting sources, rapid urbanization, and global goals aimed at carbon neutrality. The conversion from traditional incandescent and fluorescent lighting to solid-state lighting (SSL)-specifically light-emitting diodes (LEDs) and organic LEDs (OLEDs)-has triggered a considerable demand for photonic technologies. Photonic technologies have luminous efficacy that far exceeds traditional light source alternatives, significantly longer operating lives, and reduce energy consumption to become a viable solution in commercial, residential, industrial, and public infrastructure applications. Governments have been instituting stringent energy-efficiency regulations and subsidies/mandates to encourage the adoption of LED-based lighting solutions in the Asia Pacific, Europe, and North America, also impacting the projected growth of the market. Reality capture smart lighting systems that employ photonics-based controls and sensors are becoming increasingly desirable and consumed in smart homes and smart cities. These smart lighting systems are adjustable based on occupancy or ambient changes (dynamics) and modify their brightness and color temperature, respectively, utilizing photonics-based components such as light sensors, photodetectors, and controls.
Media & telecommunication segment to register the fastest growth in the photonics market in terms of value."
The media and telecommunication segment is the fastest-growing end-use segment in the photonics market, largely fueled by the increasing need for remote high-speed data transmission, 5G infrastructure, and the development of optical communication systems. Photonics technologies, particularly fiber optic technologies and optical transceivers, represent the most advanced telecommunications solutions that make today's telecommunications networks operate faster, more securely, and with more bandwidth and less loss, all over long distances. As the quantity of global internet usage increases, along with the speed and quantity of data traffic, telecoms are currently transitioning away from copper infrastructures and toward fiber optic networks. This transition is creating a great need for telecommunication photonic components. The development of 5G commercial networks and the anticipated development towards 6G will also require photonic solutions to accommodate the number of devices connected to the networks. The number of devices streaming content and the latency requirements for applications such as augmented reality (AR), virtual reality (VR), and cloud computing will also require greater bandwidth and a lower latency telecommunication infrastructure. Photonic integrated circuits (PICs), lasers, and photodetectors are being integrated into state-of-the-art data centers and wireless communications hubs in order to meet upcoming demands in bandwidth and latency. New developments in wavelength division multiplexing (WDM) and coherent optical systems significantly increase the efficiency of optical communications systems, furthering the need for photonic technologies in media and telecommunications.
In-depth interviews were conducted with chief executive officers (CEOs), marketing directors, other innovation and technology directors, and executives from various key organizations operating in the photonics market, and information was gathered from secondary research to determine and verify the market size of several segments.
- By Company Type: Tier 1 - 50%, Tier 2 - 30%, and Tier 3 - 20%
- By Designation: Managers- 15%, Directors - 20%, and Others - 65%
- By Region: North America - 14%, Europe - 16%, Asia Pacific - 58%, and the Rest of the World - 12%.
The photonics market comprises Thorlabs, Inc. (US), IPG Photonics Corporation (US), Lumentum Operations LLC (US), ams-OSRAM AG (Austria), Hamamatsu Photonics K.K. (Japan), Corning Incorporated (US), Coherent Corp(US), OFS Fitel, LLC (US), ON SEMICONDUCTOR CORPORATION (US), and Signify Holding (Netherlands). The study includes an in-depth competitive analysis of these key players in the photonics market, with their company profiles, recent developments, and key market strategies.
Research Coverage
This report segments the photonics market on the basis of product type, material, wavelength, application, end-use industry, and region, and provides estimations for the overall value of the market across various regions. A detailed analysis of key industry players has been conducted to provide insights into their business overviews, products & services, key strategies, and expansions associated with the photonics market.
Key benefits of buying this report
This research report is focused on various levels of analysis - industry analysis (industry trends), market ranking analysis of top players, and company profiles, which together provide an overall view of the competitive landscape; emerging and high-growth segments of the photonics market; high-growth regions; and market drivers, restraints, opportunities, and challenges.
The report provides insights on the following pointers:
- Analysis of drivers: (advancements in photonic-integrated circuits enabling miniaturization and cost-effective high-performance solutions), restraints (high optical losses in silicon nitride and SOI (silicon-on-insulator) waveguide fabrication), opportunities (integration of photonics with artificial intelligence and Internet of things to enable smart cities, precision agriculture, and industrial automation), and challenges (signal distortion from non-linear effects in high-power photonic systems).
- Market Penetration: Comprehensive information on the photonics market offered by top players in the photonics market.
- Product Development/Innovation: Detailed insights on upcoming technologies, research & development activities, partnerships, agreements, and collaboration in the market.
- Market Development: This report provides comprehensive information about lucrative emerging markets and analyzes the photonics market across regions.
- Market Capacity: Production capacities of companies producing photonics are provided wherever available with upcoming capacities for the photonics market.
- Competitive Assessment: In-depth assessment of market shares, strategies, products, and manufacturing capabilities of leading players in the photonics market.
TABLE OF CONTENTS
1 INTRODUCTION
- 1.1 STUDY OBJECTIVES
- 1.2 MARKET DEFINITION
- 1.3 STUDY SCOPE
- 1.3.1 MARKETS COVERED AND REGIONAL SNAPSHOT
- 1.3.2 INCLUSIONS AND EXCLUSIONS
- 1.3.3 YEARS CONSIDERED
- 1.3.4 CURRENCY CONSIDERED
- 1.4 RESEARCH LIMITATIONS
- 1.5 STAKEHOLDERS
- 1.6 SUMMARY OF CHANGES
2 RESEARCH METHODOLOGY
- 2.1 RESEARCH DATA
- 2.1.1 SECONDARY DATA
- 2.1.1.1 Key data from secondary sources
- 2.1.2 PRIMARY DATA
- 2.1.2.1 Key data from primary sources
- 2.1.2.2 Key primary sources
- 2.1.2.3 Key participants for primary interviews
- 2.1.2.4 Breakdown of primary interviews
- 2.1.2.5 Key industry insights
- 2.1.1 SECONDARY DATA
- 2.2 BASE NUMBER CALCULATION
- 2.2.1 SUPPLY-SIDE ANALYSIS
- 2.2.2 DEMAND-SIDE ANALYSIS
- 2.3 GROWTH FORECAST
- 2.3.1 SUPPLY SIDE
- 2.3.2 DEMAND SIDE
- 2.4 MARKET SIZE ESTIMATION
- 2.4.1 BOTTOM-UP APPROACH
- 2.4.2 TOP-DOWN APPROACH
- 2.5 DATA TRIANGULATION
- 2.6 RESEARCH ASSUMPTIONS
- 2.7 GROWTH FORECAST
- 2.8 RISK ASSESSMENT
- 2.9 FACTOR ANALYSIS
3 EXECUTIVE SUMMARY
4 PREMIUM INSIGHTS
- 4.1 ATTRACTIVE OPPORTUNITIES FOR PLAYERS IN PHOTONICS MARKET
- 4.2 PHOTONICS MARKET, BY TYPE
- 4.3 PHOTONICS MARKET, BY MATERIAL
- 4.4 PHOTONICS MARKET, BY APPLICATION
- 4.5 PHOTONICS MARKET, BY WAVELENGTH
- 4.6 PHOTONICS MARKET, BY END-USE INDUSTRY
- 4.7 PHOTONICS MARKET, BY COUNTRY
5 MARKET OVERVIEW
- 5.1 INTRODUCTION
- 5.2 MARKET DYNAMICS
- 5.2.1 DRIVERS
- 5.2.1.1 Advancements in photonic-integrated circuits (PICs)
- 5.2.1.2 Rising demand for high-speed optical communication
- 5.2.1.3 Growth of data-driven economies
- 5.2.2 RESTRAINTS
- 5.2.2.1 High optical losses in silicon nitride and silicon-on-insulator (SOI) waveguide fabrication
- 5.2.2.2 Lack of unified design standards for photonics devices
- 5.2.3 OPPORTUNITIES
- 5.2.3.1 Commercialization and innovation in quantum technologies
- 5.2.3.2 Integration of photonics with artificial intelligence and Internet of Things (IoT)
- 5.2.3.3 Expansion of next-generation data centers and telecommunication networks
- 5.2.4 CHALLENGES
- 5.2.4.1 Signal distortion from non-linear effects in high-power photonic systems
- 5.2.4.2 Complexity in integration of photonic sensors into industrial IoT systems
- 5.2.1 DRIVERS
- 5.3 IMPACT OF GENRATIVE AI ON PHOTONICS MARKET
- 5.3.1 INTRODUCTION
6 INDUSTRY TRENDS
- 6.1 INTRODUCTION
- 6.2 TRENDS/DISRUPTIONS IMPACTING CUSTOMER BUSINESS
- 6.3 VALUE CHAIN ANALYSIS
- 6.4 INVESTMENT AND FUNDING SCENARIO
- 6.5 ECOSYSTEM ANALYSIS
- 6.6 PRICING ANALYSIS
- 6.6.1 INDICATIVE PRICING ANALYSIS, BY REGION, 2024
- 6.6.2 INDICATIVE PRICING ANALYSIS, BY PRODUCT TYPE, 2024
- 6.7 TECHNOLOGY ANALYSIS
- 6.7.1 KEY TECHNOLOGIES
- 6.7.2 COMPLEMENTARY TECHNOLOGIES
- 6.7.3 ADJACENT TECHNOLOGIES
- 6.8 PATENT ANALYSIS
- 6.8.1 METHODOLOGY
- 6.8.2 PATENTS GRANTED WORLDWIDE
- 6.8.3 PATENT PUBLICATION TRENDS
- 6.8.4 INSIGHTS
- 6.8.5 LEGAL STATUS OF PATENTS
- 6.8.6 JURISDICTION ANALYSIS
- 6.8.7 TOP APPLICANTS
- 6.8.8 LIST OF MAJOR PATENTS
- 6.9 TRADE ANALYSIS
- 6.9.1 IMPORT SCENARIO (HS CODE 854140)
- 6.9.2 EXPORT SCENARIO (HS CODE 854140)
- 6.10 KEY CONFERENCES AND EVENTS, 2024-2025
- 6.11 TARIFF AND REGULATORY LANDSCAPE
- 6.11.1 TARIFFS RELATED TO PHOTONICS
- 6.11.2 REGULATORY BODIES, GOVERNMENT AGENCIES, AND OTHER ORGANIZATIONS
- 6.11.3 REGULATIONS AND STANDARDS
- 6.12 PORTER'S FIVE FORCES ANALYSIS
- 6.12.1 THREAT OF NEW ENTRANTS
- 6.12.2 THREAT OF SUBSTITUTES
- 6.12.3 BARGAINING POWER OF SUPPLIERS
- 6.12.4 BARGAINING POWER OF BUYERS
- 6.12.5 INTENSITY OF COMPETITIVE RIVALRY
- 6.13 KEY STAKEHOLDERS AND BUYING CRITERIA
- 6.13.1 KEY STAKEHOLDERS IN BUYING PROCESS
- 6.13.2 BUYING CRITERIA
- 6.14 MACROECONOMIC OUTLOOK
- 6.14.1 GDP TRENDS AND FORECASTS, BY COUNTRY
- 6.15 CASE STUDY ANALYSIS
- 6.15.1 ACCELERATING 5G AND IOT DEPLOYMENT: ACP'S CUSTOMIZED GAIN FLATTENING FILTER SOLUTION FOR A TELECOM LEADER
- 6.15.2 SMART VEHICLES AND SAFER ROADS: HAMAMATSU'S OPTICAL SENSORS POWER AUTOMOTIVE INNOVATION
- 6.15.3 ORCA-QUEST QCMOS CAMERA BY HAMAMATSU PHOTONICS - ENABLING PRECISION IMAGING ACROSS SCIENTIFIC FRONTIERS
7 PHOTONICS MARKET, BY PRODUCT TYPE
- 7.1 INTRODUCTION
- 7.2 LIGHT SOURCES
- 7.2.1 SHIFT TOWARD LED-BASED EFFICIENCY AND SMART ILLUMINATION TO DRIVE MARKET
- 7.3 LASERS AND LASER SYSTEMS
- 7.3.1 HIGH PRECISION, POWER, AND VERSATILITY TO DRIVE DEMAND
- 7.4 DETECTORS, SENSORS & IMAGING DEVICES
- 7.4.1 FOCUS ON ENHANCEMENT OF VISIBILITY, SENSING ACCURACY, AND DATA ACQUISITION ACROSS INDUSTRIES TO DRIVE MARKET
- 7.5 OPTICAL COMMUNICATION & NETWORKING
- 7.5.1 GROWING INTERNET PENETRATION AND 5G EXPANSION TO FUEL DEMAND
- 7.6 OPTICAL COMPONENTS & SYSTEMS
- 7.6.1 INCREASING ADOPTION OF PHOTONIC SYSTEMS IN LIDAR FOR AUTONOMOUS VEHICLES AND ADVANCED DRIVER-ASSISTANCE SYSTEMS TO DRIVE MARKET
- 7.7 OPTOELECTRONICS & INTEGRATED PHOTONIC CIRCUITS
- 7.7.1 MINIATURIZATION AND HIGH-SPEED FUNCTIONALITY IN NEXT-GEN PHOTONIC APPLICATIONS TO PROPEL MARKET
8 PHOTONICS MARKET, BY WAVELENGTH
- 8.1 INTRODUCTION
- 8.2 ULTRAVIOLET
- 8.2.1 RISING DEMAND FOR STERILIZATION AND NANOLITHOGRAPHY TO ACCELERATE ADOPTION
- 8.3 VISIBLE
- 8.3.1 TECHNOLOGICAL ADVANCEMENTS IN DISPLAYS, EXCELLENT LIGHTING EFFICIENCY, AND BOOMING CONSUMER ELECTRONICS INDUSTRY TO DRIVE MARKET
- 8.4 INFRARED
- 8.4.1 RISING SECURITY & SURVEILLANCE REQUIREMENTS, AUTONOMOUS VEHICLE INTEGRATION, AND ENVIRONMENTAL MONITORING NEEDS TO PROPEL MARKET
9 PHOTONICS MARKET, BY APPLICATION
- 9.1 INTRODUCTION
- 9.2 DISPLAY
- 9.2.1 RISING DEMAND FOR HIGH-RESOLUTION PANELS IN CONSUMER AND INDUSTRIAL INTERFACES TO DRIVE MARKET
- 9.3 INFORMATION & COMMUNICATION TECHNOLOGY
- 9.3.1 RISING OPTICAL DATA TRANSMISSION DEMANDS TO ACCELERATE ADOPTION
- 9.4 PHOTOVOLTAICS
- 9.4.1 ENERGY TRANSITION GOALS AND OFF-GRID ELECTRIFICATION TO DRIVE DEMAND
- 9.5 MEDICAL TECHNOLOGY & LIFE SCIENCES
- 9.5.1 USE IN PRECISION DIAGNOSTICS AND NEXT-GEN MEDICAL TREATMENTS TO DRIVE MARKET
- 9.6 MEASUREMENT & AUTOMATED VISION
- 9.6.1 NEED FOR INDUSTRIAL ACCURACY AND ROBOTICS INTEGRATION TO FUEL DEMAND
- 9.7 LIGHTING
- 9.7.1 GROWTH OF SMART AND HUMAN-CENTRIC LIGHTING TO DRIVE MARKET
- 9.8 OTHER APPLICATIONS
- 9.8.1 ASTRONOMY
- 9.8.2 SEMICONDUCTOR MANUFACTURING
10 PHOTONICS MARKET, BY MATERIAL
- 10.1 INTRODUCTION
- 10.2 SILICON
- 10.2.1 CMOS INTEGRATION, DATA CENTER GROWTH, AND INTEGRATED PHOTONICS DEMAND TO DRIVE MARKET
- 10.3 GLASS
- 10.3.1 RISING OPTICAL FIBER DEMAND, INFRARED TECHNOLOGY GROWTH, AND TELECOM INFRASTRUCTURE NEEDS TO PROPEL MARKET
- 10.4 INDIUM PHOSPHIDE (INP)
- 10.4.1 HIGH-SPEED OPTICAL COMMUNICATION AND QUANTUM ADVANCEMENTS TO DRIVE DEMAND
- 10.5 GALLIUM ARSENIDE
- 10.5.1 ONGOING ADVANCES IN OPTOELECTRONICS DRIVEN BY TELECOM AND AUTOMOTIVE NEEDS TO DRIVE MARKET
- 10.6 GALLIUM NITRIDE
- 10.6.1 RISING DEMAND FOR LIGHTING EFFICIENCY, SUPPORTED BY GLOBAL SUSTAINABILITY GOALS, TO DRIVE MARKET
- 10.7 LITHIUM NIOBATE
- 10.7.1 USE FOR ADVANCING MODULATION, NON-LINEAR OPTICS, AND HIGH-SPEED COMMUNICATION TO PROPEL MARKET
- 10.8 OTHER MATERIALS
- 10.8.1 GALLIUM ALUMINIUM ARSENIDE
- 10.8.2 GERMANIUM
11 PHOTONICS MARKET, BY END-USE INDUSTRY
- 11.1 INTRODUCTION
- 11.2 CONSTRUCTION
- 11.2.1 GREEN BUILDING PRACTICES AND RISING USE IN STRUCTURAL HEALTH MONITORING TO DRIVE MARKET
- 11.3 MEDIA & TELECOMMUNICATION
- 11.3.1 5G NETWORK ROLLOUT, STREAMING SERVICE GROWTH, AND DIGITAL TRANSFORMATION TO DRIVE DEMAND
- 11.4 MEDICAL
- 11.4.1 DIOGNOSTIC IMAGING DEMAND AND MINIMALLY INVASIVE SURGERY TRENDS TO FUEL MARKET GROWTH
- 11.5 SECURITY & DEFENSE
- 11.5.1 ADVANCING DIRECTED ENERGY AND SECURE COMMUNICATIONS THROUGH PHOTONICS TO PROPEL MARKET
- 11.6 INDUSTRIAL
- 11.6.1 FOCUS ON PRECISION MANUFACTURING AND PROCESS OPTIMIZATION TO DRIVE MARKET
- 11.7 OTHER END-USE INDUSTRIES
- 11.7.1 CONSUMER ELECTRONICS
- 11.7.2 AGRICULTURE
12 PHOTONICS MARKET, BY REGION
- 12.1 INTRODUCTION
- 12.2 ASIA PACIFIC
- 12.2.1 CHINA
- 12.2.1.1 High investments in telecommunications and artificial intelligence (AI) to drive demand
- 12.2.2 JAPAN
- 12.2.2.1 Increased semiconductor manufacturing to propel demand
- 12.2.3 INDIA
- 12.2.3.1 Government-backed digitalization and growth in medical diagnostics to drive market
- 12.2.4 SOUTH KOREA
- 12.2.4.1 High R&D investments in high-quality materials to fuel demand
- 12.2.5 TAIWAN
- 12.2.5.1 Leadership in semiconductor fabrication to drive adoption
- 12.2.6 REST OF ASIA PACIFIC
- 12.2.1 CHINA
- 12.3 NORTH AMERICA
- 12.3.1 US
- 12.3.1.1 Strong federal and private sector R&D funding to drive market
- 12.3.2 CANADA
- 12.3.2.1 Expansion of optical communication networks to boost market growth
- 12.3.3 MEXICO
- 12.3.3.1 Rising electronics manufacturing and demand for LED lighting to propel market
- 12.3.1 US
- 12.4 EUROPE
- 12.4.1 GERMANY
- 12.4.1.1 Industrial automation, smart manufacturing, and automotive LiDAR to drive demand
- 12.4.2 ITALY
- 12.4.2.1 Growing medical imaging and smart lighting needs to drive adoption
- 12.4.3 FRANCE
- 12.4.3.1 Rising demand from aerospace & defense industry to drive market
- 12.4.4 UK
- 12.4.4.1 Government-led funding in quantum technologies to drive market
- 12.4.5 NETHERLANDS
- 12.4.5.1 Growing integrated photonics startups due to strong R&D support and innovation-driven policies to boost market
- 12.4.6 REST OF EUROPE
- 12.4.1 GERMANY
- 12.5 ROW
- 12.5.1 SAUDI ARABIA
- 12.5.1.1 High focus on diversification under Vision 2030 initiative to drive market
- 12.5.2 UAE
- 12.5.2.1 Digitalization and smart governance to accelerate market growth
- 12.5.3 OMAN
- 12.5.3.1 Industrial diversification and maritime security demands to accelerate adoption
- 12.5.4 EGYPT
- 12.5.4.1 Local solar film production and bio-photonics adoption to accelerate market growth
- 12.5.5 SOUTH AFRICA
- 12.5.5.1 Growing use in mining and astronomy applications to drive market
- 12.5.6 OTHERS IN ROW
- 12.5.1 SAUDI ARABIA
13 COMPETITIVE LANDSCAPE
- 13.1 INTRODUCTION
- 13.2 KEY PLAYER STRATEGIES/RIGHT TO WIN
- 13.3 MARKET SHARE ANALYSIS
- 13.4 REVENUE ANALYSIS
- 13.5 BRAND/PRODUCT COMPARISON
- 13.6 COMPANY EVALUATION MATRIX: KEY PLAYERS, 2024
- 13.6.1 STARS
- 13.6.2 EMERGING LEADERS
- 13.6.3 PERVASIVE PLAYERS
- 13.6.4 PARTICIPANTS
- 13.6.5 COMPANY FOOTPRINT: KEY PLAYERS, 2024
- 13.6.5.1 Company footprint
- 13.6.5.2 Product type footprint
- 13.6.5.3 Application footprint
- 13.6.5.4 End-use industry footprint
- 13.6.5.5 Region footprint
- 13.7 COMPANY EVALUATION MATRIX: STARTUPS/SMES, 2024
- 13.7.1 PROGRESSIVE COMPANIES
- 13.7.2 RESPONSIVE COMPANIES
- 13.7.3 DYNAMIC COMPANIES
- 13.7.4 STARTING BLOCKS
- 13.7.5 COMPETITIVE BENCHMARKING: STARTUPS/SMES, 2024
- 13.7.5.1 Detailed list of key startups/SMEs
- 13.7.5.2 Competitive benchmarking of key startups/SMEs
- 13.8 COMPANY VALUATION AND FINANCIAL METRICS, 2024
- 13.9 COMPETITIVE SCENARIO
- 13.9.1 DEALS
- 13.9.2 PRODUCT LAUNCHES
14 COMPANY PROFILES
- 14.1 KEY PLAYERS
- 14.1.1 THORALABS, INC.
- 14.1.1.1 Business overview
- 14.1.1.2 Products/Solutions/Services offered
- 14.1.1.3 MnM view
- 14.1.1.3.1 Key strengths/Right to win
- 14.1.1.3.2 Strategic choices
- 14.1.1.3.3 Weaknesses/Competitive threats
- 14.1.2 AMS-OSRAM
- 14.1.2.1 Business overview
- 14.1.2.2 Products/Solutions/Services offered
- 14.1.2.3 MnM view
- 14.1.2.3.1 Key strengths/Right to win
- 14.1.2.3.2 Strategic choices
- 14.1.2.3.3 Weaknesses/Competitive threats
- 14.1.3 HAMAMATSU PHOTONICS K.K.
- 14.1.3.1 Business overview
- 14.1.3.2 Products/Solutions/Services offered
- 14.1.3.3 MnM view
- 14.1.3.3.1 Key strengths/Right to win
- 14.1.3.3.2 Strategic choices
- 14.1.3.3.3 Weaknesses/Competitive threats
- 14.1.4 LUMENTUM OPERATIONS LLC
- 14.1.4.1 Business overview
- 14.1.4.2 Products/Solutions/Services offered
- 14.1.4.3 MnM view
- 14.1.4.3.1 Key strengths/Right to win
- 14.1.4.3.2 Strategic choices
- 14.1.4.3.3 Weaknesses/Competitive threats
- 14.1.5 IPG PHOTONICS CORPORATION
- 14.1.5.1 Business overview
- 14.1.5.2 Products/Solutions/Services offered
- 14.1.5.3 MnM view
- 14.1.5.3.1 Key strengths/Right to win
- 14.1.5.3.2 Strategic choices
- 14.1.5.3.3 Weaknesses/Competitive threats
- 14.1.6 SIGNIFY HOLDING
- 14.1.6.1 Business overview
- 14.1.6.2 Products/Solutions/Services offered
- 14.1.7 CORNING INCORPORATED
- 14.1.7.1 Business overview
- 14.1.7.2 Products/Solutions/Services offered
- 14.1.7.3 Recent developments
- 14.1.7.3.1 Product launches
- 14.1.7.3.2 Deals
- 14.1.7.4 MnM view
- 14.1.7.4.1 Key strengths/Right to win
- 14.1.7.4.2 Strategic choices
- 14.1.7.4.3 Weaknesses/Competitive threats
- 14.1.8 ON SEMICONDUCTOR CORPORATION
- 14.1.8.1 Business overview
- 14.1.8.2 Products/Solutions/Services offered
- 14.1.8.3 Recent developments
- 14.1.8.3.1 Deals
- 14.1.9 OFS FITEL, LLC
- 14.1.9.1 Business overview
- 14.1.9.2 Products/Solutions/Services offered
- 14.1.9.3 Recent developments
- 14.1.9.3.1 Product launches
- 14.1.10 COHERENT CORP.
- 14.1.10.1 Business overview
- 14.1.10.2 Products/Solutions/Services offered
- 14.1.11 NICHIA CORPORATION
- 14.1.11.1 Business overview
- 14.1.11.2 Products/Solutions/Services offered
- 14.1.11.3 Recent developments
- 14.1.11.3.1 Product launches
- 14.1.1 THORALABS, INC.
- 14.2 OTHER PLAYERS
- 14.2.1 TOPTICA PHOTONICS
- 14.2.2 M SQUARED LASERS LIMITED
- 14.2.3 FREEDOM PHOTONICS LLC
- 14.2.4 SCINTIL PHOTONICS
- 14.2.5 PHOTONICS INDUSTRIES INTERNATIONAL. INC.
- 14.2.6 LUMILEDS HOLDINGS B.V.
- 14.2.7 EXCELITAS TECHNOLOGIES CORP.
- 14.2.8 TRUMPF
- 14.2.9 EMERSON ELECTRIC CO
- 14.2.10 SAMSUNG ELECTRONICS
15 APPENDIX
- 15.1 DISCUSSION GUIDE
- 15.2 KNOWLEDGESTORE: MARKETSANDMARKETS' SUBSCRIPTION PORTAL
- 15.3 CUSTOMIZATION OPTIONS
- 15.4 RELATED REPORTS
- 15.5 AUTHOR DETAILS
List of Tables
- TABLE 1 ROLES OF COMPANIES IN PHOTONICS ECOSYSTEM
- TABLE 2 INDICATIVE PRICING ANALYSIS OF PHOTONIC PRODUCT TYPES, BY REGION, 2024 (USD/UNIT)
- TABLE 3 INDICATIVE PRICING ANALYSIS OF PHOTONICS, BY PRODUCT TYPE, 2024 (USD/UNIT)
- TABLE 4 PHOTONICS MARKET: KEY TECHNOLOGIES
- TABLE 5 PHOTONICS MARKET: COMPLEMENTARY TECHNOLOGIES
- TABLE 6 PHOTONICS MARKET: ADJACENT TECHNOLOGIES
- TABLE 7 PHOTONICS MARKET: TOTAL NUMBER OF PATENTS, 2015-2024
- TABLE 8 PHOTONICS MARKET: LIST OF MAJOR PATENT OWNERS, 2015-2024
- TABLE 9 PHOTONICS MARKET: LIST OF MAJOR PATENTS, 2018-2024
- TABLE 10 PHOTONICS MARKET: LIST OF KEY CONFERENCES AND EVENTS, 2025-2026
- TABLE 11 PHOTONICS MARKET: TARIFF ANALYSIS, 2025
- TABLE 12 NORTH AMERICA: REGULATORY BODIES, GOVERNMENT AGENCIES, AND OTHER ORGANIZATIONS
- TABLE 13 EUROPE: REGULATORY BODIES, GOVERNMENT AGENCIES, AND OTHER ORGANIZATIONS
- TABLE 14 ASIA PACIFIC: REGULATORY BODIES, GOVERNMENT AGENCIES, AND OTHER ORGANIZATIONS
- TABLE 15 ROW: REGULATORY BODIES, GOVERNMENT AGENCIES, AND OTHER ORGANIZATIONS
- TABLE 16 PHOTONICS MARKET: REGULATIONS AND STANDARDS
- TABLE 17 PHOTONICS MARKET: PORTER'S FIVE FORCES ANALYSIS
- TABLE 18 INFLUENCE OF STAKEHOLDERS ON BUYING PROCESS FOR TOP THREE END-USE INDUSTRIES
- TABLE 19 KEY BUYING CRITERIA FOR TOP THREE END-USE INDUSTRIES
- TABLE 20 GDP TRENDS AND FORECASTS, BY COUNTRY, 2023-2025 (USD MILLION)
- TABLE 21 PHOTONICS MARKET, BY PRODUCT TYPE, 2021-2024 (USD BILLION)
- TABLE 22 PHOTONICS MARKET, BY PRODUCT TYPE, 2025-2030 (USD BILLION)
- TABLE 23 PHOTONICS MARKET, BY WAVELENGTH, 2021-2024 (USD BILLION)
- TABLE 24 PHOTONICS MARKET, BY WAVELENGTH, 2025-2030 (USD BILLION)
- TABLE 25 PHOTONICS MARKET, BY APPLICATION, 2021-2024 (USD BILLION)
- TABLE 26 PHOTONICS MARKET, BY APPLICATION, 2025-2030 (USD BILLION)
- TABLE 27 PHOTONICS MARKET, BY MATERIAL, 2021-2024 (USD BILLION)
- TABLE 28 PHOTONICS MARKET, BY MATERIAL, 2025-2030 (USD BILLION)
- TABLE 29 PHOTONICS MARKET, BY END-USE INDUSTRY, 2021-2024 (USD BILLION)
- TABLE 30 PHOTONICS MARKET, BY END-USE INDUSTRY, 2025-2030 (USD BILLION)
- TABLE 31 PHOTONICS MARKET, BY REGION, 2021-2024 (USD BILLION)
- TABLE 32 PHOTONICS MARKET, BY REGION, 2025-2030 (USD BILLION)
- TABLE 33 ASIA PACIFIC: PHOTONICS MARKET, BY COUNTRY, 2021-2024 (USD BILLION)
- TABLE 34 ASIA PACIFIC: PHOTONICS MARKET, BY COUNTRY, 2025-2030 (USD BILLION)
- TABLE 35 ASIA PACIFIC: PHOTONICS MARKET, BY PRODUCT TYPE, 2021-2024 (USD BILLION)
- TABLE 36 ASIA PACIFIC: PHOTONICS MARKET, BY PRODUCT TYPE, 2025-2030 (USD BILLION)
- TABLE 37 ASIA PACIFIC: PHOTONICS MARKET, BY APPLICATION, 2021-2024 (USD BILLION)
- TABLE 38 ASIA PACIFIC: PHOTONICS MARKET, BY APPLICATION, 2025-2030 (USD BILLION)
- TABLE 39 ASIA PACIFIC: PHOTONICS MARKET, BY END-USE INDUSTRY, 2021-2024 (USD BILLION)
- TABLE 40 ASIA PACIFIC: PHOTONICS MARKET, BY END-USE INDUSTRY, 2025-2030 (USD BILLION)
- TABLE 41 CHINA: PHOTONICS MARKET, BY END-USE INDUSTRY, 2021-2024 (USD BILLION)
- TABLE 42 CHINA: PHOTONICS MARKET, BY END-USE INDUSTRY, 2025-2030 (USD BILLION)
- TABLE 43 JAPAN: PHOTONICS MARKET, BY END-USE INDUSTRY, 2021-2024 (USD BILLION)
- TABLE 44 JAPAN: PHOTONICS MARKET, BY END-USE INDUSTRY, 2025-2030 (USD BILLION)
- TABLE 45 INDIA: PHOTONICS MARKET, BY END-USE INDUSTRY, 2021-2024 (USD BILLION)
- TABLE 46 INDIA: PHOTONICS MARKET, BY END-USE INDUSTRY, 2025-2030 (USD BILLION)
- TABLE 47 SOUTH KOREA: PHOTONICS MARKET, BY END-USE INDUSTRY, 2021-2024 (USD BILLION)
- TABLE 48 SOUTH KOREA: PHOTONICS MARKET, BY END-USE INDUSTRY, 2025-2030 (USD BILLION)
- TABLE 49 TAIWAN: PHOTONICS MARKET, BY END-USE INDUSTRY, 2021-2024 (USD BILLION)
- TABLE 50 TAIWAN: PHOTONICS MARKET, BY END-USE INDUSTRY, 2025-2030 (USD BILLION)
- TABLE 51 REST OF ASIA PACIFIC: PHOTONICS MARKET, BY END-USE INDUSTRY, 2021-2024 (USD BILLION)
- TABLE 52 REST OF ASIA PACIFIC: PHOTONICS MARKET, BY END-USE INDUSTRY, 2025-2030 (USD BILLION)
- TABLE 53 NORTH AMERICA: PHOTONICS MARKET, BY COUNTRY, 2021-2024 (USD BILLION)
- TABLE 54 NORTH AMERICA: PHOTONICS MARKET, BY COUNTRY, 2025-2030 (USD BILLION)
- TABLE 55 NORTH AMERICA: PHOTONICS MARKET, BY PRODUCT TYPE, 2021-2024 (USD BILLION)
- TABLE 56 NORTH AMERICA: PHOTONICS MARKET, BY PRODUCT TYPE, 2025-2030 (USD BILLION)
- TABLE 57 NORTH AMERICA: PHOTONICS MARKET, BY APPLICATION, 2021-2024 (USD BILLION)
- TABLE 58 NORTH AMERICA: PHOTONICS MARKET, BY APPLICATION, 2025-2030 (USD BILLION)
- TABLE 59 NORTH AMERICA: PHOTONICS MARKET, BY END-USE INDUSTRY, 2021-2024 (USD BILLION)
- TABLE 60 NORTH AMERICA: PHOTONICS MARKET, BY END-USE INDUSTRY, 2025-2030 (USD BILLION)
- TABLE 61 US: PHOTONICS MARKET, BY END-USE INDUSTRY, 2021-2024 (USD BILLION)
- TABLE 62 US: PHOTONICS MARKET, BY END-USE INDUSTRY, 2025-2030 (USD BILLION)
- TABLE 63 CANADA: PHOTONICS MARKET, BY END-USE INDUSTRY, 2021-2024 (USD BILLION)
- TABLE 64 CANADA: PHOTONICS MARKET, BY END-USE INDUSTRY, 2025-2030 (USD BILLION)
- TABLE 65 MEXICO: PHOTONICS MARKET, BY END-USE INDUSTRY, 2021-2024 (USD BILLION)
- TABLE 66 MEXICO: PHOTONICS MARKET, BY END-USE INDUSTRY, 2025-2030 (USD BILLION)
- TABLE 67 EUROPE: PHOTONICS MARKET, BY COUNTRY, 2021-2024 (USD BILLION)
- TABLE 68 EUROPE: PHOTONICS MARKET, BY COUNTRY, 2025-2030 (USD BILLION)
- TABLE 69 EUROPE: PHOTONICS MARKET, BY PRODUCT TYPE, 2021-2024 (USD BILLION)
- TABLE 70 EUROPE: PHOTONICS MARKET, BY PRODUCT TYPE, 2025-2030 (USD BILLION)
- TABLE 71 EUROPE: PHOTONICS MARKET, BY APPLICATION, 2021-2024 (USD BILLION)
- TABLE 72 EUROPE: PHOTONICS MARKET, BY APPLICATION, 2025-2030 (USD BILLION)
- TABLE 73 EUROPE: PHOTONICS MARKET, BY END-USE INDUSTRY, 2021-2024 (USD BILLION)
- TABLE 74 EUROPE: PHOTONICS MARKET, BY END-USE INDUSTRY, 2025-2030 (USD BILLION)
- TABLE 75 GERMANY: PHOTONICS MARKET, BY END-USE INDUSTRY, 2021-2024 (USD BILLION)
- TABLE 76 GERMANY: PHOTONICS MARKET, BY END-USE INDUSTRY, 2025-2030 (USD BILLION)
- TABLE 77 ITALY: PHOTONICS MARKET, BY END-USE INDUSTRY, 2021-2024 (USD BILLION)
- TABLE 78 ITALY: PHOTONICS MARKET, BY END-USE INDUSTRY, 2025-2030 (USD BILLION)
- TABLE 79 FRANCE: PHOTONICS MARKET, BY END-USE INDUSTRY, 2021-2024 (USD BILLION)
- TABLE 80 FRANCE: PHOTONICS MARKET, BY END-USE INDUSTRY, 2025-2030 (USD BILLION)
- TABLE 81 UK: PHOTONICS MARKET, BY END-USE INDUSTRY, 2021-2024 (USD BILLION)
- TABLE 82 UK: PHOTONICS MARKET, BY END-USE INDUSTRY, 2025-2030 (USD BILLION)
- TABLE 83 NETHERLANDS: PHOTONICS MARKET, BY END-USE INDUSTRY, 2021-2024 (USD BILLION)
- TABLE 84 NETHERLANDS: PHOTONICS MARKET, BY END-USE INDUSTRY, 2025-2030 (USD BILLION)
- TABLE 85 REST OF EUROPE: PHOTONICS MARKET, BY END-USE INDUSTRY, 2021-2024 (USD BILLION)
- TABLE 86 REST OF EUROPE: PHOTONICS MARKET, BY END-USE INDUSTRY, 2025-2030 (USD BILLION)
- TABLE 87 ROW: PHOTONICS MARKET, BY COUNTRY, 2021-2024 (USD BILLION)
- TABLE 88 ROW: PHOTONICS MARKET, BY COUNTRY, 2025-2030 (USD BILLION)
- TABLE 89 ROW: PHOTONICS MARKET, BY PRODUCT TYPE, 2021-2024 (USD BILLION)
- TABLE 90 ROW: PHOTONICS MARKET, BY PRODUCT TYPE, 2025-2030 (USD BILLION)
- TABLE 91 ROW: PHOTONICS MARKET, BY APPLICATION, 2021-2024 (USD BILLION)
- TABLE 92 ROW: PHOTONICS MARKET, BY APPLICATION, 2025-2030 (USD BILLION)
- TABLE 93 ROW: PHOTONICS MARKET, BY END-USE INDUSTRY, 2021-2024 (USD BILLION)
- TABLE 94 ROW: PHOTONICS MARKET, BY END-USE INDUSTRY, 2025-2030 (USD BILLION)
- TABLE 95 SAUDI ARABIA: PHOTONICS MARKET, BY END-USE INDUSTRY, 2021-2024 (USD BILLION)
- TABLE 96 SAUDI ARABIA: PHOTONICS MARKET, BY END-USE INDUSTRY, 2025-2030 (USD BILLION)
- TABLE 97 UAE: PHOTONICS MARKET, BY END-USE INDUSTRY, 2021-2024 (USD BILLION)
- TABLE 98 UAE: PHOTONICS MARKET, BY END-USE INDUSTRY, 2025-2030 (USD BILLION)
- TABLE 99 OMAN: PHOTONICS MARKET, BY END-USE INDUSTRY, 2021-2024 (USD BILLION)
- TABLE 100 OMAN: PHOTONICS MARKET, BY END-USE INDUSTRY, 2025-2030 (USD BILLION)
- TABLE 101 EGYPT: PHOTONICS MARKET, BY END-USE INDUSTRY, 2021-2024 (USD BILLION)
- TABLE 102 EGYPT: PHOTONICS MARKET, BY END-USE INDUSTRY, 2025-2030 (USD BILLION)
- TABLE 103 SOUTH AFRICA: PHOTONICS MARKET, BY END-USE INDUSTRY, 2021-2024 (USD BILLION)
- TABLE 104 SOUTH AFRICA: PHOTONICS MARKET, BY END-USE INDUSTRY, 2025-2030 (USD BILLION)
- TABLE 105 OTHERS IN ROW: PHOTONICS MARKET, BY END-USE INDUSTRY, 2021-2024 (USD BILLION)
- TABLE 106 OTHERS IN ROW: PHOTONICS MARKET, BY END-USE INDUSTRY, 2025-2030 (USD BILLION)
- TABLE 107 PHOTONICS MARKET: OVERVIEW OF STRATEGIES ADOPTED BY KEY PLAYERS, JANUARY 2021-MAY 2025
- TABLE 108 PHOTONICS MARKET: DEGREE OF COMPETITION, 2024
- TABLE 109 PHOTONICS MARKET: PRODUCT TYPE FOOTPRINT
- TABLE 110 PHOTONICS MARKET: APPLICATION FOOTPRINT
- TABLE 111 PHOTONICS MARKET: END-USE INDUSTRY FOOTPRINT
- TABLE 112 PHOTONICS MARKET: REGION FOOTPRINT
- TABLE 113 PHOTONICS MARKET: DETAILED LIST OF KEY STARTUPS/SMES
- TABLE 114 PHOTONICS MARKET: COMPETITIVE BENCHMARKING OF KEY STARTUPS/SMES
- TABLE 115 PHOTONICS MARKET: DEALS, JANUARY 2021-MAY 2025
- TABLE 116 PHOTONICS MARKET: PRODUCT LAUNCHES, JANUARY 2021-MAY 2025
- TABLE 117 THORLABS, INC.: COMPANY OVERVIEW
- TABLE 118 THORLABS, INC.: PRODUCTS/SOLUTIONS/SERVICES OFFERED
- TABLE 119 AMS-OSRAM: COMPANY OVERVIEW
- TABLE 120 AMS-OSRAM: PRODUCTS/SOLUTIONS/SERVICES OFFERED
- TABLE 121 HAMAMATSU PHOTONICS K.K.: COMPANY OVERVIEW
- TABLE 122 HAMAMATSU PHOTONICS K.K.: PRODUCTS/SOLUTIONS/SERVICES OFFERED
- TABLE 123 LUMENTUM OPERATIONS LLC: COMPANY OVERVIEW
- TABLE 124 LUMENTUM OPERATIONS LLC,: PRODUCTS/SOLUTIONS/SERVICES OFFERED
- TABLE 125 IPG PHOTONICS CORPORATION: COMPANY OVERVIEW
- TABLE 126 IPG PHOTONICS CORPORATION: PRODUCTS/SOLUTIONS/SERVICES OFFERED
- TABLE 127 SIGNIFY HOLDING: COMPANY OVERVIEW
- TABLE 128 SIGNIFY HOLDING: PRODUCTS/SOLUTIONS/SERVICES OFFERED
- TABLE 129 CORNING INCORPORATED: COMPANY OVERVIEW
- TABLE 130 CORNING INCORPORATED: PRODUCTS/SOLUTIONS/SERVICES OFFERED
- TABLE 131 CORNING INCORPORATED: PRODUCT LAUNCHES
- TABLE 132 CORNING INCORPORATED: DEALS
- TABLE 133 ON SEMICONDUCTOR CORPORATION: COMPANY OVERVIEW
- TABLE 134 ON SEMICONDUCTOR CORPORATION.: PRODUCTS/SOLUTIONS/ SERVICES OFFERED
- TABLE 135 ON SEMICONDUCTOR CORPORATION: DEALS
- TABLE 136 OFS FITEL, LLC: COMPANY OVERVIEW
- TABLE 137 OFS FITEL, LLC.: PRODUCTS/SOLUTIONS/SERVICES OFFERED
- TABLE 138 OFS FITEL, LLC: PRODUCT LAUNCHES
- TABLE 139 COHERENT CORP: COMPANY OVERVIEW
- TABLE 140 COHERENT CORP.: PRODUCTS/SOLUTIONS/SERVICES OFFERED
- TABLE 141 NICHIA CORPORATION: COMPANY OVERVIEW
- TABLE 142 NICHIA CORPORATION: PRODUCTS/SOLUTIONS/SERVICES OFFERED
- TABLE 143 NICHIA CORPORATION: PRODUCT LAUNCHES
- TABLE 144 TOPTICA PHOTONICS: COMPANY OVERVIEW
- TABLE 145 M SQUARED LASERS LIMITED: COMPANY OVERVIEW
- TABLE 146 FREEDOM PHOTONICS LLC: COMPANY OVERVIEW
- TABLE 147 SCINTIL PHOTONICS: COMPANY OVERVIEW
- TABLE 148 PHOTONICS INDUSTRIES INTERNATIONAL. INC: COMPANY OVERVIEW
- TABLE 149 LUMILEDS HOLDINGS B.V.: COMPANY OVERVIEW
- TABLE 150 EXCELITAS TECHNOLOGIES CORP.: COMPANY OVERVIEW
- TABLE 151 TRUMPF: COMPANY OVERVIEW
- TABLE 152 EMERSON ELECTRIC CO: COMPANY OVERVIEW
- TABLE 153 SAMSUNG ELECTRONICS: COMPANY OVERVIEW
List of Figures
- FIGURE 1 PHOTONICS MARKET: SEGMENTATION AND REGIONAL SNAPSHOT
- FIGURE 2 PHOTONICS MARKET: RESEARCH DESIGN
- FIGURE 3 MARKET SIZE ESTIMATION METHODOLOGY: SUPPLY-SIDE APPROACH
- FIGURE 4 MARKET SIZE ESTIMATION METHODOLOGY: DEMAND-SIDE APPROACH
- FIGURE 5 MARKET SIZE ESTIMATION METHODOLOGY: REVENUE OF MARKET PLAYERS, 2024
- FIGURE 6 MARKET SIZE ESTIMATION METHODOLOGY: BOTTOM-UP APPROACH
- FIGURE 7 MARKET SIZE ESTIMATION METHODOLOGY: TOP-DOWN APPROACH
- FIGURE 8 PHOTONICS MARKET: DATA TRIANGULATION
- FIGURE 9 LIGHT SOURCES SEGMENT TO DOMINATE MARKET IN 2025
- FIGURE 10 SILICON SEGMENT TO REGISTER HIGHEST CAGR DURING FORECAST PERIOD
- FIGURE 11 INFORMATION & COMMUNICATION TECHNOLOGY SEGMENT TO EXHIBIT HIGHEST CAGR FROM 2025 TO 2030
- FIGURE 12 INFRARED SEGMENT TO RECORD HIGHEST CAGR BETWEEN 2025 AND 2030
- FIGURE 13 MEDIA & TELECOMMUNICATION SEGMENT TO REGISTER HIGHEST CAGR DURING FORECAST PERIOD
- FIGURE 14 ASIA PACIFIC TO REGISTER HIGHEST CAGR DURING FORECAST PERIOD
- FIGURE 15 GROWING USE OF PHOTONICS IN CONSTRUCTION AND MEDIA & TELECOMMUNICATION INDUSTRIES TO CREATE LUCRATIVE OPPORTUNITIES FOR MARKET PLAYERS
- FIGURE 16 LIGHT SOURCE SEGMENT TO REGISTER FASTEST GROWTH DURING FORECAST PERIOD
- FIGURE 17 SILICON SEGMENT TO REGISTER FASTEST GROWTH DURING FORECAST PERIOD
- FIGURE 18 INFORMATION & TELECOMMUNICATION SEGMENT TO REGISTER FASTEST GROWTH BETWEEN 2025 AND 2030
- FIGURE 19 INFRARED SEGMENT TO REGISTER FASTEST GROWTH FROM 2025 TO 2030
- FIGURE 20 OTHER END-USE INDUSTRIES SEGMENT TO REGISTER FASTEST GROWTH DURING FORECAST PERIOD
- FIGURE 21 CHINA TO REGISTER HIGHEST CAGR DURING FORECAST PERIOD
- FIGURE 22 PHOTONICS MARKET: DRIVERS, RESTRAINTS, OPPORTUNITIES, AND CHALLENGES
- FIGURE 23 PHOTONICS MARKET: USE OF GENERATIVE AI
- FIGURE 24 TRENDS/DISRUPTIONS IMPACTING CUSTOMER BUSINESS
- FIGURE 25 PHOTONICS MARKET: VALUE CHAIN ANALYSIS
- FIGURE 26 PHOTONICS MARKET: INVESTMENT AND FUNDING SCENARIO, 2023-2025 (USD MILLION)
- FIGURE 27 PHOTONICS MARKET: ECOSYSTEM ANALYSIS
- FIGURE 28 NUMBER OF PATENTS GRANTED PER YEAR, 2015-2024
- FIGURE 29 LEGAL STATUS OF PATENTS, 2015-2024
- FIGURE 30 PATENT ANALYSIS RELATED TO PHOTONICS TECHNOLOGY, BY JURISDICTION, 2015-2024
- FIGURE 31 TOP 10 COMPANIES WITH HIGHEST NUMBER OF PATENTS IN LAST 10 YEARS
- FIGURE 32 IMPORT DATA FOR HS CODE 854140-COMPLIANT PRODUCTS, BY COUNTRY, 2021-2024 (USD THOUSAND)
- FIGURE 33 EXPORT DATA FOR HS CODE 854140-COMPLIANT PRODUCTS, BY COUNTRY, 2021-2024 (USD THOUSAND)
- FIGURE 34 PHOTONICS MARKET: PORTER'S FIVE FORCES ANALYSIS
- FIGURE 35 INFLUENCE OF STAKEHOLDERS ON BUYING PROCESS FOR TOP THREE END-USE INDUSTRIES
- FIGURE 36 KEY BUYING CRITERIA FOR TOP THREE END-USE INDUSTRIES
- FIGURE 37 LIGHT SOURCES SEGMENT TO HOLD LARGEST SHARE OF PHOTONICS MARKET IN 2025
- FIGURE 38 INFRARED SEGMENT TO ACCOUNT FOR LARGEST SHARE OF PHOTONICS MARKET IN 2025
- FIGURE 39 INFORMATION & COMMUNICATION TECHNOLOGY SEGMENT TO HOLD LARGEST MARKET SHARE IN 2025
- FIGURE 40 SILICON SEGMENT TO HOLD LARGEST SHARE OF PHOTONICS MARKET IN 2025
- FIGURE 41 MEDIA & TELECOMMUNICATION SEGMENT TO LEAD PHOTONICS MARKET IN 2025
- FIGURE 42 ASIA PACIFIC TO BE FASTEST-GROWING PHOTONICS MARKET DURING FORECAST PERIOD
- FIGURE 43 ASIA PACIFIC: PHOTONICS MARKET SNAPSHOT
- FIGURE 44 NORTH AMERICA: PHOTONICS MARKET SNAPSHOT
- FIGURE 45 EUROPE: PHOTONICS MARKET SNAPSHOT
- FIGURE 46 PHOTONICS MARKET SHARE ANALYSIS, 2024
- FIGURE 47 PHOTONICS MARKET: REVENUE ANALYSIS OF KEY PLAYERS, 2020-2024 (USD BILLION)
- FIGURE 48 PHOTONICS MARKET: BRAND/PRODUCT COMPARATIVE ANALYSIS
- FIGURE 49 PHOTONICS MARKET: COMPANY EVALUATION MATRIX (KEY PLAYERS), 2024
- FIGURE 50 PHOTONICS MARKET: COMPANY FOOTPRINT
- FIGURE 51 PHOTONICS MARKET: COMPANY EVALUATION MATRIX (STARTUPS/SMES), 2024
- FIGURE 52 PHOTONICS MARKET: EV/EBITDA OF KEY VENDORS
- FIGURE 53 PHOTONICS MARKET: YEAR-TO-DATE (YTD) PRICE TOTAL RETURN, 2020-2024
- FIGURE 54 AMS-OSRAM.: COMPANY SNAPSHOT
- FIGURE 55 HAMAMATSU PHOTONICS K.K.: COMPANY SNAPSHOT
- FIGURE 56 LUMENTUM OPERATIONS LLC.: COMPANY SNAPSHOT
- FIGURE 57 IPG PHOTONICS CORPORATION.: COMPANY SNAPSHOT
- FIGURE 58 SIGNIFY HOLDING: COMPANY SNAPSHOT
- FIGURE 59 CORNING INCORPORATED: COMPANY SNAPSHOT
- FIGURE 60 ON SEMICONDUCTOR CORPORATION.: COMPANY SNAPSHOT
- FIGURE 61 COHERENT CORP.: COMPANY SNAPSHOT
 光电晶片市场分析及预测(至2035年):类型、产品类型、技术、组件、应用、材料类型、装置、最终用户、功能
 光子学市场:依产品类型、应用和终端用户产业划分 - 至2036年的全球预测光电市场分析及预测(至2035年):依类型、产品类型、服务、技术、组件、应用、材料类型、装置、最终用户、功能划分
 美国光电:市场份额分析、行业趋势和统计数据、成长预测(2026-2031)
 光电市场-全球产业规模、份额、趋势、机会及预测(依产品类型、应用、最终用户、地区及竞争格局划分,2021-2031年)光电装置市场-全球产业规模、份额、趋势、预测及机会(按产品、应用、产业、地区及竞争格局划分),2021-2031年
 2026-2030年全球光电市场
 日本光子学市场报告(按类型、应用、最终用户和地区划分,2026-2034年)
 光电市场规模、份额和成长分析(按类型、应用、最终用途产业和地区划分)-产业预测,2026-2033年
 全球光电市场:2025-2030 年预测