


 |
市场调查报告书
商品编码
1406072
投影图:市场占有率分析、产业趋势与统计、2024-2029 年成长预测Projection Mapping - Market Share Analysis, Industry Trends & Statistics, Growth Forecasts 2024 - 2029 |
||||||
※ 本网页内容可能与最新版本有所差异。详细情况请与我们联繫。
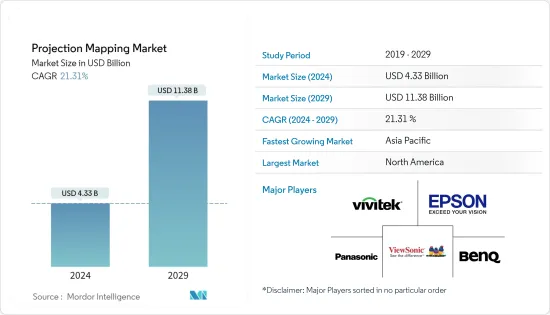
投影映射市场规模预计到 2024 年为 43.3 亿美元,到 2029 年达到 113.8 亿美元,在预测期内(2024-2029 年)复合年增长率为 21.31%。
与VR等传统增强技术不同,投影映射技术透过将CG迭加到真实表面上,将物理世界和虚拟世界无缝融合,让您无需使用眼镜等周边设备即可创建各种图像,用户可以直接体验到这种扩展。
主要亮点
- 传统投影机硬体的技术限制,例如动态范围、空间解析度、延迟、深度和色域,使得即使应用计算演算法也难以以所需的视觉品质显示所需的外观。投影映射。
- 节日活动、大型体育赛事和酒店业对投影系统的需求不断增长,以实现震撼现实和身临其境的视觉奇观,这推动了投影映射市场的成长前景。在过去的几年里,物体的 3D 投影在各种应用中获得了巨大的关注,并且随着先进的技术创新,预计机会将继续存在。预计这也将为未来几年提供有利的道路。
- 投影映射已渗透到媒体和娱乐产业以及音乐厅和产品发布会等公共活动中,以提高观众的兴奋度。投影映射在与观众产生共鸣、增加情感、鼓励更多参与方面发挥重要作用。
- 与尺寸安装类型相关的高安装成本限制了市场的扩张。此外,投影机和相关技术的持续进步等因素正在增加支出。这些原因导致客户满意度增加,因此客户转向提供经济高效服务的其他解决方案提供者。此外,缺乏技术能力和理解正在阻碍投影映射领域的扩展。
- COVID-19 大流行影响了投影映射行业,尤其是地面活动。此外,由于全球封锁以及各个场馆和遗产地的旅行和旅游活动减少,投影映射市场的成长也显着下降。例如,根据联合国世界旅游组织(UNWTO)的资料,2019年国际观光入境人数为14.66亿人次,2020年为4.095亿人次,2021年为4.462亿人次,人数大幅减少至1万人。此类案例进一步对现场活动、重大体育赛事和各种世界遗产地投影映射日益增长的需求产生了负面影响。疫情以来,各类交流活动纷纷展开,投影映射市场迅速扩大。
投影映射市场趋势
地图软体预计将占据主要市场占有率
- 投影映射软体在成本、永续性、支援、易用性、与第三方硬体的整合和相容性以及一些供应商提供的客製化解决方案方面优于硬体市场,预计也将快速成长。
- 纯地图软体供应商专注于开发投影地图工具,这些工具经过最佳化,可轻鬆实现计划部署和观众观看。例如,HeavyM 提供的 Mapping 软体解决方案是一个即用型解决方案,不需要任何动画技能即可建立投影映射效果。
- 此外,许多其他供应商还提供投影映射软体解决方案来管理复杂的操作,例如影像变形和软边缘混合。此外,高解析度投影、非刚性动态投影和局部像素辐射校正等演算法的研究和开发正在推动进一步成长。
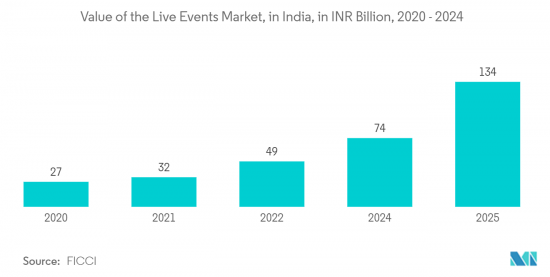
- 还有一些专为即时计划设计的软体解决方案,可帮助最终用户举办现场表演等活动。这将提高市场渗透率。据 FICCI 称,2021 年,印度各地的现场活动市场价值为 320 亿印度卢比(3.9 亿美元)。预计明年将达到 740 亿印度卢比(8.9 亿美元),复合年增长率为 32%。
亚太地区将拥有最快的市场成长
- 由于举办重大全球活动、历史博物馆的存在以及依赖旅游业作为收益来源的政府机构的存在,预计亚太地区在预测期内将显着增长。印度等该地区的国家预计将大量采用投影映射等技术,推动该地区的市场成长。举办重大世界活动、历史博物馆的存在以及政府机构对旅游业作为收入来源的重视,推动了该地区的市场成长。
- 新加坡等该地区的国家正在举办重大节日和活动,例如一年一度的新加坡之夜节、iLite Marina Bay 以及利用投影映射等技术的年度滨海湾活动,并推动该地区的市场成长。
- 印度等该地区国家预计将大量采用投影映射等技术,并利用该地区的市场成长。投影映射使计划设计师能够借助身临其境的非传统影像和声音来传达意义和讯息。因此,透过采用此类技术,预计该地区的旅游目的地数量将因该国旅游流入量的迅速增加而增加。
- 此外,全国各地的各州政府都在利用投影映射来展示其城市丰富的文化和遗产,推动投影映射市场的成长。例如,2022年12月,根据坎普尔市政专员办公室发布的公报,将于2022年12月11日至2023年1月1日在甘地·巴万·坎普尔历史悠久的建筑幕墙举行投影映射表演。直到今天免费向公众开放,传播有关这场壮观表演的信息并吸引了当地游客和游客。 30 分钟的表演将介绍坎普尔市以及围绕城市的历史和神话事实。
- 同样,2022 年 11 月,在莫德拉村(古吉拉特邦)神圣中心太阳神庙製作了一个仅由太阳能供电的新 3D 投影秀。五台科视 Christie D20WU-HS 投影机安装了 HARMAN Pro 防风雨户外建筑照明,照亮太阳神庙建筑幕墙,并在纪念碑前的水面上产生镜面效果。所有内容均透过 AV Stampful 的 PIXERA 媒体伺服器软体提供。这款强大的 64 位元系统能够透过直觉的 2D 和 3D 投影映射工作流程进行 8K 即时渲染。
投影映射产业概述
投影映射市场高度分散,主要公司包括Panasonic Corporation、Seiko Epson Corp.、明基公司、Vivitek公司和优派公司。市场参与者正在采取联盟、创新和收购等策略来加强其产品供应并获得永续的竞争优势。
2023年2月,巴可4K雷射投影机和影像处理器入选「1分钟投影映射大赛」。该活动将作为 TOKYO LIGHTS 2022 的一部分举行,TOKYO LIGHTS 2022 是由日本投影映射协会 (PMAJ) 赞助的世界上最大的国际投影映射竞赛之一。
2022 年 5 月,视觉简报和协作解决方案提供商 Vivitec 宣布推出其最新的 DLP 雷射投影机 DU4871Z。这款小巧高亮度雷射投影机的产品特点是影像品质出色、投影尺寸大。 DU4871Z 将复杂的冷却设计与先进的防尘保护相结合,以延长使用寿命。这款安全投影机还拥有多种连接选项,确保易用性和影像品质。
其他福利:
- Excel 格式的市场预测 (ME) 表
- 3 个月分析师支持
目录
第一章简介
- 研究假设和市场定义
- 调查范围
第二章调查方法
第三章执行摘要
第四章市场洞察
- 市场概况
- 产业吸引力-波特五力分析
- 供应商的议价能力
- 消费者议价能力
- 新进入者的威胁
- 替代品的威胁
- 竞争公司之间的敌对关係
- 产业价值链分析
- COVID-19 对投影映射市场的影响
第五章市场动态
- 市场驱动因素
- 对投影机投影尺寸和高亮度的需求不断增加
- 智慧城市快速发展
- 市场挑战
- 初始成本高
- 3D投影耗费大量时间
第六章市场区隔
- 副产品
- 硬体(投影机、媒体伺服器)
- 软体
- 按尺寸
- QR 图
- 3D
- 第四维度
- 按投影距离
- 标准
- 短距离
- 按用途
- 场地大
- 事件
- 节庆
- 娱乐
- 其他用途
- 按地区
- 北美洲
- 美国
- 加拿大
- 欧洲
- 德国
- 英国
- 法国
- 欧洲其他地区
- 亚太地区
- 印度
- 中国
- 日本
- 其他亚太地区
- 拉丁美洲
- 巴西
- 阿根廷
- 其他拉丁美洲
- 中东/非洲
- 阿拉伯聯合大公国
- 沙乌地阿拉伯
- 其他中东/非洲
- 北美洲
第七章 竞争形势
- 公司简介
- Panasonic Corporation
- Seiko Epson Corporation
- BenQ Corporation
- Vivitek
- ViewSonic Corporation
- Barco NV
- Digital Projection
- NEC Display Solutions
- HeavyM(Digital Essence SAS)
- Green Hippo Ltd.
- Pixel Rain Digital
第八章投资分析
第9章市场的未来
The Projection Mapping Market size is estimated at USD 4.33 billion in 2024, and is expected to reach USD 11.38 billion by 2029, growing at a CAGR of 21.31% during the forecast period (2024-2029).
Projection mapping technology has been experiencing tremendous adoption rates across the world, majorly due to its seamless integration of the physical and virtual worlds by superimposing computer-generated graphics upon real surfaces, unlike traditional augmentation technologies like VR, thus allowing various users to directly encounter this augmentation without using any peripherals, such as glasses.
Key Highlights
- The technical limitations of the conventional projector hardware, including dynamic range, spatial resolution, latency, depth-of-depth, and color gamut, make it challenging to display desired appearances in wanted visual quality, even with the application of computational algorithms, which is driving the adoption of projection mapping.
- The rising demand for projection systems for reality-smashing and immersive visual spectacles in festive occasions, mega sports events, and the hospitality industry is fostering the growth prospects for the projection mapping market. Over the past few years, 3D projection of objects has gained significant traction in various applications, and the opportunities are expected to remain lucrative with advanced technological innovations. This is expected to open lucrative avenues in the coming years as well.
- Projection mapping has penetrated the media and entertainment industry and public events, including concert halls and product launches, to hype up the audience's excitement. It plays a key role by emotionally engaging the audience, increasing the wow factor, and promoting greater participation.
- The high installation cost associated with the dimension implementation type limits market expansion. Moreover, factors such as continuous projector advancements and associated technology increase expenditures. These reasons are causing client dissatisfaction, and as a result, customers are migrating to alternative solution providers that give cost-effective services. Furthermore, a lack of technical competence and understanding impedes the expansion of the projection mapping sector.
- The COVID-19 pandemic impacted the projection mapping industry, especially land-based events, owing to the complete ban on social gathering events worldwide. Moreover, the projection mapping market also experienced a significant decline in growth due to the global lockdowns and reduction in travel and tourism activities for various venues and heritage sites. For instance, according to the data from the UNWTO, the number of international tourist arrivals was 1,466 million in 2019, which drastically reduced to 409.5 million and 446.2 million in 2020 and 2021, respectively; such instances, further negatively impacted the growth in demand of projection mapping for live events, major sports events, and various world heritage sites. Various social gathering events started post-pandemic, and the market has grown rapidly.
Projection Mapping Market Trends
Mapping Software Expected to Hold Significant Market Share
- Software for projection mapping is anticipated to witness faster growth than its hardware counterparts owing to the cost, sustainability, support, ease of use, integration/compatibility with third-party hardware, and tailored solutions offered by a few vendors.
- The pure-play mapping software vendors focus on developing projection mapping tools that make deploying projects easier and optimized for viewing the audience. For instance, The Mapping software solution provided by HeavyM is a ready-to-use solution that requires no animation skills to create projection mapping effects.
- Furthermore, many other vendors offer projection mapping software solutions that manage complexities such as s imaging warping and soft-edge blending, which is a very time-consuming process of aligning the projections and stacking projectors. Also, researchers' further developments of algorithms such as high-resolution projection, non-rigid dynamic projection, and local per-pixel radiometric compensation, among others, further elevate the growth.
- A few software solutions are also designed for real-time projects that benefit end-users to host events such as live performances. Thereby supporting better penetration of the market. According to FICCI, In 2021, the live events market across India was valued at INR 32 billion (USD 0.39 billion). It was estimated to reach INR 74 billion (USD 0.89 billion) by next year, registering a CAGR of 32%.
Asia Pacific to Witness the Fastest Market Growth
- The Asia-Pacific region is anticipated to witness major growth over the forecast period, as the region leveraging the conduction of major global events, presence of historical museums, and government bodies focusing on tourism as a source of earning elevate the growth of the market. The countries in the region, such as India, are expected to witness significant adoption of technologies such as projection mapping, leveraging the market's growth in the region. The area is leveraging the conduction of major global events, the presence of historical museums, and government bodies focusing on tourism as a source of earning, elevating the market's growth.
- The countries in the region, such as Singapore, are home to major festivals, events such as the annual Singapore Night Festival, I Light Marina Bay, and annual Marina Bay that relies on technologies such as projection mapping to leverage the growth of the market in the region.
- The countries in the region, such as India, are expected to witness significant adoption of technologies such as projection mapping, leveraging the market's growth in the region. Through projection mapping, the project designer can rely on the power of immersive, unconventional visuals and sound to convey meaning and message, often previously the scripted spoken word that movie filmmakers have at their disposal. Hence, adopting such technologies is expected to increase tourist places in the region due to a rapid increase in the country's tourism influx.
- Further, various state governments across the country are using projection mapping to show the rich culture of the cities and heritage sites, thus driving the growth of the projection mapping market. For instance, in December 2022, according to the communique issued by the divisional commissioner office, Kanpur, the Projection Mapping Show on the historical facade of Gandhi Bhawan Kanpur will be open for free from December 11, 2022, to January 1, 2023, to spread the word about the magnificent show and attract local visitors and tourists. The half-an-hour show will deliver the visitors an introduction to the city and the historical/mythological facts related to the city.
- Similarly, in November 2022, a new 3D projection show - run entirely by solar power - was created at the Modhera village's (Gujrat) holy epicenter: the Sun Temple. Five Christie D20WU-HS projectors were installed with weatherproof, outdoor architectural lights from HARMAN Pro to illuminate the Sun temple's facade and create a mirror effect in the body of water in front of the monument. All content was delivered through AV Stumpfl's PIXERA media server software, a robust 64-bit system capable of 8K real-time rendering with intuitive 2D and 3D projection mapping workflows.
Projection Mapping Industry Overview
The Projection Mapping Market is highly fragmented, with the presence of major players like Panasonic Corporation, Seiko Epson Corporation, BenQ Corporation, Vivitek, and ViewSonic Corporation. Players in the market are adopting strategies such as partnerships, innovations, and acquisitions to enhance their product offerings and gain sustainable competitive advantage.
In February 2023, Barco 4K laser projectors and image processors were selected for the "1minute Projection Mapping Competition". This event is one of the largest global international projection mapping competitions held as part of TOKYO LIGHTS 2022 and organized by the Projection Mapping Association of Japan (PMAJ).
In May 2022, Vivitek, a visual presentation and collaboration solutions provider, announced the launch of the latest addition to its DLP laser projectors, the DU4871Z. The compact, high-brightness laser projector product features include excellent image quality and large projection size. The DU4871Z combines a sophisticated cooling design and advanced dust protection to aid longevity. This secure projector also boasts a wide range of diverse connectivity options, ensuring that it is as easy to use as its image quality.
Additional Benefits:
- The market estimate (ME) sheet in Excel format
- 3 months of analyst support
TABLE OF CONTENTS
1 INTRODUCTION
- 1.1 Study Assumptions and Market Definition
- 1.2 Scope of the Study
2 RESEARCH METHODOLOGY
3 EXECUTIVE SUMMARY
4 MARKET INSIGHTS
- 4.1 Market Overview
- 4.2 Industry Attractiveness - Porter's Five Forces Analysis
- 4.2.1 Bargaining Power of Suppliers
- 4.2.2 Bargaining Power of Consumers
- 4.2.3 Threat of New Entrants
- 4.2.4 Threat of Substitutes
- 4.2.5 Intensity of Competitive Rivalry
- 4.3 Industry Value Chain Analysis
- 4.4 Impact of COVID-19 on the Projection Mapping Market
5 MARKET DYNAMICS
- 5.1 Market Drivers
- 5.1.1 Increasing Demand for Projection Size, and High Brightness of the Projectors
- 5.1.2 Rapid Growth of Smart Cities
- 5.2 Market Challenges
- 5.2.1 High Initial Costs
- 5.2.2 A lot of Time Consumption due to 3D Projection
6 MARKET SEGMENTATION
- 6.1 By Offering
- 6.1.1 Hardware (Projector, Media Server)
- 6.1.2 Software
- 6.2 By Dimension
- 6.2.1 2 Dimension
- 6.2.2 3 Dimension
- 6.2.3 4 Dimension
- 6.3 By Throw Distance
- 6.3.1 Standard
- 6.3.2 Short
- 6.4 By Application
- 6.4.1 Large Venue
- 6.4.2 Event
- 6.4.3 Festival
- 6.4.4 Entertainment
- 6.4.5 Other Applications
- 6.5 By Geography
- 6.5.1 North America
- 6.5.1.1 United States
- 6.5.1.2 Canada
- 6.5.2 Europe
- 6.5.2.1 Germany
- 6.5.2.2 United Kingdom
- 6.5.2.3 France
- 6.5.2.4 Rest of Europe
- 6.5.3 Asia Pacific
- 6.5.3.1 India
- 6.5.3.2 China
- 6.5.3.3 Japan
- 6.5.3.4 Rest of Asia Pacific
- 6.5.4 Latin America
- 6.5.4.1 Brazil
- 6.5.4.2 Argentina
- 6.5.4.3 Rest of Latin America
- 6.5.5 Middle East and Africa
- 6.5.5.1 United Arab Emirates
- 6.5.5.2 Saudi Arabia
- 6.5.5.3 Rest of Middle East and Africa
- 6.5.1 North America
7 COMPETITIVE LANDSCAPE
- 7.1 Company Profiles
- 7.1.1 Panasonic Corporation
- 7.1.2 Seiko Epson Corporation
- 7.1.3 BenQ Corporation
- 7.1.4 Vivitek
- 7.1.5 ViewSonic Corporation
- 7.1.6 Barco NV
- 7.1.7 Digital Projection
- 7.1.8 NEC Display Solutions
- 7.1.9 HeavyM (Digital Essence SAS)
- 7.1.10 Green Hippo Ltd.
- 7.1.11 Pixel Rain Digital
8 INVESTMENT ANALYSIS
9 FUTURE OF THE MARKET
 投影映射市场按组件、最终用户、安装类型和技术划分 - 2025-2032 年全球预测
 2025年全球投影映射市场报告
 全球投影映射市场研究报告 - 产业分析、规模、份额、成长、趋势及 2025 年至 2033 年预测
 投影映射市场规模、份额和增长分析(按产品、尺寸、投影距离、应用和地区)- 2025-2032 年行业预测投影製图市场:各地区,2024年~2031年
 投影映射市场 - 按产品(硬体、软体)、按尺寸(2D、3D、4D)、按投射距离(短投射、标准投射)、按应用(活动、广告和行销、娱乐、大型场馆)和预测, 2024 - 2032