


 |
市场调查报告书
商品编码
1911338
汽车引擎机油:市场占有率分析、产业趋势与统计、成长预测(2026-2031)Automotive Engine Oils - Market Share Analysis, Industry Trends & Statistics, Growth Forecasts (2026 - 2031) |
||||||
※ 本网页内容可能与最新版本有所差异。详细情况请与我们联繫。
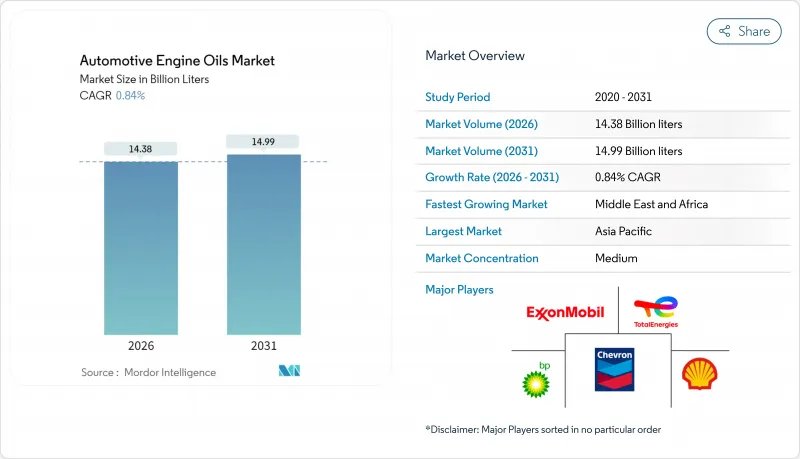
全球汽车机油市场预计将从 2025 年的 142.6 亿美元成长到 2026 年的 143.8 亿美元,预计到 2031 年将达到 149.9 亿美元,2026 年至 2031 年的复合年增长率为 0.84%。
日益严格的排放气体法规的持续实施、汽车製造商迅速转向使用低黏度合成油以及新兴经济体汽车保有量的激增,共同推动了这一谨慎的扩张。数位化零售、电子维护平台和长效换油规格也开始重塑收入结构,促进高价值配方的发展,而矿物油在对成本敏感的细分市场仍然占据主导地位。同时,假冒伪劣风险、原油价格波动以及日益严格的废油法规限制了短期盈利前景,促使企业加大对加强供应链可追溯性和循环经济的投资。
全球汽车机油市场趋势与洞察
排放气体和燃油经济性标准推动了低黏度合成油的发展
2025年3月生效的API SQ和ILSAC GF-7标准强制要求使用经证实具有燃油经济性优势的合成机油,这正推动市场需求转向0W-20和5W-30等合成机油等级。 2024年修订的欧洲ACEA标准也反映了类似的要求,OEM厂商开始在工厂灌装低黏度机油以满足欧7和CAFE标准。消费者也遵循OEM厂商的指导,即使价格更高,也加剧了从矿物油到合成油的销售转变。
透过数位化快速润滑和电子商务通路扩大应用范围
到2024年,成熟市场中约五分之一的消费用油销售将透过线上平台完成,而行动端QuickLube应用程式则透过远距离诊断优化了服务週期。福斯在东南亚的扩张,将物联网感测器与车队自动补货功能结合,正是数位化如何减少分销摩擦并凸显合成油价值提案的真实写照。
发展中市场中的仿冒品伪劣润滑油
在一些新兴市场,仿冒品占流通总量的比例高达15%。壳牌公司已引入区块链追踪和QR码包装认证,但这些系统会增加成本,并且需要对零售商进行培训。由于价格高昂,高檔合成机油的风险最大。
细分市场分析
预计到2025年,乘用车引擎油将占汽车机油市场份额的61.85%,这主要得益于OEM厂商的工厂灌装和快修服务网。摩托车机油预计将成为成长最快的市场,到2031年复合年增长率将达到0.94%,这主要受亚太地区摩托车需求激增的推动。随着日本和印度的OEM厂商指定使用能够承受高转速热循环并延长换油週期的合成油混合物,摩托车机油的品质正在不断提升。多元化生产商在采购规模和分销管道方面获得了优势。
服务于长途运输车队的二线重型机油供应稳定,但受到电气化的影响,其供应前景不确定性。然而,借助远端资讯处理技术实现的换油计画和废气后后处理装置,尤其是在充电基础设施尚不完善的地区,这类润滑油的提案得以维持。
全球汽车机油报告按产品类型(乘用车引擎油、重负荷机油、摩托车机油)、基础油(矿物油、合成油、半合成油、生物基油)和地区(亚太地区、北美地区、欧洲地区、南美地区、中东和非洲地区)进行细分。市场预测以公升为单位。
区域分析
到2025年,亚太地区将占全球销售量的43.36%,主要得益于中国2,610万辆的汽车产量以及印度不断成长的两轮车市场。东南亚国家也将带来额外的成长,抵消中国燃油车成长放缓的影响,因为主要城市的都市区车渗透率已超过35%。
中东和非洲地区将实现最快成长,到2031年复合年增长率将达到2.17%。沙乌地阿拉伯的「2030愿景」基础设施计划、阿联酋物流网络的扩张以及尼日利亚新的组装生产将共同刺激乘用车和商用车对润滑油的需求。儘管波湾合作理事会(GCC)地区内部标准的日益统一促进了跨境产品分销,但在打击假冒仿冒品和废油管理方面,相关工作仍显滞后。
北美和欧洲市场盈利尤其丰厚,主要得益于高级产品组合和低黏度合成油的广泛应用。延长换油週期、电动车专用润滑油以及数位化服务模式预示着变革即将到来,这些变革也可能波及新兴市场。然而,废油收集和全氟烷基和多氟烷基物质(PFAS)含量方面的法规带来的不利影响,正迫使研发转向更环保的化学配方。
其他福利:
- Excel格式的市场预测(ME)表
- 3个月的分析师支持
目录
第一章 引言
- 研究假设和市场定义
- 调查范围
第二章调查方法
第三章执行摘要
第四章 市场情势
- 市场概览
- 市场驱动因素
- 排放气体和燃油经济性标准推动了对低黏度合成油的需求。
- 透过数位化快速润滑和电子商务通路扩大销售范围
- 新兴市场对摩托车和乘用车的需求激增
- OEM厂商特定的长效换油週期规范提升了润滑油的价值。
- 由于聚α烯烃(PAO)和气转液(GTL)供应量的增加,合成成本降低。
- 市场限制
- 原油和基础油价格的波动给利润率带来了压力。
- 发展中市场中的仿冒品伪劣润滑油
- 加强对废油处置和回收的监管
- 价值炼和通路分析
- 波特五力模型
- 新进入者的威胁
- 供应商的议价能力
- 买方的议价能力
- 替代品的威胁
- 产业间竞争
- 法律规范
- 汽车产业的趋势
第五章 市场规模与成长预测
- 依产品类型
- 乘用车引擎机油(PCMO)
- 0W-XX
- 5W-XX
- 10W-XX
- 15W-XX
- 单级
- 其他年级
- 重型机油(HDMO)
- 0W-XX
- 5W-XX
- 10W-XX
- 15W-XX
- 单级
- 其他年级
- 摩托车机油(MCO)
- 0W-XX
- 5W-XX
- 10W-XX
- 15W-XX
- 单级
- 其他年级
- 乘用车引擎机油(PCMO)
- 依基料
- 矿物
- 合成
- 半合成
- 生物基
- 按地区
- 亚太地区
- 中国
- 印度
- 巴基斯坦
- 孟加拉
- 日本
- 韩国
- 台湾
- 澳洲
- 马来西亚
- 印尼
- 泰国
- 越南
- 亚太其他地区
- 北美洲
- 美国
- 加拿大
- 墨西哥
- 欧洲
- 德国
- 英国
- 法国
- 义大利
- 西班牙
- 北欧国家
- 俄罗斯
- 其他欧洲地区
- 南美洲
- 巴西
- 阿根廷
- 哥伦比亚
- 南美洲其他地区
- 中东和非洲
- 沙乌地阿拉伯
- 阿拉伯聯合大公国
- 卡达
- 伊朗
- 南非
- 埃及
- 奈及利亚
- 其他中东和非洲地区
- 亚太地区
第六章 竞争情势
- 市场集中度
- 策略趋势
- 市占率(%)/排名分析
- 公司简介
- BP plc
- Chevron Corporation
- China Petroleum Corporation
- CNPC
- ENEOS Corporation
- Exxon Mobil Corporation
- FUCHS
- Gazpromneft-Lubricants Ltd.
- Gulf Oil International Ltd
- Idemitsu Kosan Co., Ltd.
- Indian Oil Corporation Ltd.
- LUKOIL
- Motul
- Repsol
- Saudi Arabian Oil Co.
- Shell plc
- SK ZIC
- TotalEnergies
- Veedol Corporation Limited
第七章 市场机会与未来展望
第八章:执行长面临的关键策略挑战
The Global Automotive Engine Oils Market is expected to grow from USD 14.26 billion in 2025 to USD 14.38 billion in 2026 and is forecast to reach USD 14.99 billion by 2031 at 0.84% CAGR over 2026-2031.
Continued enforcement of more stringent emission limits, rapid OEM migration to low-viscosity synthetic grades, and the surging vehicle parc in emerging economies collectively underpin this guarded expansion. Digital retailing, e-maintenance platforms, and long-drain oil specifications have also begun to redefine the revenue mix, encouraging value-added formulations even as mineral-oil dominance persists in cost-sensitive pockets. Meanwhile, counterfeit risks, crude-price volatility, and tightening waste-oil regulations temper near-term margin prospects, prompting greater supply-chain traceability and circular-economy investments.
Global Automotive Engine Oils Market Trends and Insights
Stricter Emission and Fuel-Economy Norms Spurring Low-Viscosity Synthetics
API SQ and ILSAC GF-7 were introduced in March 2025, mandating proven fuel-economy gains that tilt demand toward 0W-20 and 5W-30 synthetic grades. European ACEA 2024 revisions echo these requirements, with OEMs factory-filling lower-viscosity oils to hit Euro 7 and CAFE thresholds. Consumer uptake follows OEM guidance, reinforcing a volume migration from mineral to synthetic products even where sticker prices remain higher.
Digital Quick-Lube and E-Commerce Channels Expanding Reach
By 2024, online platforms handled nearly one-fifth of consumer oil sales in mature markets, while mobile quick-lube apps optimized service cycles through remote diagnostics. FUCHS's Southeast Asia roll-out combines IoT sensors with automated re-ordering for fleets, illustrating how digitalization lowers distributor friction and highlights synthetic oil value propositions.
Counterfeit/Low-Quality Lubricants in Developing Markets
Fake products account for as much as 15% of volume in several emerging countries. Shell deployed blockchain tracking and QR codes to authenticate packs, yet these systems add cost and require retailer education. Premium synthetics face the greatest exposure given their higher ticket value.
Other drivers and restraints analyzed in the detailed report include:
- Emerging-Market Two-Wheeler and Passenger-Car Boom
- OEM Proprietary Long-Drain Specifications Raising Oil Value
- Stricter Used-Oil Disposal and Recycling Regulations
For complete list of drivers and restraints, kindly check the Table Of Contents.
Segment Analysis
Passenger Car Motor Oil delivered 61.85% of the automotive engine oils market share in 2025 as OEM factory fills and quick-lube networks anchored demand. Motorcycle Engine Oil posted the swiftest pace, advancing at a 0.94% CAGR through 2031 amid Asia-Pacific's two-wheeler surge. MCO premiumization is underway, with Japanese and Indian OEMs specifying synthetic blends that tolerate high-RPM heat cycles and extend drains. Manufacturers that manage multi-category portfolios gain procurement scale and channel leverage.
Second-tier Heavy Duty Motor Oil supplies long-haul fleets and remains stable but faces electrification uncertainty. Still, telematics-enabled drain planning and emissions-after-treatment devices sustain lubricant value propositions, particularly in regions where charging infrastructure remains nascent.
The Global Automotive Engine Oils Report is Segmented by Product Type (Passenger Car Motor Oil, Heavy Duty Motor Oil, and Motorcycle Engine Oil), Base Stock (Mineral, Synthetic, Semi-Synthetic, and Bio-Based), and Geography (Asia-Pacific, North America, Europe, South America, and Middle-East and Africa). The Market Forecasts are Provided in Terms of Volume (Litres).
Geography Analysis
Asia-Pacific captured 43.36% of 2025 volume, led by China's 26.1-million-unit vehicle output and India's expanding two-wheeler base. Southeast Asian nations add incremental gains, offsetting moderating Chinese ICE growth as urban EV adoption climbs beyond 35% in top cities.
The Middle East and Africa will grow the fastest at a 2.17% CAGR to 2031. Saudi Vision 2030 infrastructure projects, UAE logistics expansion, and Nigeria's nascent assembly output collectively stimulate lubricant demand across passenger and commercial fleets. Wider GCC specification harmonization eases cross-border product flows, but counterfeit policing and used-oil stewardship lag behind.
North America and Europe are buoyed by a premium mix, and the adoption of low-viscosity synthetics renders them disproportionately profitable. Extended drains, EV e-fluids, and digital service models preview shifts likely to percolate into emerging markets. Regulatory headwinds around waste-oil collection and PFAS content compel research and development redeployments toward more benign chemistries.
- BP p.l.c.
- Chevron Corporation
- China Petroleum Corporation
- CNPC
- ENEOS Corporation
- Exxon Mobil Corporation
- FUCHS
- Gazpromneft - Lubricants Ltd.
- Gulf Oil International Ltd
- Idemitsu Kosan Co., Ltd.
- Indian Oil Corporation Ltd.
- LUKOIL
- Motul
- Repsol
- Saudi Arabian Oil Co.
- Shell plc
- SK ZIC
- TotalEnergies
- Veedol Corporation Limited
Additional Benefits:
- The market estimate (ME) sheet in Excel format
- 3 months of analyst support
TABLE OF CONTENTS
1 Introduction
- 1.1 Study Assumptions and Market Definition
- 1.2 Scope of the Study
2 Research Methodology
3 Executive Summary
4 Market Landscape
- 4.1 Market Overview
- 4.2 Market Drivers
- 4.2.1 Stricter emission and fuel-economy norms spurring low-viscosity synthetics
- 4.2.2 Digital quick-lube and e-commerce channels expanding reach
- 4.2.3 Emerging-market two-wheeler and passenger-car boom
- 4.2.4 OEM proprietary long-drain specifications raising oil value
- 4.2.5 PAO (Polyalphaolefin) and GTL (Gas-to-Liquids) supply expansion lowering synthetic cost
- 4.3 Market Restraints
- 4.3.1 Volatile crude and base-oil prices compressing margins
- 4.3.2 Counterfeit/low-quality lubricants in developing markets
- 4.3.3 Stricter used-oil disposal and recycling regulations
- 4.4 Value Chain and Distribution Channel Analysis
- 4.5 Porter's Five Forces
- 4.5.1 Threat of New Entrants
- 4.5.2 Bargaining Power of Suppliers
- 4.5.3 Bargaining Power of Buyers
- 4.5.4 Threat of Substitutes
- 4.5.5 Industry Rivalry
- 4.6 Regulatory Framework
- 4.7 Automotive Industry Trends
5 Market Size and Growth Forecasts (Volume)
- 5.1 By Product Type
- 5.1.1 Passenger Car Motor Oil (PCMO)
- 5.1.1.1 0W-XX
- 5.1.1.2 5W-XX
- 5.1.1.3 10W-XX
- 5.1.1.4 15W-XX
- 5.1.1.5 Monogrades
- 5.1.1.6 Other Grades
- 5.1.2 Heavy Duty Motor Oil (HDMO)
- 5.1.2.1 0W-XX
- 5.1.2.2 5W-XX
- 5.1.2.3 10W-XX
- 5.1.2.4 15W-XX
- 5.1.2.5 Monogrades
- 5.1.2.6 Other Grades
- 5.1.3 Motorcycle Engine Oil (MCO)
- 5.1.3.1 0W-XX
- 5.1.3.2 5W-XX
- 5.1.3.3 10W-XX
- 5.1.3.4 15W-XX
- 5.1.3.5 Monogrades
- 5.1.3.6 Other Grades
- 5.1.1 Passenger Car Motor Oil (PCMO)
- 5.2 By Base Stock
- 5.2.1 Mineral
- 5.2.2 Synthetic
- 5.2.3 Semi-Synthetic
- 5.2.4 Bio-Based
- 5.3 By Geography
- 5.3.1 Asia-Pacific
- 5.3.1.1 China
- 5.3.1.2 India
- 5.3.1.3 Pakistan
- 5.3.1.4 Bangladesh
- 5.3.1.5 Japan
- 5.3.1.6 South Korea
- 5.3.1.7 Taiwan
- 5.3.1.8 Australia
- 5.3.1.9 Malaysia
- 5.3.1.10 Indonesia
- 5.3.1.11 Thailand
- 5.3.1.12 Vietnam
- 5.3.1.13 Rest of Asia-Pacific
- 5.3.2 North America
- 5.3.2.1 United States
- 5.3.2.2 Canada
- 5.3.2.3 Mexico
- 5.3.3 Europe
- 5.3.3.1 Germany
- 5.3.3.2 United Kingdom
- 5.3.3.3 France
- 5.3.3.4 Italy
- 5.3.3.5 Spain
- 5.3.3.6 Nordic Countries
- 5.3.3.7 Russia
- 5.3.3.8 Rest of Europe
- 5.3.4 South America
- 5.3.4.1 Brazil
- 5.3.4.2 Argentina
- 5.3.4.3 Colombia
- 5.3.4.4 Rest of South America
- 5.3.5 Middle-East and Africa
- 5.3.5.1 Saudi Arabia
- 5.3.5.2 United Arab Emirates
- 5.3.5.3 Qatar
- 5.3.5.4 Iran
- 5.3.5.5 South Africa
- 5.3.5.6 Egypt
- 5.3.5.7 Nigeria
- 5.3.5.8 Rest of Middle-East and Africa
- 5.3.1 Asia-Pacific
6 Competitive Landscape
- 6.1 Market Concentration
- 6.2 Strategic Moves
- 6.3 Market Share (%)/Ranking Analysis
- 6.4 Company Profiles (includes Global level Overview, Market level overview, Core Segments, Financials as available, Production Capacity, Strategic Information, Market Rank/Share for key companies, Products and Services, and Recent Developments)
- 6.4.1 BP p.l.c.
- 6.4.2 Chevron Corporation
- 6.4.3 China Petroleum Corporation
- 6.4.4 CNPC
- 6.4.5 ENEOS Corporation
- 6.4.6 Exxon Mobil Corporation
- 6.4.7 FUCHS
- 6.4.8 Gazpromneft - Lubricants Ltd.
- 6.4.9 Gulf Oil International Ltd
- 6.4.10 Idemitsu Kosan Co., Ltd.
- 6.4.11 Indian Oil Corporation Ltd.
- 6.4.12 LUKOIL
- 6.4.13 Motul
- 6.4.14 Repsol
- 6.4.15 Saudi Arabian Oil Co.
- 6.4.16 Shell plc
- 6.4.17 SK ZIC
- 6.4.18 TotalEnergies
- 6.4.19 Veedol Corporation Limited
7 Market Opportunities and Future Outlook
- 7.1 White-space and Unmet-need Assessment
8 Key Strategic Questions for CEOs
 非洲汽车机油市场份额分析、产业趋势与统计、成长预测(2026-2031)
 全球汽车添加剂市场规模、份额、趋势和成长分析报告(2026-2034)
 汽车外观化学品市场报告:按应用、最终用途和地区划分 2026-2034 年
 汽车化妆品化学品市场-全球产业规模、份额、趋势、机会和预测:按产品类型、车辆类型、销售管道、地区和竞争格局划分,2021-2031年日本汽车机油市场报告(按等级(矿物油、半合成油、全合成油)、引擎类型(汽油、柴油、替代燃料)、车辆类型(商用车、摩托车、乘用车)和地区划分,2026-2034)
 机油添加剂市场(按类型、功能、销售管道和应用)—2025-2032 年全球预测
 汽车外观化学品市场(按产品类型、车辆类型、应用、国家和地区)—2025 年至 2032 年的行业分析、市场规模、市场份额和预测
 汽车售后燃料添加剂市场:按产品类型、按燃料类型、按车辆类型、按分销管道、按最终用户、按地区汽车售后燃油添加剂市场 - 全球产业规模、份额、趋势、机会和预测,按应用、配销通路、车辆类型、地区和竞争细分,2019-2029F全球汽车售后燃料添加剂市场规模(按应用、分销管道、最终用户、地区、范围和预测)