


 |
市场调查报告书
商品编码
1440529
磷肥:全球市场占有率分析、产业趋势与统计、成长预测(2024-2030)Global Phosphatic Fertilizer - Market Share Analysis, Industry Trends & Statistics, Growth Forecasts (2024 - 2030) |
||||||
价格
※ 本网页内容可能与最新版本有所差异。详细情况请与我们联繫。
简介目录
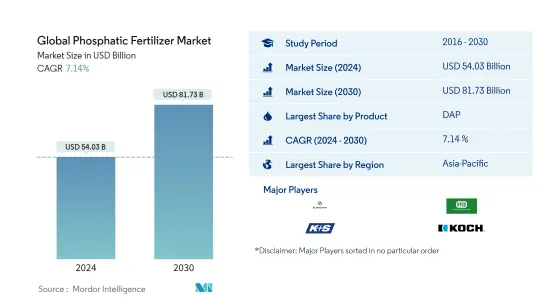
预计2024年全球磷肥市场规模为540.3亿美元,预计到2030年将达到817.3亿美元,在预测期内(2024-2030年)市场规模将增加71.4亿美元,复合年增长率为% 。
主要亮点
- 按类型划分成长最快的部分 - 过磷酸钙:由于除了磷之外还含有钙和硫,过磷酸钙肥料具有更高的农艺效益。它所含的磷与水溶性肥料的反应方式相同。
- 按作物类型分類的最大细分市场 -田间作物:田间作物在世界各地广泛种植,并且是世界许多地区的主食。在大多数农业国家,它们在单位面积中所占的份额最大。
- 以施用方式分類的最大部分 - 土壤:土壤施用是一种无需设备的便捷施肥方法。这种施用方法有助于改善植物健康和土壤肥力。
- 最大的国家 - 法国:由于化肥价格高昂,以金额为准,法国是世界上最大的磷肥消费国。但其肥料消费量较低。
磷肥市场走势
以产品划分,DAP 是最大的细分市场。
- 磷酸二铵(DAP)是全球使用最多的磷肥,占磷肥总消费量量的45.0%,2022年用量为2850万吨,市场价值177.达到6000万美元。这是由于除了作为氮源的 18.0% 的铵含量外,磷酸盐含量也高达 46.0%。
- 磷酸一铵 (MAP) 是继 DAP 之后世界上第二受欢迎的磷肥。 2022年全球MAP市场价值94.2亿美元,消费量1,260万吨。到2022年,MAP将占全球磷肥消耗总量的23.9%。
- 重过磷酸钙是一种纯磷基肥料,磷酸盐含量为46.0%,是其他纯磷肥中最高的。重过磷酸钙占全球磷肥总消费量的18.8%。 2022年全球重颗粒肥料市场价值76亿美元,消费量290万吨。
- 2022年,单一过磷酸钙占全球磷肥消耗总合的7.3%。 2022年过磷酸钙肥料市场价值为29.3亿美元,消费量为760万吨。
- 亚太地区是最大的磷肥市场,占全球磷肥市场的49%。其次是欧洲和南美洲,分别占 35% 和 16% 的份额。
- 因此,由于越来越多的农民希望提高农作物产量以及全球对磷肥的需求不断增加,作物市场预计将会成长。
亚太地区是最大的地区。
- 亚太地区主导全球磷肥市场,约占市场总量的31.36%,2021年市场价值约133亿美元。 2021年,磷酸二铵占据亚太地区磷肥市场占有率74.47%。市场。该地区对 DAP 的需求不断增长,因为它比 TSP 和 SSP 等其他磷肥具有更高的效率。
- 中国是全球主要磷肥生产国之一,2016年约占全球磷肥市场的41.4%。 2016年,中国出口占全球出口的25.3%。中国最大的进口国是印尼、澳洲和伊朗。
- 欧洲占第二大市场,2021年约占市场价值的28.53%。 2021年,TSP占最大市场占有率53.7%,田间作物领域占2021年欧洲重过磷酸钙市场最大份额。 2021 年田间作物市场价值为 48.5 亿美元,预计到预测期(2022-2028 年)结束时将达到 56.7 亿美元。
- 南美洲是第三大磷肥市场。预计 2021 年将占市占率 13.2%,预测期内复合年增长率为 7.0%。据观察,在研究期间,该地区土壤中普遍存在的磷缺乏正在推动该地区的需求。
- 全球磷肥市场的金额和数量均呈成长趋势,但 2020 年有所下降,主要是由于 COVID-19感染疾病大流行造成的中断。然而,由于全球种植面积下降,全球磷肥市场价值预计在预测期内将增加。
磷肥业概况
全球磷肥市场较为分散,前5名企业占30.22%。该市场的主要企业包括 Eurochem、IFFCO、K+S AKTIENGESELLSCHAFT、Koch Industries、Nutrien Limited(按字母顺序排列)。
其他福利
- Excel 格式的市场预测 (ME) 表
- 3 个月分析师支持
目录
第一章执行摘要和主要发现
第二章 提供报告
第三章简介
- 研究假设和市场定义
- 调查范围
- 调查方法
第四章 产业主要趋势
- 主要作物种植面积
- 平均养分施用量
- 法律规范
- 价值炼和通路分析
第五章市场区隔
- 类型
- 直的
- 磷酸盐
- DAP
- MAP
- SSP
- TSP
- 其他的
- 直的
- 如何使用
- 施肥
- 叶子
- 土壤
- 作物类型
- 田里的作物
- 园艺作物
- 草坪和装饰
- 地区
- 亚太地区
- 澳洲
- 孟加拉
- 中国
- 印度
- 印尼
- 日本
- 巴基斯坦
- 菲律宾
- 泰国
- 越南
- 其他亚太地区
- 欧洲
- 法国
- 德国
- 义大利
- 荷兰
- 俄罗斯
- 西班牙
- 乌克兰
- 英国
- 其他欧洲国家
- 中东和非洲
- 奈及利亚
- 沙乌地阿拉伯
- 南非
- 土耳其
- 其他中东和非洲
- 北美洲
- 加拿大
- 墨西哥
- 美国
- 北美其他地区
- 南美洲
- 阿根廷
- 巴西
- 南美洲其他地区
- 亚太地区
第六章 竞争形势
- 重大策略倡议
- 市场占有率分析
- 公司形势
- 公司简介
- Coromandel International Ltd.
- Eurochem
- IFFCO
- K+S AKTIENGESELLSCHAFT
- Koch Industries
- Nutrien Limited
- PhosAgro
- SABIC
第七章 CEO 面临的关键策略问题
第8章附录
- 世界概况
- 概述
- 波特的五力框架
- 全球价值链分析
- 市场动态(DRO)
- 来源和参考文献
- 表格和图形列表
- 重要见解
- 资料包
- 词彙表
简介目录
Product Code: 92581
The Global Phosphatic Fertilizer Market size is estimated at USD 54.03 billion in 2024, and is expected to reach USD 81.73 billion by 2030, growing at a CAGR of 7.14% during the forecast period (2024-2030).
Key Highlights
- Fastest growing segment by Type - SSP : SSP fertilizer has a higher agronomic advantage due to the presence of both Ca and S in addition to phosphorous. The P in it reacts similarly to the water-soluble fertilizer.
- Largest Segment by Crop Type - Field Crops : Field crops are widely cultivated worldwide and are a staple food in many parts of the world. They account for a maximum share by area in most agricultural countries.
- Largest Segment by Application Mode - Soil : Soil application is a convenient way of applying fertilizers without any equipment. This method of application helps in improving both plant health and soil fertility.
- Largest segment by Country - France : France is the world's largest consumer of phosphatic fertilizers, by value, due to the higher price of fertilizers. However, its fertilizer consumption by volume is low.
Phosphatic Fertilizers Market Trends
DAP is the largest segment by Product.
- Diammonium phosphate (DAP) is the most predominantly used phosphatic fertilizer globally, and it accounted for a share of 45.0% of the total phosphatic fertilizer consumption, with a volume of 28.5 million metric ton in 2022, with the market valued at USD 17.76 billion in the same year due to the high phosphate content of 46.0% in addition to 18.0% of ammonium, which acts as a source of nitrogen.
- Monoammonium phosphate (MAP) is the second-most preferred phosphatic fertilizer in the world after DAP. In 2022, the global MAP market was valued at USD 9.42 billion, with a volume consumption of 12.6 million metric ton. MAP accounts for a share of 23.9% of the total phosphatic fertilizers consumed globally in 2022.
- Triple superphosphate is pure phosphate-based fertilizer with a phosphate percentage of 46.0%, which is the highest among other pure phosphate fertilizers. Triple superphosphate accounted for 18.8% of the total consumption of phosphate fertilizers in the world. In 2022, the global TSP fertilizers market was valued at USD 7.6 billion, with a volume consumption of 2.9 million metric tons.
- Single superphosphate accounted for 7.3% of the total phosphatic fertilizers consumed globally in 2022. The market value for SSP fertilizer was valued at USD 2.93 billion in 2022, with a volume consumption of 7.6 million metric ton.
- Asia-Pacific is the largest market for phosphatic fertilizers, and it accounted for 49% of the global phosphatic fertilizer market. This is followed by Europe and South America, with a share of 35% and 16%, respectively.
- Hence, the market for phosphatic fertilizers is projected to grow due to the increasing global demand for phosphatic fertilizers with a rising number of farmers aiming to increase crop yield.
Asia-Pacific is the largest segment by Region.
- The Asia-Pacific region dominates the global phosphatic fertilizer market and accounted for about 31.36% of the total market value, valued at about USD 13.3 billion in 2021. In 2021, DAP occupied a market share of 74.47% in the Asia-Pacific phosphatic fertilizers market. The greater demand for DAP in the region is due to its greater efficiency than other phosphatic fertilizers like TSP and SSP.
- China was the world's leading producer of phosphorus fertilizers, accounting for nearly 41.4% of the global phosphatic fertilizer market in 2016. China's exports represented 25.3% of the world's exports in the year 2016. The top importers from China are Indonesia, Australia, and Iran.
- Europe occupies the second-largest market, which accounted for about 28.53% of the market value in 2021. TSP accounted for a maximum market share of 53.7% in 2021, and the field crops segment held the largest share of Europe's triple superphosphate market in 2021. The field crops segment was valued at USD 4.85 billion in 2021 and is expected to reach USD 5.67 billion by the end of the forecast period (2022-2028.
- South America is the third-largest phosphatic fertilizer market. It accounted for 13.2% of the market in 2021 and is estimated to register a CAGR of 7.0% during the forecast period. The prevailing phosphorous deficiency in the regional soil is observed to drive the demand of the segment during the study period.
- There is an increasing trend observed in the global phosphatic fertilizer market, both in terms of value and volume, except for a decrease in 2020, which was mainly due to the disruptions caused by the COVID-19 pandemic. However, the value of the global phosphatic fertilizer market is anticipated to increase during the forecast period, owing to a decline in cultivation areas globally.
Phosphatic Fertilizers Industry Overview
The Global Phosphatic Fertilizer Market is fragmented, with the top five companies occupying 30.22%. The major players in this market are Eurochem, IFFCO, K+S AKTIENGESELLSCHAFT, Koch Industries and Nutrien Limited (sorted alphabetically).
Additional Benefits:
- The market estimate (ME) sheet in Excel format
- 3 months of analyst support
TABLE OF CONTENTS
1 EXECUTIVE SUMMARY & KEY FINDINGS
2 REPORT OFFERS
3 INTRODUCTION
- 3.1 Study Assumptions & Market Definition
- 3.2 Scope of the Study
- 3.3 Research Methodology
4 KEY INDUSTRY TRENDS
- 4.1 Acreage Of Major Crop Types
- 4.2 Average Nutrient Application Rates
- 4.3 Regulatory Framework
- 4.4 Value Chain & Distribution Channel Analysis
5 MARKET SEGMENTATION
- 5.1 Type
- 5.1.1 Straight
- 5.1.1.1 Phosphatic
- 5.1.1.1.1 DAP
- 5.1.1.1.2 MAP
- 5.1.1.1.3 SSP
- 5.1.1.1.4 TSP
- 5.1.1.1.5 Others
- 5.1.1 Straight
- 5.2 Application Mode
- 5.2.1 Fertigation
- 5.2.2 Foliar
- 5.2.3 Soil
- 5.3 Crop Type
- 5.3.1 Field Crops
- 5.3.2 Horticultural Crops
- 5.3.3 Turf & Ornamental
- 5.4 Region
- 5.4.1 Asia-Pacific
- 5.4.1.1 Australia
- 5.4.1.2 Bangladesh
- 5.4.1.3 China
- 5.4.1.4 India
- 5.4.1.5 Indonesia
- 5.4.1.6 Japan
- 5.4.1.7 Pakistan
- 5.4.1.8 Philippines
- 5.4.1.9 Thailand
- 5.4.1.10 Vietnam
- 5.4.1.11 Rest Of Asia-Pacific
- 5.4.2 Europe
- 5.4.2.1 France
- 5.4.2.2 Germany
- 5.4.2.3 Italy
- 5.4.2.4 Netherlands
- 5.4.2.5 Russia
- 5.4.2.6 Spain
- 5.4.2.7 Ukraine
- 5.4.2.8 United Kingdom
- 5.4.2.9 Rest Of Europe
- 5.4.3 Middle East & Africa
- 5.4.3.1 Nigeria
- 5.4.3.2 Saudi Arabia
- 5.4.3.3 South Africa
- 5.4.3.4 Turkey
- 5.4.3.5 Rest Of Middle East & Africa
- 5.4.4 North America
- 5.4.4.1 Canada
- 5.4.4.2 Mexico
- 5.4.4.3 United States
- 5.4.4.4 Rest Of North America
- 5.4.5 South America
- 5.4.5.1 Argentina
- 5.4.5.2 Brazil
- 5.4.5.3 Rest Of South America
- 5.4.1 Asia-Pacific
6 COMPETITIVE LANDSCAPE
- 6.1 Key Strategic Moves
- 6.2 Market Share Analysis
- 6.3 Company Landscape
- 6.4 Company Profiles
- 6.4.1 Coromandel International Ltd.
- 6.4.2 Eurochem
- 6.4.3 IFFCO
- 6.4.4 K+S AKTIENGESELLSCHAFT
- 6.4.5 Koch Industries
- 6.4.6 Nutrien Limited
- 6.4.7 PhosAgro
- 6.4.8 SABIC
7 KEY STRATEGIC QUESTIONS FOR FERTILIZER CEOS
8 APPENDIX
- 8.1 Global Overview
- 8.1.1 Overview
- 8.1.2 Porter's Five Forces Framework
- 8.1.3 Global Value Chain Analysis
- 8.1.4 Market Dynamics (DROs)
- 8.2 Sources & References
- 8.3 List of Tables & Figures
- 8.4 Primary Insights
- 8.5 Data Pack
- 8.6 Glossary of Terms
02-2729-4219
+886-2-2729-4219
 磷肥全球市场:产业分析、规模、占有率、成长、趋势与预测(2024-2031 年)
 固态磷肥市场报告:2030 年趋势、预测与竞争分析
 磷肥市场:按产品、按应用分类 - 2025-2030 年全球预测
 全球磷肥市场:市场规模、份额、成长分析 - 按产品、按应用、产业预测(2024-2031)
 2024年磷肥全球市场报告
 全球磷肥市场 - 2023-2030
 到 2032 年的全球磷肥市场、机遇和战略
 磷肥市场:按类型、按应用划分:2021-2031 年全球机遇分析和行业预测
 全球磷肥市场:到 2028 年的预测 - 按产品(磷酸二铵、三磷酸钙和其他产品)、作物类型、形态、分销渠道、应用和地区分析