


 |
市场调查报告书
商品编码
1440530
氮肥:全球市场占有率分析、产业趋势与统计、成长预测(2024-2030)Global Nitrogenous Fertilizer - Market Share Analysis, Industry Trends & Statistics, Growth Forecasts (2024 - 2030) |
||||||
价格
※ 本网页内容可能与最新版本有所差异。详细情况请与我们联繫。
简介目录
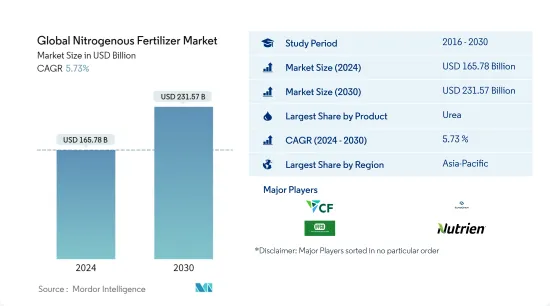
预计2024年全球氮肥市场规模为1,657.8亿美元,预计2030年将达2,315.7亿美元,在预测期间(2024-2030年)成长5.73%,复合年增长率为
主要亮点
- 按类型划分为成长最快的部分 - 无水氨:无水氨的氮含量为 82%,是所有氮肥中最高的。本产品非常适合氮消费量高的作物。
- 按作物类型分類的最大细分市场 -田间作物:田间作物在世界各地广泛种植,并且是世界许多地区的主食。在大多数农业国家,它们在单位面积中所占的份额最大。
- 以施用方式分類的最大部分 - 土壤:土壤施用是一种无需设备的便捷施肥方法。这种施用方法有助于改善植物健康和土壤肥力。
- 最大细分国家-印度:印度是全球第二大化肥消费国,2021年消费量为7,000万吨,其中尿素占总消费量的60%。
氮肥市场趋势
尿素是最大的产品领域。
- 尿素是最重要、使用最多的氮肥。 2022年,占全球氮肥消费量总量的62.5%。 2021年全球尿素市场价值455亿美元,同年消费量量1.147亿吨。
- 无水氨是所有氮肥中氮含量最高的(82.0%),氮以NH3的形式很容易取得。 2021年全球无水氨市场价值13.6亿美元,消费量280万吨。然而,无水氨作为肥料的使用仅限于北美国家,由于氮消费量较高,该地区的玉米作物普遍使用无水氨。
- 2021年氮肥中,硝酸铵以以金额为准占6.8%,以消费量量计算占10.0%。消费量比重由2017年的11.0%下降1.0%至2022年的10.0%。这可能是由于严格的规定。世界各地管理硝酸铵运输、处理和销售的法规。
- 此外,2022年,亚太地区成为氮肥最大市场,占70.0%的市场占有率。在亚太地区,中国和印度由于人口成长和耕地面积大,已成为两个最大的消费国。
- 全球氮肥市场预计将在预测期内成长,因为它是需求量最大的养分。
亚太地区是最大的地区。
- 2021年全球氮肥市场价值634亿美元,同年消费量量为1.834亿吨。
- 亚太地区是氮肥最大的消费地区,2021年市场占有率为56.7%。中国和印度是亚太地区主要农业生产国,丰富的耕地增加了粮食需求。随着人口成长和政府的大力财政支持,亚太地区的氮肥消费量预计将增加。
- 欧洲是市场第二大地区,2021年占19.0%的市占率。在其他欧洲国家,消耗大部分化肥的国家包括波兰、比利时和东南欧国家。该细分市场占欧洲氮肥市场的36.9%,2021年市场规模约48.4亿美元。预计在预测期内复合年增长率为 3.7%。
- 紧随欧洲之后的是北美和南美,市场占有率分别为 12% 和 11%。在北美,美国约占北美氮肥市场总量的82.2%,2021年达到约74.2亿美元。常规肥料占市场价值份额的63%,特种肥料约占37.0%。 2021 年。
- 氮肥是农业生产中最重要的肥料。此外,儘管由于集约化种植和增加化肥施用导致耕地面积减少,但提高产量和生产力的尝试预计将在预测期内提振全球氮肥市场。
氮肥业概况
全球氮肥市场适度整合,前5名企业占48.47%。该市场的主要企业包括(按字母顺序排列)CF Industries、Eurochem、IFFCO、Nutrien Limited 和 Yara International。
其他福利
- Excel 格式的市场预测 (ME) 表
- 3 个月分析师支持
目录
第一章执行摘要和主要发现
第二章 提供报告
第三章简介
- 研究假设和市场定义
- 调查范围
- 调查方法
第四章 产业主要趋势
- 主要作物种植面积
- 平均养分施用量
- 法律规范
- 价值炼和通路分析
第五章市场区隔
- 产品
- 硝酸铵
- 无水氨
- 尿素
- 其他的
- 型态
- 传统的
- 特别的
- CRF
- 液体肥料
- SRF
- 水溶性
- 如何使用
- 施肥
- 叶子
- 土壤
- 作物类型
- 田里的作物
- 园艺作物
- 草坪和装饰
- 地区
- 亚太地区
- 澳洲
- 孟加拉
- 中国
- 印度
- 印尼
- 日本
- 巴基斯坦
- 菲律宾
- 泰国
- 越南
- 其他亚太地区
- 欧洲
- 法国
- 德国
- 义大利
- 荷兰
- 俄罗斯
- 西班牙
- 乌克兰
- 英国
- 其他欧洲国家
- 中东和非洲
- 奈及利亚
- 沙乌地阿拉伯
- 南非
- 土耳其
- 其他中东和非洲
- 北美洲
- 加拿大
- 墨西哥
- 美国
- 北美其他地区
- 南美洲
- 阿根廷
- 巴西
- 南美洲其他地区
- 亚太地区
第六章 竞争形势
- 重大策略倡议
- 市场占有率分析
- 公司形势
- 公司简介
- CF Industries
- Compo Expert
- Coromandel International Ltd.
- Eurochem
- IFFCO
- Koch Industries
- Nutrien Limited
- SABIC
- Sociedad Quimica y Minera(SQM)
- Yara International
第七章 CEO 面临的关键策略问题
第8章附录
- 世界概况
- 概述
- 波特的五力框架
- 全球价值链分析
- 市场动态(DRO)
- 来源和参考文献
- 表格和图形列表
- 重要见解
- 资料包
- 词彙表
简介目录
Product Code: 92582
The Global Nitrogenous Fertilizer Market size is estimated at USD 165.78 billion in 2024, and is expected to reach USD 231.57 billion by 2030, growing at a CAGR of 5.73% during the forecast period (2024-2030).
Key Highlights
- Fastest growing segment by Type - Anhydrous Ammonia : Anhydrous ammonia has a nitrogen content of 82%, which is the highest among all nitrogenous fertilizers. This product is most suitable for high nitrogen-consuming crops.
- Largest Segment by Crop Type - Field Crops : Field crops are widely cultivated worldwide and are a staple food in many parts of the world. They account for a maximum share by area in most agricultural countries.
- Largest Segment by Application Mode - Soil : Soil application is a convenient way of applying fertilizers without any equipment. This method of application helps in improving both plant health and soil fertility.
- Largest segment by Country - India : India is the 2nd largest consumer of fertilizers globally with a consumption volume of 70 million metric ton in 2021 of which Urea accounts for 60% of the overall consumption.
Nitrogenous Fertilizer Market Trends
Urea is the largest segment by Product.
- Urea is the most important and most used nitrogenous fertilizer. In the year 2022, it accounted for 62.5% of the total consumption of nitrogenous fertilizers globally. The global urea market was valued at USD 45.5 billion in 2021, with a volume consumption of 114.7 million metric tons in the same year.
- Anhydrous ammonia has the highest percentage of nitrogen content (82.0%) among all nitrogenous fertilizers, with readily available nitrogen in the form of NH3. The global market for anhydrous ammonia was valued at USD 1.36 billion in the year 2021, with a volume consumption of 2.8 million metric tons. However, the usage of anhydrous ammonia as a fertilizer is restricted to the countries in North America and is commonly used in the region's corn belts since it is a high nitrogen-consuming crop.
- Ammonium nitrate accounted for 6.8% (by value) and 10.0% (by volume consumption) among nitrogenous fertilizers in 2021. The share in consumption volume decreased by 1.0% from 11.0% in 2017 to 10.0% in 2022, which can be attributed to stringent regulations regarding the transportation, handling, and sale of ammonium nitrate in various parts of the world.
- Moreover, Asia-Pacific was the largest market for nitrogenous fertilizers in 2022. It accounted for a market share of 70.0%. In the Asia-Pacific region, China and India are the two largest consumers owing to their increasing population and large areas under cultivation.
- The global nitrogenous fertilizer market is anticipated to grow during the forecast period as it is the most demanded nutrient.
Asia-Pacific is the largest segment by Region.
- The global nitrogenous fertilizer market was valued at USD 63.4 billion in 2021, with a volume consumption of 183.4 million metric tons in the same year.
- Asia-Pacific is the largest nitrogenous fertilizer-consuming region and held a market share of 56.7% in 2021. China and India are the major agricultural producers in the Asia-Pacific region, and with a large availability of arable land, growing demand for food in line with increasing population, and substantial government financial assistance, the Asia-Pacific nitrogenous fertilizer consumption is expected to increase.
- Europe is the second-largest region for the market and accounted for a share of 19.0% in 2021. In the Rest of Europe regional segment, countries that consume the majority of fertilizers include Poland, Belgium, and Southeastern European countries. The segment accounted for 36.9% in the European nitrogenous fertilizer market, valued at about USD 4.84 billion in 2021. It is anticipated to record a CAGR of 3.7% during the forecast period.
- Europe, is followed by North America and South America with market shares of 12% and 11%, respectively. In North America, the United States accounted for about 82.2% of the total North American nitrogenous fertilizer market, valued at about USD 7.42 billion in 2021. Conventional fertilizers accounted for 63% and specialty fertilizers accounted for about 37.0% of the market value share in 2021.
- Nitrogenous fertilizers are the most important fertilizers in agricultural production. Moreover, an attempt to increase the yield and productivity, despite diminishing cultivated area through intensive cultivation and increased fertilizer application, is expected to boost the global nitrogenous fertilizers market during the forecast period.
Nitrogenous Fertilizer Industry Overview
The Global Nitrogenous Fertilizer Market is moderately consolidated, with the top five companies occupying 48.47%. The major players in this market are CF Industries, Eurochem, IFFCO, Nutrien Limited and Yara International (sorted alphabetically).
Additional Benefits:
- The market estimate (ME) sheet in Excel format
- 3 months of analyst support
TABLE OF CONTENTS
1 EXECUTIVE SUMMARY & KEY FINDINGS
2 REPORT OFFERS
3 INTRODUCTION
- 3.1 Study Assumptions & Market Definition
- 3.2 Scope of the Study
- 3.3 Research Methodology
4 KEY INDUSTRY TRENDS
- 4.1 Acreage Of Major Crop Types
- 4.2 Average Nutrient Application Rates
- 4.3 Regulatory Framework
- 4.4 Value Chain & Distribution Channel Analysis
5 MARKET SEGMENTATION
- 5.1 Product
- 5.1.1 Ammonium Nitrate
- 5.1.2 Anhydrous Ammonia
- 5.1.3 Urea
- 5.1.4 Others
- 5.2 Form
- 5.2.1 Conventional
- 5.2.2 Speciality
- 5.2.2.1 CRF
- 5.2.2.2 Liquid Fertilizer
- 5.2.2.3 SRF
- 5.2.2.4 Water Soluble
- 5.3 Application Mode
- 5.3.1 Fertigation
- 5.3.2 Foliar
- 5.3.3 Soil
- 5.4 Crop Type
- 5.4.1 Field Crops
- 5.4.2 Horticultural Crops
- 5.4.3 Turf & Ornamental
- 5.5 Region
- 5.5.1 Asia-Pacific
- 5.5.1.1 Australia
- 5.5.1.2 Bangladesh
- 5.5.1.3 China
- 5.5.1.4 India
- 5.5.1.5 Indonesia
- 5.5.1.6 Japan
- 5.5.1.7 Pakistan
- 5.5.1.8 Philippines
- 5.5.1.9 Thailand
- 5.5.1.10 Vietnam
- 5.5.1.11 Rest Of Asia-Pacific
- 5.5.2 Europe
- 5.5.2.1 France
- 5.5.2.2 Germany
- 5.5.2.3 Italy
- 5.5.2.4 Netherlands
- 5.5.2.5 Russia
- 5.5.2.6 Spain
- 5.5.2.7 Ukraine
- 5.5.2.8 United Kingdom
- 5.5.2.9 Rest Of Europe
- 5.5.3 Middle East & Africa
- 5.5.3.1 Nigeria
- 5.5.3.2 Saudi Arabia
- 5.5.3.3 South Africa
- 5.5.3.4 Turkey
- 5.5.3.5 Rest Of Middle East & Africa
- 5.5.4 North America
- 5.5.4.1 Canada
- 5.5.4.2 Mexico
- 5.5.4.3 United States
- 5.5.4.4 Rest Of North America
- 5.5.5 South America
- 5.5.5.1 Argentina
- 5.5.5.2 Brazil
- 5.5.5.3 Rest Of South America
- 5.5.1 Asia-Pacific
6 COMPETITIVE LANDSCAPE
- 6.1 Key Strategic Moves
- 6.2 Market Share Analysis
- 6.3 Company Landscape
- 6.4 Company Profiles
- 6.4.1 CF Industries
- 6.4.2 Compo Expert
- 6.4.3 Coromandel International Ltd.
- 6.4.4 Eurochem
- 6.4.5 IFFCO
- 6.4.6 Koch Industries
- 6.4.7 Nutrien Limited
- 6.4.8 SABIC
- 6.4.9 Sociedad Quimica y Minera (SQM)
- 6.4.10 Yara International
7 KEY STRATEGIC QUESTIONS FOR FERTILIZER CEOS
8 APPENDIX
- 8.1 Global Overview
- 8.1.1 Overview
- 8.1.2 Porter's Five Forces Framework
- 8.1.3 Global Value Chain Analysis
- 8.1.4 Market Dynamics (DROs)
- 8.2 Sources & References
- 8.3 List of Tables & Figures
- 8.4 Primary Insights
- 8.5 Data Pack
- 8.6 Glossary of Terms
02-2729-4219
+886-2-2729-4219
 2025 年至 2033 年氮肥市场报告(按类型划分,包括尿素、硝酸铵、硫酸铵、硝酸铵钙等)、作物类型、形式、施用方式和地区
 全球氮肥市场研究报告-产业分析、规模、份额、成长、趋势与预测 2025 年至 2033 年
 氮肥市场 - 全球产业规模、份额、趋势、机会和预测,按产品、应用、地区和竞争细分,2020-2030 年2025 年氮肥全球市场报告
 氮肥市场评估:按产品类型、形式、作物类型、应用模式和地区划分的机会和预测(2018-2032 年)
 氮肥市场规模、份额、成长分析、按类型、按作物类型、按应用、按形式、按地区 - 行业预测,2024-2031 年氮肥市场:按类型、形式、产地、作物类型、应用分类 - 2025-2030 年全球预测2030 年氮肥市场预测:按产品、形式、应用和地区分類的全球分析
 氮肥市场,按产品类型、按应用、国家和地区 - 2023-2030 年行业分析、市场规模、市场份额和预测