


 |
市场调查报告书
商品编码
1440534
尿素:全球市场占有率分析、产业趋势与统计、成长预测(2024-2030)Global Urea - Market Share Analysis, Industry Trends & Statistics, Growth Forecasts (2024 - 2030) |
||||||
价格
※ 本网页内容可能与最新版本有所差异。详细情况请与我们联繫。
简介目录
预计2024年全球尿素市场规模为720.7亿美元,预计到2030年将达到1067.2亿美元,在预测期内(2024-2030年)增长6.76%,以复合年增长率增长。
主要亮点
- 按类型分類的最大量 - 直接:传统尿素是全世界消耗最多的肥料,因为氮是作物生长最产量的养分,而且农民非常适应其使用。
- 依涂层类型最大化 - 聚合物涂层:聚合物涂层肥料可在较长时间内释放养分,并减少土壤中肥料的淋失损失。它还降低了施用率。
- 最大的作物类型 -田间作物:田间作物在世界各地广泛种植,并且是世界许多地区的主食。在大多数农业国家,它们在单位面积中所占的份额最大。
尿素市场趋势
按作物类型划分,田间作物是最大的部分。
- 平均而言,田间作物比其他作物类型需要更多的氮。田间作物种植在世界形势占据主导地位,占所有农业用地的95.0%以上。水稻、小麦和玉米是世界上最重要的田间作物,约占农田总面积的38.0%。田间作物占据全球尿素市场的大部分,约占市场价值的86.1%,2021年达到约392.7亿美元。田间作物市场主要由亚太地区主导。
- 园艺作物约占尿素肥料市场总量的10.7%,到2021年将达到约49.6亿美元。世界各地对水果和蔬菜的需求正在增加,特别是在大流行之后。亚太地区在园艺作物尿素肥料市场上占据主导地位,主要是由于该地区广泛种植园艺作物。
- 北美主导草坪和观赏作物的尿素肥料市场。草坪和观赏作物约占整个市场的60.9%,2021年达到约7.864亿美元。众多高尔夫球场、运动俱乐部和私人草坪区的存在有助于该地区的市场份额优势。例如,美国的草坪覆盖了约 1500 万公顷的土地,包括所有体育场、草坪和公园。
- 至于田间作物和园艺作物,由于农业用地充足,亚太地区预计将以更快的速度成长。草坪和装饰部分生长在北美和欧洲地区。
亚太地区是最大的地区。
- 2021年全球尿素肥料市场价值455.2亿美元,消费量为1.146亿吨。
- 该地区尿素市占率最大,2021年占市占率63%。预计在预测期内复合年增长率为 5.25%。随着人口的增加,农业在区域内发展,增加了消费量并带动了市场。
- 按国家划分,2021年中国和印度分别占53.8%和19.5%的市场。消费成长主要由尿素作为直接施肥的需求所推动,占这些国家尿素总消费量的90%以上。因此,预计这些地区的尿素市场在预测期内将大幅成长。
- 北美占全球尿素市场总量的8.8%。 2021年尿素消费量量为890万吨,高于2017年的840万吨。儘管耕地面积减少,尿素消费量却从2017年的4,660万公顷增加到4,570万公顷。观察到这一趋势的原因是为了提高可用土地面积上的作物产量和生产力而增加化肥的使用。
- 基于上述因素以及提高生产力以满足不断增长的人口的需要,尿素的需求预计将增加,从而在预测期内显着提振市场。
尿素产业概况
全球尿素市场较为分散,前5名企业占18.90%。该市场的主要企业包括 CF Industries Holdings Inc、EuroChem Group、IFFCO、Nutrien Limited、Yara(按字母顺序排列)。
其他福利
- Excel 格式的市场预测 (ME) 表
- 3 个月分析师支持
目录
第一章执行摘要和主要发现
第二章 提供报告
第三章简介
- 研究假设和市场定义
- 调查范围
- 调查方法
第四章 产业主要趋势
- 主要作物种植面积
- 平均养分施用量
- 法律规范
- 价值炼和通路分析
第五章市场区隔
- 特种
- CRF
- 聚合物涂层
- 聚合物硫涂层
- 其他的
- SRF
- CRF
- 作物类型
- 田里的作物
- 园艺作物
- 草坪和装饰
- 型态
- 传统的
- 特别的
- 地区
- 亚太地区
- 澳洲
- 孟加拉
- 中国
- 印度
- 印尼
- 日本
- 巴基斯坦
- 菲律宾
- 泰国
- 越南
- 其他亚太地区
- 欧洲
- 法国
- 德国
- 义大利
- 荷兰
- 俄罗斯
- 西班牙
- 乌克兰
- 英国
- 其他欧洲国家
- 中东和非洲
- 奈及利亚
- 沙乌地阿拉伯
- 南非
- 土耳其
- 其他中东和非洲
- 北美洲
- 加拿大
- 墨西哥
- 美国
- 北美其他地区
- 南美洲
- 阿根廷
- 巴西
- 南美洲其他地区
- 亚太地区
第六章 竞争形势
- 重大策略倡议
- 市场占有率分析
- 公司形势
- 公司简介
- CF Industries Holdings Inc
- Coromandel International
- EuroChem Group
- IFFCO
- Koch Fertilizer LLC
- Nutrien Limited
- OCI NV
- SABIC
- URALCHEM JSC
- Yara
第七章 CEO 面临的关键策略问题
第8章附录
- 世界概况
- 概述
- 波特的五力框架
- 全球价值链分析
- 市场动态(DRO)
- 来源和参考文献
- 表格和图形列表
- 重要见解
- 资料包
- 词彙表
简介目录
Product Code: 92586
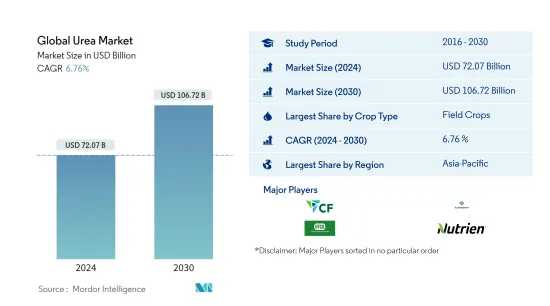
The Global Urea Market size is estimated at USD 72.07 billion in 2024, and is expected to reach USD 106.72 billion by 2030, growing at a CAGR of 6.76% during the forecast period (2024-2030).
Key Highlights
- Largest By Type - Straight : Conventional urea is the most consumed fertilizer globally, as nitrogen is the most yield-limiting nutrient for crop growth, and farmers are highly adapted to its usage.
- Largest by Coating Type - Polymer Coated : The polymer-coated fertilizers release the nutrients for a longer duration and decrease the leaching losses of fertilizers in the soil. They also reduce the application rate.
- Largest By Crop Type - Field Crops : Field crops are widely cultivated worldwide and are a staple food in many parts of the world. They account for a maximum share by area in most agricultural countries.
Urea Market Trends
Field Crops is the largest segment by Crop Type.
- Field crops, on average, require more nitrogen than other crop types. Field crop cultivation dominates the global agricultural landscape, accounting for more than 95.0% of all agricultural land. Rice, wheat, and corn are the world's most important field crops, accounting for about 38.0% of total agricultural land. Field crops dominate the global urea market, accounting for about 86.1% of the market value, amounting to around USD 39.27 billion in 2021. The Asia-Pacific region dominates the market for field crops.
- Horticultural crops accounted for about 10.7% of the total market value of urea fertilizers, amounting to around USD 4.96 billion in 2021. There is an increasing demand for fruits and vegetables around the world, particularly after the pandemic. The Asia-Pacific region dominates the urea fertilizer market for horticultural crops, primarily due to the extensive cultivation of horticultural crops in the region.
- North America dominates the urea fertilizer market in turf and ornamental crops. Turf and ornamental crops accounted for about 60.9% of the total market value, amounting to around USD 786.4 million in 2021. The presence of a large number of golf courses, sports clubs, and private lawn areas contributes to the region's dominance by share. Turf grass, for example, covers about 15.0 million hectares of land in the United States, which includes all stadiums, lawns, and parks.
- In terms of field and horticultural crops, the Asia-Pacific region is anticipated to grow at a faster rate due to the large availability of agricultural land. The turf and the ornamental segment is growing in the North American and European regions.
Asia-Pacific is the largest segment by Region.
- The global urea fertilizers market was valued at USD 45.52 billion in 2021, recording a volume consumption of 114.6 million metric tons.
- The urea market in the region occupies the largest share, accounting for 63% of the market in 2021. It is estimated to register a CAGR of 5.25% during the forecast period. With the increase in population, developments in the agriculture industries are taking place regionally, resulting in an increase in consumption, thereby driving the market.
- By country, China and India accounted for 53.8% and 19.5% of the market in 2021. Consumption growth is mainly driven by the demand for urea as a direct application fertilizer, accounting for more than 90% of the total urea consumption in these countries. Hence, the urea market in these regions is anticipated to grow significantly during the forecast period.
- North America accounted for 8.8% of the total global urea market. The consumption of urea in 2021 was 8.9 million metric tons, which increased from 8.4 million metric tons in 2017. Despite the decrease in the area under cultivation, there was an increase in the consumption of urea from 46.6 million hectares in 2017 to 45.7 million hectares in 2021. This trend was observed due to the higher usage of fertilizers to increase the yield and productivity of the crop in the available land area.
- Based on the aforementioned factors and the need for enhanced productivity to feed the increasing population, the demand for urea is expected to increase, thereby boosting the market significantly during the forecast period.
Urea Industry Overview
The Global Urea Market is fragmented, with the top five companies occupying 18.90%. The major players in this market are CF Industries Holdings Inc, EuroChem Group, IFFCO, Nutrien Limited and Yara (sorted alphabetically).
Additional Benefits:
- The market estimate (ME) sheet in Excel format
- 3 months of analyst support
TABLE OF CONTENTS
1 EXECUTIVE SUMMARY & KEY FINDINGS
2 REPORT OFFERS
3 INTRODUCTION
- 3.1 Study Assumptions & Market Definition
- 3.2 Scope of the Study
- 3.3 Research Methodology
4 KEY INDUSTRY TRENDS
- 4.1 Acreage Of Major Crop Types
- 4.2 Average Nutrient Application Rates
- 4.3 Regulatory Framework
- 4.4 Value Chain & Distribution Channel Analysis
5 MARKET SEGMENTATION
- 5.1 Speciality Type
- 5.1.1 CRF
- 5.1.1.1 Polymer Coated
- 5.1.1.2 Polymer-Sulfur Coated
- 5.1.1.3 Others
- 5.1.2 SRF
- 5.1.1 CRF
- 5.2 Crop Type
- 5.2.1 Field Crops
- 5.2.2 Horticultural Crops
- 5.2.3 Turf & Ornamental
- 5.3 Form
- 5.3.1 Conventional
- 5.3.2 Speciality
- 5.4 Region
- 5.4.1 Asia-Pacific
- 5.4.1.1 Australia
- 5.4.1.2 Bangladesh
- 5.4.1.3 China
- 5.4.1.4 India
- 5.4.1.5 Indonesia
- 5.4.1.6 Japan
- 5.4.1.7 Pakistan
- 5.4.1.8 Philippines
- 5.4.1.9 Thailand
- 5.4.1.10 Vietnam
- 5.4.1.11 Rest Of Asia-Pacific
- 5.4.2 Europe
- 5.4.2.1 France
- 5.4.2.2 Germany
- 5.4.2.3 Italy
- 5.4.2.4 Netherlands
- 5.4.2.5 Russia
- 5.4.2.6 Spain
- 5.4.2.7 Ukraine
- 5.4.2.8 United Kingdom
- 5.4.2.9 Rest Of Europe
- 5.4.3 Middle East & Africa
- 5.4.3.1 Nigeria
- 5.4.3.2 Saudi Arabia
- 5.4.3.3 South Africa
- 5.4.3.4 Turkey
- 5.4.3.5 Rest Of Middle East & Africa
- 5.4.4 North America
- 5.4.4.1 Canada
- 5.4.4.2 Mexico
- 5.4.4.3 United States
- 5.4.4.4 Rest Of North America
- 5.4.5 South America
- 5.4.5.1 Argentina
- 5.4.5.2 Brazil
- 5.4.5.3 Rest Of South America
- 5.4.1 Asia-Pacific
6 COMPETITIVE LANDSCAPE
- 6.1 Key Strategic Moves
- 6.2 Market Share Analysis
- 6.3 Company Landscape
- 6.4 Company Profiles
- 6.4.1 CF Industries Holdings Inc
- 6.4.2 Coromandel International
- 6.4.3 EuroChem Group
- 6.4.4 IFFCO
- 6.4.5 Koch Fertilizer LLC
- 6.4.6 Nutrien Limited
- 6.4.7 OCI NV
- 6.4.8 SABIC
- 6.4.9 URALCHEM JSC
- 6.4.10 Yara
7 KEY STRATEGIC QUESTIONS FOR FERTILIZER CEOS
8 APPENDIX
- 8.1 Global Overview
- 8.1.1 Overview
- 8.1.2 Porter's Five Forces Framework
- 8.1.3 Global Value Chain Analysis
- 8.1.4 Market Dynamics (DROs)
- 8.2 Sources & References
- 8.3 List of Tables & Figures
- 8.4 Primary Insights
- 8.5 Data Pack
- 8.6 Glossary of Terms
02-2729-4219
+886-2-2729-4219
 2032 年尿素市场预测:按产品类型、等级、作物类型、特种类型、技术、应用、最终用户和地区进行的全球分析
 2025年尿素全球市场报告
 工业级尿素-市场占有率分析、产业趋势与统计、成长预测(2025-2030 年)
 全球尿素市场(2018-2034)尿素市场规模、份额和成长分析(按等级、类型、应用、地区):产业预测(2024-2031)
 尿素市场:依等级、形式、通路、应用分类 - 2025-2030 年全球预测
 包膜尿素市场报告:2030 年趋势、预测与竞争分析全球尿素市场评估:依等级、形式、应用、地区、机会、预测(2017-2031)
 全球尿素市场:按等级、按应用、按最终用途行业、按产品类型、按技术、按技术、按地区 - 预测至 2029 年尿素市场:全球产业分析、规模、占有率、成长、趋势、预测,2024-2033
▼