


 |
市场调查报告书
商品编码
1685859
生物真菌:市场占有率分析、行业趋势和统计、成长预测(2025-2030 年)Biofungicides - Market Share Analysis, Industry Trends & Statistics, Growth Forecasts (2025 - 2030) |
||||||
价格
※ 本网页内容可能与最新版本有所差异。详细情况请与我们联繫。
简介目录
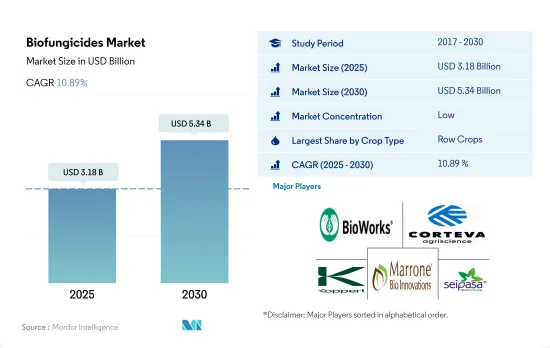
生物杀菌剂市场规模预计在 2025 年将达到 31.8 亿美元,预计到 2030 年将达到 53.4 亿美元,预测期内(2025-2030 年)的复合年增长率为 10.89%。
- 2022 年全球生物杀菌剂市场主要受连续作物生产的驱动,主要作物为大麦、玉米、小麦、油菜籽、黑麦、向日葵、大豆和水稻。这些作物以以金额为准约占全球生物杀菌剂市场的84.1%。北美在该领域占据主导地位,其中美国是领先国家,占据整个市场的 71.4%。由于美国有大量土地用于连续种植作物,预计连续作物中生物杀菌剂的消费量将持续成长。
- 园艺作物,包括香蕉、苹果、葡萄、番茄、洋葱、黄瓜和捲心菜等水果和蔬菜,在 2022 年占全球生物杀菌剂市场的 12.3%。欧洲地区占据这一子区隔,占 68.4% 的份额。义大利、法国和西班牙是该地区的主要国家,其中义大利占39.7%的份额。
- 咖啡、茶、可可、棉花、烟草、橡胶和甘蔗等经济作物占2022年全球生物杀菌剂总消费量的4.0%。欧洲地区占据此细分市场的子区隔,占有42.1%的份额。法国、德国和义大利是该地区领先的国家,其中法国占34.2%的份额。
- 由于健康问题,对有机水果和蔬菜的需求不断增加,预计将在 2023-2029 年期间进一步推动市场作物领域对生物杀菌剂的消费。
- 在农业中,芽孢桿菌、木霉菌、链霉菌和假单胞菌是最常被用作生物杀菌剂的微生物。这些微生物已被证明能有效对抗腐霉菌、立枯丝核菌、镰刀菌、核盘菌、串珠霉、灰霉病和白粉病等病原体。
- 欧洲是生物杀菌剂最大的市场,2022 年以以金额为准计算占市场份额的 41.1%。法国是欧盟的主要农业生产国。小麦、黑麦、大麦、玉米、甜菜和燕麦是该国主要种植的作物。 2022 年,法国占欧洲生物杀菌剂市场以金额为准的 27.5%。这一高份额主要归功于该国有机种植面积大,到 2022 年将占该地区有机种植总面积的 17.4%。
- 北美是生物杀菌剂的第二大消费地区,2022 年占 37.7%,价值 8.268 亿美元,预计 2029 年将达到 17.6 亿美元。在美国等北美国家,政府推出的有机认证成本分摊计划、建立成本分摊缓衝区的财政援助以及向有机农民提供低息贷款等倡议加速了生物杀菌剂的使用。预计 2023 年至 2029 年期间生物杀菌剂市场复合年增长率为 11.5%。
- 多种作用方式以及一些生物杀菌剂在生物防治和促进植物生长方面发挥的作用预计将推动全球生物杀菌剂市场的发展。预计 2023 年至 2029 年期间市场复合年增长率为 10.8%。
生物杀菌剂市场的全球趋势
在北美和欧洲,由于人们对有机农业的认识不断提高以及政府的倡议,有机农业产量达到了历史最高水准。
- 有机农业已成为永续粮食系统的主要贡献者,并已在全球 187 个国家实践。截至2021年,全球有机农地面积为7,230万公顷,2018年至2021年间各地区平均成长2.9%。有机种植面积为1,440万公顷,占有机农地总面积的19.9%。
- 有机农业最强大的市场是北美和欧洲,这两个地区占世界有机种植面积的 41.0%。 2022年,欧洲将拥有650万公顷有机耕地,占总有机耕地面积的44.1%。北美和欧洲最重要的有机种植作物是苹果、草莓、谷物和橄榄。
- 亚太地区的新兴国家也正在加入有机农业运动,并在生产和供应新鲜有机农产品方面实现自给自足,以满足国内需求。有机农业趋势在亚太地区日益兴起,2017 年至 2022 年间,该地区的有机土地面积将增加 18.8%。该地区政府的主要措施也在有机农业扩张趋势中发挥了关键作用。例如,日本的食品、农业和农村基本计画旨在2030年将有机农场和有机农地的数量增加两倍。
- 有机农业的成长源于人们对其益处的认识不断提高,例如促进土壤健康、减少环境影响和生产更健康的食品。
人均有机食品支出的成长主要出现在美国和德国,这是由消费者对更健康、更永续食品的需求所推动的。
- 过去几年,有机食品市场经历了显着成长,全球销售额预计将从 2012 年的 708 亿美元成长到 2020 年的 1,206 亿美元。有机食品的趋势受到多种因素的推动,包括消费者对更健康、更永续的食品选择的需求不断增长,以及对传统农业对环境影响的认识不断提高。预计未来几年全球有机食品市场将持续维持成长趋势。
- 根据有机贸易协会 2021 年的一项调查,当年有机水果和蔬菜的销售额成长了约 4.5%,占有机产品总销售额的 15%。北美在有机产品平均支出方面占据市场主导地位,2021年美国的人均支出达到186.7美元,是北美国家中最高的。欧洲有机食品市场预计也将强劲成长,其中德国 2021 年的人均有机食品支出最高,达到 75.6 美元。
- 有机食品市场仍由消费者可支配收入较高的已开发国家主导,但有机食品市场在新兴国家预计也将成长。例如,亚太地区的工人阶级不断壮大,这使得有机食品更容易取得且价格更便宜,有助于扩大市场。
生物杀菌剂产业概况
生物杀菌剂市场较为分散,前五大企业市占率合计为1.40%。市场的主要企业是:Bioworks Inc.、Corteva Agriscience、Koppert Biological Systems Inc.、Marrone Bio Innovations Inc. 和 Seipasa SA(按字母顺序排列)。
其他福利
- Excel 格式的市场预测 (ME) 表
- 3 个月的分析师支持
目录
第 1 章执行摘要和主要发现
第二章 报告要约
第 3 章 简介
- 研究假设和市场定义
- 研究范围
- 调查方法
第四章 产业主要趋势
- 有机栽培面积
- 有机产品人均支出
- 法律规范
- 阿根廷
- 澳洲
- 巴西
- 加拿大
- 中国
- 埃及
- 法国
- 德国
- 印度
- 印尼
- 义大利
- 日本
- 墨西哥
- 荷兰
- 奈及利亚
- 菲律宾
- 俄罗斯
- 南非
- 西班牙
- 泰国
- 土耳其
- 英国
- 美国
- 越南
- 价值链与通路分析
第五章 市场区隔
- 作物类型
- 经济作物
- 园艺作物
- 耕作作物
- 地区
- 非洲
- 按国家
- 埃及
- 奈及利亚
- 南非
- 非洲其他地区
- 亚太地区
- 按国家
- 澳洲
- 中国
- 印度
- 印尼
- 日本
- 菲律宾
- 泰国
- 越南
- 其他亚太地区
- 欧洲
- 按国家
- 法国
- 德国
- 义大利
- 荷兰
- 俄罗斯
- 西班牙
- 土耳其
- 英国
- 其他欧洲国家
- 中东
- 按国家
- 伊朗
- 沙乌地阿拉伯
- 其他中东地区
- 北美洲
- 按国家
- 加拿大
- 墨西哥
- 美国
- 北美其他地区
- 南美洲
- 按国家
- 阿根廷
- 巴西
- 南美洲其他地区
- 非洲
第六章 竞争格局
- 主要策略趋势
- 市场占有率分析
- 业务状况
- 公司简介.
- Andermatt Group AG
- Biolchim SPA
- Bioworks Inc.
- Certis USA LLC
- Corteva Agriscience
- Indogulf BioAg LLC(Biotech Division of Indogulf Company)
- Koppert Biological Systems Inc.
- Lallemand Inc.
- Marrone Bio Innovations Inc.
- Seipasa SA
第七章:执行长的关键策略问题
第 8 章 附录
- 世界概况
- 概述
- 五力分析框架
- 全球价值链分析
- 市场动态(DRO)
- 资讯来源和进一步阅读
- 图片列表
- 关键见解
- 资料包
- 词彙表
简介目录
Product Code: 48617
The Biofungicides Market size is estimated at 3.18 billion USD in 2025, and is expected to reach 5.34 billion USD by 2030, growing at a CAGR of 10.89% during the forecast period (2025-2030).
- The global biofungicides market in 2022 was primarily driven by the production of row crops, with the main crops being barley, corn, wheat, rapeseed, rye, sunflower, soybean, and rice. These crops accounted for approximately 84.1% of the global biofungicides market in terms of value. North America dominates this segment of the market, with the United States being the leading country, accounting for 71.4% of the total market value. The consumption of biofungicides in row crops is expected to continue to grow due to the considerable extent of area under the cultivation of these crops in the United States.
- Horticultural crops, including fruits and vegetables such as bananas, apples, grapes, tomatoes, onions, cucumbers, and cabbages, accounted for 12.3% of the global biofungicides market in 2022. The European region dominates this sub-segment of the market, accounting for a share of 68.4%. Italy, France, and Spain are the leading countries in this region, with Italy accounting for a share of 39.7%.
- Cash crops, including coffee, tea, cocoa, cotton, tobacco, rubber, and sugarcane, accounted for 4.0% of the total global consumption of biofungicides in 2022. The European region dominates this sub-segment of the market, accounting for a share of 42.1%. France, Germany, and Italy are the leading countries in this region, with France accounting for a share of 34.2%.
- The increased demand for organically produced fruits and vegetables, driven by health concerns, is expected to further boost the consumption of biofungicides in the crop segment of the market between 2023 and 2029.
- In agriculture, Bacillus, Trichoderma, Streptomyces, and Pseudomonas are the most commonly utilized microorganisms as bio fungicides. They have proven effective against pathogens such as Pythium, Rhizoctonia, Fusarium, Sclerotinia, Thielaviopsis, Botrytis, and powdery mildew.
- Europe is the largest market for biofungicides, accounting for a share of 41.1% in terms of value in 2022. France is the European Union's leading agricultural producer. Wheat, rye, barley, corn, sugar beet, and oats are among the major crops grown in the country. France accounted for a share of 27.5% of the European biofungicides market in terms of value in 2022. The high share percentage was primarily due to the country's extensive area under organic cultivation, accounting for 17.4% of the total organic area in the region in 2022.
- North America is the second-largest consumer of biofungicides; it accounted for a share of 37.7% in 2022, valued at USD 826.8 million, which is expected to reach USD 1.76 billion by 2029. Government initiatives in North American countries like the United States, such as the Organic Certificate cost-share program, providing financial assistance to establish a cost-share buffer zone, and low-interest loans for organic farmers, help accelerate the use of biofungicides. The biofungicides market is anticipated to register a CAGR of 11.5% between 2023 and 2029.
- The multiple modes of action and the role of a few biofungicides in both biocontrol and stimulating plant growth are expected to drive the market for biofungicides globally. The market is estimated to register a CAGR of 10.8% between 2023 and 2029.
Global Biofungicides Market Trends
Organic production is at an all-time high in North America and Europe, due to the increasing awareness and Government initiatives.
- Organic agriculture has emerged as a significant contributor to sustainable food systems, with 187 countries practicing it globally. As of 2021, there was 72.3 million ha of organic agricultural land worldwide, with an average increase of 2.9% across all regions from 2018 to 2021. Organic arable land accounted for 14.4 million ha, representing 19.9% of the total organic agricultural land.
- The strongest markets for organic farming are North America and Europe, accounting for 41.0% of the global organic arable land. In 2022, Europe had 6.5 million ha of organic arable land, equivalent to 44.1% of the overall organic arable agricultural area. The most significant crops grown organically in North America and Europe are apples, strawberries, cereals, and olives.
- Developing countries in Asia-Pacific are also joining the organic agriculture movement and becoming self-sufficient in producing and providing fresh organic produce to meet their domestic demand. The trend of organic farming is gaining momentum in Asia-Pacific, with the region recording an 18.8% increase in organic arable land from 2017 to 2022. The major initiatives by governments in the region also play a vital role in the growing trend of organic farming. For example, Japan's Basic Plan for Food, Agriculture, and Rural Areas aims to triple the number of organic farmers and lands by 2030.
- The growth of organic agriculture is driven by the rising awareness of the benefits of organic farming, such as promoting soil health, reducing environmental impacts, and producing healthier food.
Per capita spending of organic food majorly observed in United States and Germany, attributed to the consumer demand for healthier and sustainable food
- The organic food market experienced significant growth in the past few years, with global sales reaching USD 120.6 billion in 2020, up from USD 70.8 billion in 2012. The trend toward organic food is being driven by several factors, such as increasing consumer demand for healthier, more sustainable food options and a growing awareness of the environmental impact of conventional agriculture. The global organic food market is expected to continue its growth trend over the coming years.
- According to a survey conducted by the Organic Trade Association in 2021, sales of organic fruits and vegetables increased by around 4.5% in the same year, accounting for 15% of the overall organic sales. North America dominates the market in terms of average spending on organic products, with per capita spending in the United States reaching USD 186.7 in 2021, the highest among all North American countries. Europe is also expected to experience significant growth in the organic food market, with Germany accounting for the highest per capita spending of USD 75.6 in 2021.
- While the organic food market is still dominated by developed countries with high consumer disposable incomes, it is also expected to grow in developing nations. For example, the increasing number of working-class people in the Asia-Pacific region may contribute to the market's expansion due to the growing availability and affordability of organic food products.
Biofungicides Industry Overview
The Biofungicides Market is fragmented, with the top five companies occupying 1.40%. The major players in this market are Bioworks Inc., Corteva Agriscience, Koppert Biological Systems Inc., Marrone Bio Innovations Inc. and Seipasa SA (sorted alphabetically).
Additional Benefits:
- The market estimate (ME) sheet in Excel format
- 3 months of analyst support
TABLE OF CONTENTS
1 EXECUTIVE SUMMARY & KEY FINDINGS
2 REPORT OFFERS
3 INTRODUCTION
- 3.1 Study Assumptions & Market Definition
- 3.2 Scope of the Study
- 3.3 Research Methodology
4 KEY INDUSTRY TRENDS
- 4.1 Area Under Organic Cultivation
- 4.2 Per Capita Spending On Organic Products
- 4.3 Regulatory Framework
- 4.3.1 Argentina
- 4.3.2 Australia
- 4.3.3 Brazil
- 4.3.4 Canada
- 4.3.5 China
- 4.3.6 Egypt
- 4.3.7 France
- 4.3.8 Germany
- 4.3.9 India
- 4.3.10 Indonesia
- 4.3.11 Italy
- 4.3.12 Japan
- 4.3.13 Mexico
- 4.3.14 Netherlands
- 4.3.15 Nigeria
- 4.3.16 Philippines
- 4.3.17 Russia
- 4.3.18 South Africa
- 4.3.19 Spain
- 4.3.20 Thailand
- 4.3.21 Turkey
- 4.3.22 United Kingdom
- 4.3.23 United States
- 4.3.24 Vietnam
- 4.4 Value Chain & Distribution Channel Analysis
5 MARKET SEGMENTATION (includes market size in Value in USD and Volume, Forecasts up to 2030 and analysis of growth prospects)
- 5.1 Crop Type
- 5.1.1 Cash Crops
- 5.1.2 Horticultural Crops
- 5.1.3 Row Crops
- 5.2 Region
- 5.2.1 Africa
- 5.2.1.1 By Country
- 5.2.1.1.1 Egypt
- 5.2.1.1.2 Nigeria
- 5.2.1.1.3 South Africa
- 5.2.1.1.4 Rest of Africa
- 5.2.2 Asia-Pacific
- 5.2.2.1 By Country
- 5.2.2.1.1 Australia
- 5.2.2.1.2 China
- 5.2.2.1.3 India
- 5.2.2.1.4 Indonesia
- 5.2.2.1.5 Japan
- 5.2.2.1.6 Philippines
- 5.2.2.1.7 Thailand
- 5.2.2.1.8 Vietnam
- 5.2.2.1.9 Rest of Asia-Pacific
- 5.2.3 Europe
- 5.2.3.1 By Country
- 5.2.3.1.1 France
- 5.2.3.1.2 Germany
- 5.2.3.1.3 Italy
- 5.2.3.1.4 Netherlands
- 5.2.3.1.5 Russia
- 5.2.3.1.6 Spain
- 5.2.3.1.7 Turkey
- 5.2.3.1.8 United Kingdom
- 5.2.3.1.9 Rest of Europe
- 5.2.4 Middle East
- 5.2.4.1 By Country
- 5.2.4.1.1 Iran
- 5.2.4.1.2 Saudi Arabia
- 5.2.4.1.3 Rest of Middle East
- 5.2.5 North America
- 5.2.5.1 By Country
- 5.2.5.1.1 Canada
- 5.2.5.1.2 Mexico
- 5.2.5.1.3 United States
- 5.2.5.1.4 Rest of North America
- 5.2.6 South America
- 5.2.6.1 By Country
- 5.2.6.1.1 Argentina
- 5.2.6.1.2 Brazil
- 5.2.6.1.3 Rest of South America
- 5.2.1 Africa
6 COMPETITIVE LANDSCAPE
- 6.1 Key Strategic Moves
- 6.2 Market Share Analysis
- 6.3 Company Landscape
- 6.4 Company Profiles (includes Global Level Overview, Market Level Overview, Core Business Segments, Financials, Headcount, Key Information, Market Rank, Market Share, Products and Services, and Analysis of Recent Developments).
- 6.4.1 Andermatt Group AG
- 6.4.2 Biolchim SPA
- 6.4.3 Bioworks Inc.
- 6.4.4 Certis USA LLC
- 6.4.5 Corteva Agriscience
- 6.4.6 Indogulf BioAg LLC (Biotech Division of Indogulf Company)
- 6.4.7 Koppert Biological Systems Inc.
- 6.4.8 Lallemand Inc.
- 6.4.9 Marrone Bio Innovations Inc.
- 6.4.10 Seipasa SA
7 KEY STRATEGIC QUESTIONS FOR AGRICULTURAL BIOLOGICALS CEOS
8 APPENDIX
- 8.1 Global Overview
- 8.1.1 Overview
- 8.1.2 Porter's Five Forces Framework
- 8.1.3 Global Value Chain Analysis
- 8.1.4 Market Dynamics (DROs)
- 8.2 Sources & References
- 8.3 List of Tables & Figures
- 8.4 Primary Insights
- 8.5 Data Pack
- 8.6 Glossary of Terms
02-2729-4219
+886-2-2729-4219
 按作物类型、剂型、作用方式、施用方法、最终用途和分销渠道分類的杀虫剂和杀菌剂市场-全球预测,2026-2032年
 生物杀菌剂市场规模、份额和成长分析(按类型、剂型、处理类型、作物类型、最终用途和地区划分)—产业预测,2026-2033年生物杀菌剂市场依作物类型、品种、施用方式、剂型及最终用户划分-2025-2032年全球预测
 2032年生物杀菌剂市场预测:按类型、作物类型、剂型、应用模式、最终用户和地区进行的全球分析
 生物杀菌剂市场-全球产业规模、份额、趋势、机会及预测(按来源、配方、应用、地区和竞争细分,2020-2030 年)
 全球生物合理杀菌剂市场
 代森锰锌市场机会、成长动力、产业趋势分析及2025-2034年预测2032年生物合理杀菌剂市场预测:按来源、作物类型、剂型、应用、最终用户和地区分類的全球分析
 生物合理杀菌剂市场报告:2030 年趋势、预测与竞争分析
 亚太地区代森锰锌市场预测至 2030 年 - 区域分析 - 按形式、应用模式和作物类型
▼