


 |
市场调查报告书
商品编码
1443997
工程塑胶 - 市场占有率分析、产业趋势与统计、成长预测(2024 - 2029)Engineering Plastics - Market Share Analysis, Industry Trends & Statistics, Growth Forecasts (2024 - 2029) |
||||||
价格
※ 本网页内容可能与最新版本有所差异。详细情况请与我们联繫。
简介目录
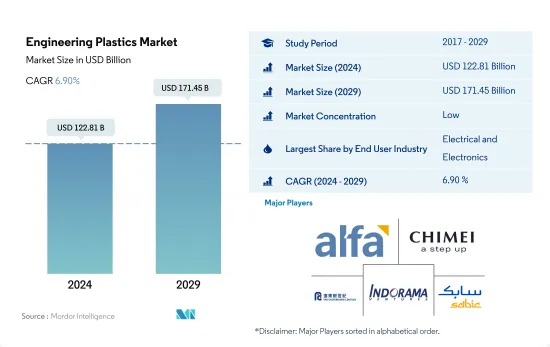
预计2024年工程塑胶市场规模为1,228.1亿美元,预计2029年将达到1,714.5亿美元,预测期(2024-2029年)CAGR为6.90%。
包装将在市场上占据主导地位
- 工程塑胶的应用范围从航空航天工业的内墙板和门到刚性和柔性包装。包装、电气电子和汽车产业推动全球工程塑胶市场的成长。 2022年,包装和电气电子分别占整个工程塑胶市场收入的24.07%和30.93%左右。
- 由于城市化和家庭人口结构变化等因素,包装行业成为全球销量最大的最终用户行业,这与对功能性、预包装和方便食品不断增长的需求相一致。 2022年全球塑胶包装产量为1.34亿吨,较2021年成长4.17%。由于消费者对包装食品和饮料的需求不断增加,全球对工程塑胶的需求增加。
- 电气和电子产业是全球第二大、成长最快的最终用户产业。 2022 年,该产业的全球收入将达到 5,800 亿美元。在美国,对电气和电子产品的需求不断增长,以及电动车、自主机器人和绝密国防技术的进入市场,预计2017年电气和电子产品的需求将以8.09%的CAGR增长。预测期( 2023-2029)。
- 航空航太业是营收成长第二快的产业,复合CAGR为 7.71%。由于对具有抗衝击性和耐化学性等性能的轻质复合材料的需求,工程塑胶的应用正在不断增长。
由于政府倡议,非洲正成为一个更大的市场
- 工程塑胶广泛应用于汽车、包装、电气和电子等各行业。 2022年全球工程塑胶收入将达1,050亿美元。
- 2022年亚太地区工程塑胶消费额较2021年成长7.18%,占最大,达55.62%。这归因于包装和电气电子行业,按价值计算,这两个行业分别占了 18.52% 和 42.25% 的市场份额。随着即食方便食品的需求不断增长,包装材料的消耗量也随之增加,从而提振了该地区工程塑胶的销售。对电子设备的需求激增是公司采用在家工作模式和人们设立家庭办公室的结果。
- 非洲是工程塑胶消费成长最快的地区,2022年其价值较2021年增长7.39%,其中建筑业引领,预计复合CAGR为6.56% ,按数量计算,在预测期内。预计2023年南非新增建筑面积约8,817万平方英尺,预计到2029年将达到1.0169亿平方英尺,从而增加预测期内该国对工程塑胶的需求。
- 预计在预测期内(2023年至2029年),该市场的CAGR将达到6.94%,其中电气和电子行业的CAGR最高,为8.09%。使用先进材料、有机电子产品和塑胶复合材料可以实现智慧製造实践,并成为该行业的成长动力。
全球工程塑胶市场趋势
电子产业的技术进步可能促进成长
- 电子产品技术创新的快速步伐,推动人们对新型、快速的电气电子产品的持续需求。 2022年,全球电气和电子产品收入为58,070亿美元,亚太地区占74%的市场份额,其次是欧洲,占13%的份额。预计全球电气和电子市场在预测期内复合CAGR为6.71%。
- 2018年,中国、韩国、日本、印度、东协国家工业化快速发展,亚太地区经济成长强劲。 2020年,受疫情影响,全球电子电气生产因晶片短缺、供应链效率低而放缓,导致营收成长速度较前一年停滞0.1%。这一增长是由远距工作和家庭娱乐消费性电子产品的需求推动的,因为人们在大流行期间被迫留在室内。
- 对数位化、机器人、虚拟实境、扩增实境、物联网和 5G 连接等先进技术的需求预计在预测期内将增长。预计到 2027 年,全球电气和电子产品产量将成长 5.9%。由于技术进步,消费性电子产品的需求预计在预测期内将成长。例如,预计 2027 年全球消费性电子产业的收入将达到约 9,046 亿美元,而 2023 年为 7,191 亿美元。因此,科技发展预计将引领 2027 年电气和电子产品的需求。预测期。
工程塑胶行业概况
工程塑胶市场较为分散,前五名企业占22.10%。该市场的主要参与者包括 Alfa SAB de CV、奇美、远东新世纪公司、Indorama Ventures Public Company Limited 和 SABIC(按字母顺序排列)。
额外的好处:
- Excel 格式的市场估算 (ME) 表
- 3 个月的分析师支持
目录
第 1 章:执行摘要和主要发现
第 2 章:报告报价
第 3 章:简介
- 研究假设和市场定义
- 研究范围
- 研究方法论
第 4 章:主要产业趋势
- 最终用户趋势
- 航太
- 汽车
- 建筑与施工
- 电气和电子
- 包装
- 进出口趋势
- 氟聚合物贸易
- 聚酰胺 (PA) 贸易
- 聚碳酸酯(PC)贸易
- 聚对苯二甲酸乙二酯(PET)贸易
- 聚甲基丙烯酸甲酯(PMMA)贸易
- 聚甲醛(POM)贸易
- 苯乙烯共聚物(ABS 和 SAN)贸易
- 价格趋势
- 回收概述
- 聚酰胺 (PA) 回收趋势
- 聚碳酸酯 (PC) 回收趋势
- 聚对苯二甲酸乙二酯(PET) 回收趋势
- 苯乙烯共聚物(ABS 和 SAN)回收趋势
- 规范架构
- 阿根廷
- 澳洲
- 巴西
- 加拿大
- 中国
- 欧洲联盟
- 印度
- 日本
- 马来西亚
- 墨西哥
- 奈及利亚
- 俄罗斯
- 沙乌地阿拉伯
- 南非
- 韩国
- 阿拉伯聯合大公国
- 英国
- 美国
- 价值炼和配销通路分析
第 5 章:市场区隔(包括美元价值和数量的市场规模、截至 2029 年的预测以及成长前景分析)
- 最终用户产业
- 航太
- 汽车
- 建筑与施工
- 电气和电子
- 工业及机械
- 包装
- 其他最终用户产业
- 树脂类型
- 含氟聚合物
- 按子树脂类型
- 乙烯四氟乙烯 (ETFE)
- 氟化乙烯丙烯 (FEP)
- 聚四氟乙烯 (PTFE)
- 聚氟乙烯 (PVF)
- 聚偏二氟乙烯 (PVDF)
- 其他子树脂类型
- 液晶聚合物(LCP)
- 聚酰胺 (PA)
- 按子树脂类型
- 芳纶
- 聚酰胺 (PA) 6
- 聚酰胺 (PA) 66
- 聚邻苯二甲酰胺
- 聚对苯二甲酸丁二醇酯 (PBT)
- 聚碳酸酯(PC)
- 聚醚醚酮 (PEEK)
- 聚对苯二甲酸乙二酯(PET)
- 聚酰亚胺 (PI)
- 聚甲基丙烯酸甲酯 (PMMA)
- 聚甲醛 (POM)
- 苯乙烯共聚物(ABS 和 SAN)
- 含氟聚合物
- 地区
- 非洲
- 按国家/地区
- 奈及利亚
- 南非
- 非洲其他地区
- 亚太
- 按国家/地区
- 澳洲
- 中国
- 印度
- 日本
- 马来西亚
- 韩国
- 亚太其他地区
- 欧洲
- 按国家/地区
- 法国
- 德国
- 义大利
- 俄罗斯
- 英国
- 欧洲其他地区
- 中东
- 按国家/地区
- 沙乌地阿拉伯
- 阿拉伯聯合大公国
- 中东其他地区
- 北美洲
- 按国家/地区
- 加拿大
- 墨西哥
- 美国
- 南美洲
- 按国家/地区
- 阿根廷
- 巴西
- 南美洲其他地区
- 非洲
第 6 章:竞争格局
- 关键策略倡议
- 市占率分析
- 公司概况
- 公司简介(包括全球概况、市场概况、核心业务部门、财务状况、员工人数、关键资讯、市场排名、市场份额、产品和服务以及近期发展分析)。
- Alfa SAB de CV
- BASF SE
- Celanese Corporation
- CHIMEI
- Covestro AG
- Dongyue Group
- DuPont
- Far Eastern New Century Corporation
- Indorama Ventures Public Company Limited
- LG Chem
- Mitsubishi Chemical Corporation
- SABIC
- Solvay
- Toray Industries, Inc.
- Victrex
CHAPTER 7 : CEOへの主な戦略的质问
第 8 章:附录
- 全球概况
- 概述
- 波特五力框架(产业吸引力分析)
- 全球价值链分析
- 市场动态 (DRO)
- 来源和参考文献
- 表格和图表清单
- 主要见解
- 数据包
- 专业术语
简介目录
Product Code: 50285
The Engineering Plastics Market size is estimated at USD 122.81 billion in 2024, and is expected to reach USD 171.45 billion by 2029, growing at a CAGR of 6.90% during the forecast period (2024-2029).
Packaging to dominate the volume share in the market
- Engineering plastics have applications ranging from interior wall panels and doors in the aerospace industry to rigid and flexible packaging. The packaging, electrical and electronics, and automotive industries drive the growth of the global engineering plastics market. Packaging and electrical and electronics accounted for around 24.07% and 30.93%, respectively, of the overall engineering plastics market revenue in 2022.
- As a result of factors such as urbanization and changing family demographics, the packaging industry is the world's largest end-user industry in terms of volume, in line with the growing demand for functional, prepackaged, and convenient food products. Global plastic packaging production witnessed a volume of 134 million tons in 2022, 4.17% higher compared to 2021. The demand for engineering plastics globally increased owing to the increasing consumer demand for packaged food and beverages.
- The electrical and electronics industry is the second-largest and fastest-growing end-user industry globally. The industry generated a revenue of USD 580 billion in 2022 at the global level. In the United States, the growing demand for electrical and electronics products and the entry of electric vehicles, autonomous robots, and top-secret defense technologies in the market are expected to increase the demand for electrical and electronics products at a CAGR of 8.09% during the forecast period (2023-2029).
- The aerospace industry is the second fastest-growing industry by revenue, with a CAGR of 7.71%. The application of engineering plastics is growing due to the need for lightweight composite materials with properties like impact and chemical resistance.
Africa emerging as a greater market owing to government initiatives
- Engineering plastics find applications in various industries, such as automotive, packaging, and electrical and electronics. Engineering plastics at the global level had a revenue of USD 105 billion in 2022.
- Engineering plastic consumption in Asia-Pacific witnessed a growth of 7.18%, by value, in 2022 compared to 2021 and had the largest share of 55.62%. This was attributed to the packaging and electrical and electronics industries, which held 18.52% and 42.25% of the market shares, respectively, by value. With the rising demand for ready-to-eat convenience food, the consumption of packaging materials has increased, bolstering the sales of engineering plastics in the region. The surge in demand for electronic devices is a consequence of companies adopting work-from-home models and people setting up home offices.
- Africa is the fastest-growing region for the consumption of engineering plastics, and it witnessed a growth of 7.39% in terms of value in 2022 compared to 2021, led by the building and construction industry, which is expected to record a CAGR of 6.56%, by volume, during the forecast period. South Africa is expected to have around 88.17 million sq. ft of new floor area in 2023, and it is forecast to reach 101.69 million sq. ft by 2029, thereby increasing the demand for engineering plastics in the country during the forecast period.
- The market is expected to record a CAGR of 6.94% during the forecast period (2023-2029), with the electrical and electronics industry reporting the highest CAGR of 8.09% by value. Using advanced materials, organic electronics, and plastic composites may enable smart manufacturing practices and work as growth drivers for the industry.
Global Engineering Plastics Market Trends
Technological advancements in electronics industry may foster the growth
- The rapid pace of technological innovation in electronic products is driving the consistent demand for new and fast electrical and electronic products. In 2022, the global revenue of electrical and electronics stood at USD 5,807 billion, with Asia-Pacific holding a 74% market share, followed by Europe with a 13% share. The global electrical and electronics market is expected to record a CAGR of 6.71% during the forecast period.
- In 2018, the Asia-Pacific region witnessed strong economic growth owing to rapid industrialization in China, South Korea, Japan, India, and ASEAN countries. In 2020, due to the pandemic, there was a slowdown in global electrical and electronics production due to the shortage of chips and inefficiencies in the supply chain, which led to a stagnant growth rate of 0.1% in revenue compared to the previous year. This growth was driven by the demand for consumer electronics for remote working and home entertainment as people were forced to remain indoors during the pandemic.
- The demand for advanced technologies, such as digitalization, robotics, virtual reality, augmented reality, IoT (Internet of Things), and 5G connectivity, is expected to grow during the forecast period. Global electrical and electronics production is expected to register a growth rate of 5.9% in 2027. As a result of technological advancements, the demand for consumer electronics is expected to rise during the forecast period. For instance, the global consumer electronics industry is projected to witness a revenue reach of around USD 904.6 billion in 2027, compared to USD 719.1 billion in 2023. As a result, technological development is projected to lead the demand for electrical and electronic products during the forecast period.
Engineering Plastics Industry Overview
The Engineering Plastics Market is fragmented, with the top five companies occupying 22.10%. The major players in this market are Alfa S.A.B. de C.V., CHIMEI, Far Eastern New Century Corporation, Indorama Ventures Public Company Limited and SABIC (sorted alphabetically).
Additional Benefits:
- The market estimate (ME) sheet in Excel format
- 3 months of analyst support
TABLE OF CONTENTS
1 EXECUTIVE SUMMARY & KEY FINDINGS
2 REPORT OFFERS
3 INTRODUCTION
- 3.1 Study Assumptions & Market Definition
- 3.2 Scope of the Study
- 3.3 Research Methodology
4 KEY INDUSTRY TRENDS
- 4.1 End User Trends
- 4.1.1 Aerospace
- 4.1.2 Automotive
- 4.1.3 Building and Construction
- 4.1.4 Electrical and Electronics
- 4.1.5 Packaging
- 4.2 Import And Export Trends
- 4.2.1 Fluoropolymer Trade
- 4.2.2 Polyamide (PA) Trade
- 4.2.3 Polycarbonate (PC) Trade
- 4.2.4 Polyethylene Terephthalate (PET) Trade
- 4.2.5 Polymethyl Methacrylate (PMMA) Trade
- 4.2.6 Polyoxymethylene (POM) Trade
- 4.2.7 Styrene Copolymers (ABS and SAN) Trade
- 4.3 Price Trends
- 4.4 Recycling Overview
- 4.4.1 Polyamide (PA) Recycling Trends
- 4.4.2 Polycarbonate (PC) Recycling Trends
- 4.4.3 Polyethylene Terephthalate (PET) Recycling Trends
- 4.4.4 Styrene Copolymers (ABS and SAN) Recycling Trends
- 4.5 Regulatory Framework
- 4.5.1 Argentina
- 4.5.2 Australia
- 4.5.3 Brazil
- 4.5.4 Canada
- 4.5.5 China
- 4.5.6 EU
- 4.5.7 India
- 4.5.8 Japan
- 4.5.9 Malaysia
- 4.5.10 Mexico
- 4.5.11 Nigeria
- 4.5.12 Russia
- 4.5.13 Saudi Arabia
- 4.5.14 South Africa
- 4.5.15 South Korea
- 4.5.16 United Arab Emirates
- 4.5.17 United Kingdom
- 4.5.18 United States
- 4.6 Value Chain & Distribution Channel Analysis
5 MARKET SEGMENTATION (includes market size in Value in USD and Volume, Forecasts up to 2029 and analysis of growth prospects)
- 5.1 End User Industry
- 5.1.1 Aerospace
- 5.1.2 Automotive
- 5.1.3 Building and Construction
- 5.1.4 Electrical and Electronics
- 5.1.5 Industrial and Machinery
- 5.1.6 Packaging
- 5.1.7 Other End-user Industries
- 5.2 Resin Type
- 5.2.1 Fluoropolymer
- 5.2.1.1 By Sub Resin Type
- 5.2.1.1.1 Ethylenetetrafluoroethylene (ETFE)
- 5.2.1.1.2 Fluorinated Ethylene-propylene (FEP)
- 5.2.1.1.3 Polytetrafluoroethylene (PTFE)
- 5.2.1.1.4 Polyvinylfluoride (PVF)
- 5.2.1.1.5 Polyvinylidene Fluoride (PVDF)
- 5.2.1.1.6 Other Sub Resin Types
- 5.2.2 Liquid Crystal Polymer (LCP)
- 5.2.3 Polyamide (PA)
- 5.2.3.1 By Sub Resin Type
- 5.2.3.1.1 Aramid
- 5.2.3.1.2 Polyamide (PA) 6
- 5.2.3.1.3 Polyamide (PA) 66
- 5.2.3.1.4 Polyphthalamide
- 5.2.4 Polybutylene Terephthalate (PBT)
- 5.2.5 Polycarbonate (PC)
- 5.2.6 Polyether Ether Ketone (PEEK)
- 5.2.7 Polyethylene Terephthalate (PET)
- 5.2.8 Polyimide (PI)
- 5.2.9 Polymethyl Methacrylate (PMMA)
- 5.2.10 Polyoxymethylene (POM)
- 5.2.11 Styrene Copolymers (ABS and SAN)
- 5.2.1 Fluoropolymer
- 5.3 Region
- 5.3.1 Africa
- 5.3.1.1 By Country
- 5.3.1.1.1 Nigeria
- 5.3.1.1.2 South Africa
- 5.3.1.1.3 Rest of Africa
- 5.3.2 Asia-Pacific
- 5.3.2.1 By Country
- 5.3.2.1.1 Australia
- 5.3.2.1.2 China
- 5.3.2.1.3 India
- 5.3.2.1.4 Japan
- 5.3.2.1.5 Malaysia
- 5.3.2.1.6 South Korea
- 5.3.2.1.7 Rest of Asia-Pacific
- 5.3.3 Europe
- 5.3.3.1 By Country
- 5.3.3.1.1 France
- 5.3.3.1.2 Germany
- 5.3.3.1.3 Italy
- 5.3.3.1.4 Russia
- 5.3.3.1.5 United Kingdom
- 5.3.3.1.6 Rest of Europe
- 5.3.4 Middle East
- 5.3.4.1 By Country
- 5.3.4.1.1 Saudi Arabia
- 5.3.4.1.2 United Arab Emirates
- 5.3.4.1.3 Rest of Middle East
- 5.3.5 North America
- 5.3.5.1 By Country
- 5.3.5.1.1 Canada
- 5.3.5.1.2 Mexico
- 5.3.5.1.3 United States
- 5.3.6 South America
- 5.3.6.1 By Country
- 5.3.6.1.1 Argentina
- 5.3.6.1.2 Brazil
- 5.3.6.1.3 Rest of South America
- 5.3.1 Africa
6 COMPETITIVE LANDSCAPE
- 6.1 Key Strategic Moves
- 6.2 Market Share Analysis
- 6.3 Company Landscape
- 6.4 Company Profiles (includes Global Level Overview, Market Level Overview, Core Business Segments, Financials, Headcount, Key Information, Market Rank, Market Share, Products and Services, and Analysis of Recent Developments).
- 6.4.1 Alfa S.A.B. de C.V.
- 6.4.2 BASF SE
- 6.4.3 Celanese Corporation
- 6.4.4 CHIMEI
- 6.4.5 Covestro AG
- 6.4.6 Dongyue Group
- 6.4.7 DuPont
- 6.4.8 Far Eastern New Century Corporation
- 6.4.9 Indorama Ventures Public Company Limited
- 6.4.10 LG Chem
- 6.4.11 Mitsubishi Chemical Corporation
- 6.4.12 SABIC
- 6.4.13 Solvay
- 6.4.14 Toray Industries, Inc.
- 6.4.15 Victrex
7 KEY STRATEGIC QUESTIONS FOR ENGINEERING PLASTICS CEOS
8 APPENDIX
- 8.1 Global Overview
- 8.1.1 Overview
- 8.1.2 Porter's Five Forces Framework (Industry Attractiveness Analysis)
- 8.1.3 Global Value Chain Analysis
- 8.1.4 Market Dynamics (DROs)
- 8.2 Sources & References
- 8.3 List of Tables & Figures
- 8.4 Primary Insights
- 8.5 Data Pack
- 8.6 Glossary of Terms
02-2729-4219
+886-2-2729-4219
 日本工程塑胶:市场占有率分析、产业趋势/统计、成长预测(2024-2029)
 2024年工程塑胶全球市场报告
 工程塑胶化合物市场 - 2023-2031 年全球产业分析、规模、份额、成长、趋势和预测
 聚缩醛市场:按类型、等级和最终用户划分 - 2023-2030 年全球预测
 工程塑胶情报中心
 工程塑料市场:按类型、按用途- 俄罗斯-乌克兰衝突、高通胀的累积影响 - 2023-2030 年全球预测
 工程塑料市场:2023-2028年全球行业趋势、份额、规模、增长、机会和预测
 全球工程塑料市场 - 2023-2030
 到 2028 年工程塑料市场预测 - 按产品类型、最终用户和地区分列的全球分析
 工程塑胶的全球市场
▼