


 |
市场调查报告书
商品编码
1850987
第三方物流:市场份额分析、行业趋势、统计数据和成长预测(2025-2030 年)3PL - Market Share Analysis, Industry Trends & Statistics, Growth Forecasts (2025 - 2030) |
||||||
※ 本网页内容可能与最新版本有所差异。详细情况请与我们联繫。
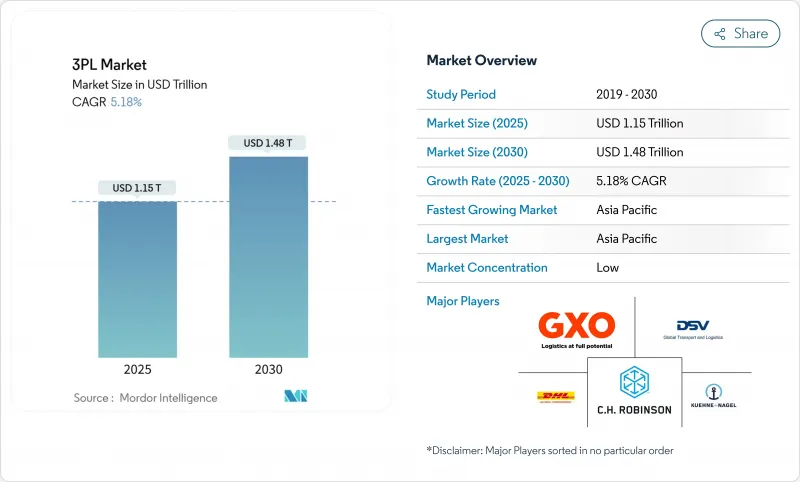
预计到 2025 年,第三方物流市场规模将达到 1.15 兆美元,到 2030 年将达到 1.48 兆美元。
目前,近55%的收入来自轻资产供应商,这些供应商透过合作伙伴而非拥有车辆或仓库来建立网路。这种模式降低了资本风险,并使营运商能够根据贸易流量的波动灵活调整运力。亚太地区占全球第三方物流市场41.3%的份额,这主要得益于电子商务的扩张以及生产向印度、越南和印尼的转移。整合即时视觉性、数位化货运匹配和仓储自动化的供应商拥有速度和成本优势,从而削弱了速度较慢的竞争对手。墨西哥的近岸外包、欧洲的绿色物流法规以及北美对生命科学的关注,都在提高服务要求,推动该行业缩短合约期限并加大对数据丰富型平台的投资。
全球第三方物流市场趋势与洞察
随着电子商务规模的扩大,当日履约加快。
新兴市场的线上零售蓬勃发展,消费者越来越希望在数小时内而非数天内收到商品。为了因应这一趋势,物流供应商正在人口密集的社区建立在超当地语系化配送中心,缩短干线运输距离,并提高配送密度。这种转变迫使第三方物流 (3PL) 营运商优化路线规划系统,增加两轮车辆以缓解拥塞路段,并采用云端订单管理系统实现即时分类。一些专业的房地产信託公司正在将小型街区改造成配备穿梭巴士系统和协作机器人的多层履约中心。
原始设备製造商的近岸外包策略催生了跨境穿梭货运
2022年至2023年间,墨西哥将超越中国,成为美国最大的贸易伙伴,每月货物吞吐量将达到4,756亿美元,货运卡车运输量约20,900辆。蒙特雷附近和巴希奥走廊沿线正在建造新的工业,预计到2025年以后,货运交通仍将保持畅通。连接供应商工厂和美国配送中心的短途高频环线——穿梭车道——如今已支援边境两侧的专用牵引车、拖车和短途运输服务的年度合约。第三方物流市场领导者正在增设双语控制塔、即时边境滞留追踪系统和双重合规报关服务,以缩短货物停留时间。铁路和公路联运也日益增多,这不仅降低了每次运输的二氧化碳排放,也确保了可预测的运输时间表。
港口拥塞导致成本波动
主要港口的积压导致海运即期运价和底盘滞期费显着波动。托运人现在更倾向于签订季度合约而非多年期协议,这为缓解港口拥堵留出了空间。第三方物流供应商透过预留内陆溢流堆场空间和部署临时转运站来规避风险,以便当天将货物转运至铁路。来自码头操作系统的即时数据流指导动态舱位预订,确保卡车仅在集装箱准备就绪后才到达。
细分市场分析
2024年,国内运输管理将占第三方物流市场规模的45%(约5,220亿美元),预计2030年将以每年5.9%的速度成长。基于应用程式的货运平台将即时价格资讯输入竞标引擎,提高了首次验收率,降低了空开率。电子商务当日配送路线和区域化履约配送中心的推出,正在推动对点对点干线运输和跨境循环取货的需求。
第三方物流 (3PL) 市场在国际运输管理领域的成长也放缓,地缘政治风险和不稳定的海运时刻表使规划变得复杂。增值仓储和配送受惠于库存分散化。零售商将库存放置在更靠近客户群的地方,迫使营运商对现有建筑物维修,配备高密度穿梭式货架和现场退货处理线。虽然公路运输仍然是主要的运输方式,但多式联运铁路的份额正在不断增长,其线路总长超过 900 公里,可靠性也开始与公路运输相媲美。
区域分析
亚太地区占第三方物流市场收入的41.3%,年复合成长率高达6.0%,位居该地区之首。製造地持续向中国以外地区多元化发展,形成一条从胡志明市延伸至曼谷和深水港的多式联运走廊。新加坡的数位化清关平台已将清关时间缩短至两小时以内,印尼的电子商务小包裹量预计自2022年以来将成长三倍,因此需要新建自动化分类中心。日本绿色港口计画下的资本计划将增加低温运输泊位,并实现疫苗有效载荷的直接进口。
北美是第三方物流 (3PL) 的第二大市场,近岸外包正在再形成其格局。德州德克萨斯州的仓库库存量如今已超过萨凡纳港。短途多式联运链正在消除空车运输,而透过 CPKC 网路提供的统一铁路服务则使单程运输节省了一整天的时间。司机短缺促使车队采用滑单调度和远端控制的场内牵引车,节省工时并提高周转率。
欧洲第三方物流市场正努力应对欧盟扩大后的排放交易体系所带来的排放压力。航运公司必须购买排放,以涵盖其2025年70%的货运量。而使用零排放电力火车头的短程航线,正将货物从海运转移到铁路运输。 FuelEU海事法规和ReFuelEU航空法规进一步收紧了监管,迫使承运商采用低碳燃料混合物。能够提供经认证的减排记录的供应商,可以与那些面临气候变迁资讯揭露压力的品牌签订合约。
其他福利:
- Excel格式的市场预测(ME)表
- 3个月的分析师支持
目录
第一章 引言
- 研究假设和市场定义
- 调查范围
第二章调查方法
第三章执行摘要
第四章 市场情势
- 市场概览
- 市场驱动因素
- 电子商务的扩张推动了新兴国家对当日配送的需求。
- OEM厂商的离岸外包策略为北美跨境货运创造了机会
- 已开发国家药品低温运输外包业务快速成长
- 政府的绿色物流法规(例如欧盟的「Fit-for-55」标准)将推动对碳中和解决方案的需求。
- 科技业转向直接面向消费者模式的转变需要多租户资料中心
- 全通路杂货店的兴起推动了都市区的微型仓配交易。
- 市场限制
- 港口拥堵导致的成本波动会缩短合约期限。
- 经合组织国家驾驶人和仓库工人短缺推高了营业利润率
- 一线物流中心工业地产成本上涨,对利润率带来压力。
- 跨境资料储存规则限制了云端WMS部署
- 价值/供应链分析
- 技术概览(物联网、人工智慧等)
- 主要政府法规和倡议
- 电子商务业务洞察
- 仓储市场趋势
- 需求趋势分析(CEP、最后一公里、低温运输等)
- 波特五力模型
- 新进入者的威胁
- 买方的议价能力
- 供应商的议价能力
- 替代品的威胁
- 竞争对手之间的竞争
- 地缘政治事件如何影响市场
第五章 市场规模与成长预测
- 透过服务
- 国内运输管理(DTM)
- 路
- 铁路
- 航空
- 水道
- 国际运输管理(ITM)
- 路
- 铁路
- 航空
- 水道
- 加值仓储及配送 (VAWD)
- 国内运输管理(DTM)
- 最终用户
- 车
- 能源与公共产业
- 製造业
- 生命科学与医疗保健
- 技术与电子
- 零售与电子商务
- 消费品和快速消费品
- 饮食
- 其他的
- 透过物流模型
- 轻资产(管理型)
- 资产导向型(自有车队和仓库)
- 杂交种
- 按地区
- 北美洲
- 美国
- 加拿大
- 墨西哥
- 南美洲
- 巴西
- 阿根廷
- 智利
- 其他南美洲
- 欧洲
- 德国
- 英国
- 法国
- 西班牙
- 义大利
- 荷兰
- 俄罗斯
- 其他欧洲地区
- 亚太地区
- 中国
- 印度
- 日本
- 韩国
- 新加坡
- 越南
- 印尼
- 澳洲
- 亚太其他地区
- 中东
- 阿拉伯聯合大公国
- 沙乌地阿拉伯
- 土耳其
- 以色列
- 其他中东地区
- 非洲
- 南非
- 埃及
- 奈及利亚
- 肯亚
- 其他非洲地区
- 北美洲
第六章 竞争情势
- 策略趋势
- 市占率分析
- 公司简介
- DHL Supply Chain and Global Forwarding
- Kuehne+Nagel International AG
- GXO Logistics
- CH Robinson Worldwide Inc.
- DSV A/S
- Nippon Express Holdings
- Sinotrans Ltd.
- CEVA Logistics(CMA CGM)
- XPO Logistics Inc.
- FedEx Logistics
- UPS Supply Chain Solutions
- GEODIS
- Kerry Logistics Network
- Yusen Logistics(NYK)
- Hitachi Transport System(LOGISTEED)
- JB Hunt Transport Services Inc.
- CJ Logistics
- Samsung SDS
- Americold Logistics LLC
- Penske Logistics
- Expeditors
第七章 市场机会与未来展望
The 3PL market size is valued at USD 1.15 trillion in 2025 and is forecast to climb to USD 1.48 trillion by 2030, delivering a steady 5.18% CAGR over the period.
Close to 55% of current revenue sits with asset-light providers that orchestrate networks through partners rather than owning fleets or warehouses. This model reduces capital risk and lets operators flex capacity when trade flows swing. Asia-Pacific anchors the global 3PL market with 41.3% of revenue, propelled by e-commerce expansion and outward shifts in manufacturing that draw production to India, Vietnam, and Indonesia. Technology remains the decisive lever: providers that integrate real-time visibility, digital freight matching, and warehouse automation gain speed and cost advantages hard for slower rivals to match. Near-shoring into Mexico, green logistics mandates in Europe, and specialized life-science flows in North America together tighten service requirements, pushing the sector toward shorter contracts and deeper investment in data-rich platforms.
Global 3PL Market Trends and Insights
E-commerce scale-up accelerating same-day fulfillment
Online retail in emerging economies is rapidly growing, and shoppers are increasingly expecting delivery in hours rather than days. Providers answer by planting hyperlocal hubs beside dense neighborhoods, trimming linehaul distance, and raising delivery density. These shifts force 3PL market operators to fine-tune route planning engines, expand two-wheeler fleets for congested streets, and adopt cloud order-management capable of real-time slot scheduling. Capital flows follow the demand: specialty real-estate trusts are converting small city plots into multi-story micro-fulfillment sites outfitted with shuttle systems and collaborative robots.
OEM near-shoring strategies creating cross-border shuttle freight
Mexico surpassed China as the United States' top trading partner between 2022 and 2023, handling USD 475.6 billion in goods and driving roughly 20,900 loaded truck crossings each month. New industrial parks under construction near Monterrey and along the Bajio corridor will keep freight taps open well past 2025. Shuttle lanes-short, high-frequency loops linking supplier plants to U.S. distribution centers-now underpin annual contracts for dedicated tractors, trailers, and dray service on both sides of the border. 3PL market leaders add bilingual control towers, real-time border-wait tracking, and dual-compliance customs brokerage to squeeze dwell times. Rail-truck intermodal pairings are rising too, reducing CO2 emissions per move and locking in predictable transit schedules.
Port congestion-induced cost volatility
Backlogs at major gateways spur wide swings in ocean spot rates and chassis detention fees. Shippers now prefer rolling quarterly agreements instead of multi-year pacts, keeping room to maneuver when port dwell blows out. 3PL market providers hedge by securing overflow yard space inland and deploying pop-up trans-load sites to flip cargo to rail the same day. Real-time data feeds from terminal operating systems guide dynamic slot booking, so trucks arrive only when a container sits wheels-ready.
Other drivers and restraints analyzed in the detailed report include:
- Pharmaceutical cold-chain outsourcing surge
- Government green-logistics mandates boosting carbon-neutral solutions
- Driver and warehouse labor scarcity
For complete list of drivers and restraints, kindly check the Table Of Contents.
Segment Analysis
Domestic Transportation Management captured 45% of the 3PL market size in 2024-equal to nearly USD 522 billion-and is forecast to grow 5.9% annually through 2030. App-based freight platforms feed real-time prices into tender engines, raising primary acceptance rates and shaving empty-mile percentages. The launch of same-day e-commerce routes and regionalized micro-fulfillment footprints intensifies demand for point-to-point linehauls and milk-run collections inside national borders.
The 3PL market also sees International Transportation Management weather softer growth as geopolitical risk and volatile ocean schedules complicate planning. Value-Added Warehousing and Distribution gains from inventory decentralization: retailers place stock closer to customer clusters, pushing operators to retrofit buildings with high-density shuttle racking and on-site returns processing lines. Road remains the dominant mode, but intermodal rails capture share on lanes longer than 900 kilometers where reliability now rivals trucking.
The 3PL Market Report is Segmented by Service (Domestic Transportation Management, International Transportation Management, and More), by End User (Automotive, Energy and Utilities, Manufacturing and More), by Logistics Model (Asset-Light, Asset-Heavy, and Hybrid), by Region (North America, South America, Europe, Asia-Pacific and More). The Market Forecasts are Provided in Terms of Value (USD).
Geography Analysis
Asia-Pacific retains 41.3% of 3PL market revenue and posts a region-best 6.0% CAGR. Manufacturing bases continue to diversify beyond China, sparking multimodal corridors from Ho Chi Minh City to Bangkok and onward to deepwater ports. Digital customs platforms in Singapore cut clearance time to under two hours, while Indonesia's e-commerce parcel volumes have tripled since 2022, demanding new automated sortation centers. Capital projects under Japan's Green Ports plan add cold-chain berth space, enabling direct imports of vaccine payloads.
North America ranks second in the 3PL market size and is being reshaped by near-shoring. Laredo, Texas, now hosts more warehouse stock than the Port of Savannah as shippers stage goods for rapid continental distribution. Short-haul intermodal chains reduce empty chassis runs, and unified rail service via the CPKC network trims single-crossing transit by a full day. Driver shortages push fleets toward slip-seat scheduling and remote-controlled yard tractors, lifting asset turns while saving labor hours.
Europe's 3PL market wrestles with emissions costs under the expanded EU Emissions Trading System. Shipping lines must purchase allowances covering 70% of vessel output in 2025, nudging cargo from ocean to rail on short-sea routes where electric locomotives claim zero-emission credits. The FuelEU Maritime and ReFuelEU Aviation regulations add further discipline, compelling carriers to blend low-carbon fuels. Providers that document certified reductions secure contracts with brands under pressure to meet climate disclosures.
- DHL Supply Chain and Global Forwarding
- Kuehne + Nagel International AG
- GXO Logistics
- C.H. Robinson Worldwide Inc.
- DSV A/S
- Nippon Express Holdings
- Sinotrans Ltd.
- CEVA Logistics (CMA CGM)
- XPO Logistics Inc.
- FedEx Logistics
- UPS Supply Chain Solutions
- GEODIS
- Kerry Logistics Network
- Yusen Logistics (NYK)
- Hitachi Transport System (LOGISTEED)
- J.B. Hunt Transport Services Inc.
- CJ Logistics
- Samsung SDS
- Americold Logistics LLC
- Penske Logistics
- Expeditors
Additional Benefits:
- The market estimate (ME) sheet in Excel format
- 3 months of analyst support
TABLE OF CONTENTS
1 Introduction
- 1.1 Study Assumptions and Market Definition
- 1.2 Scope of the Study
2 Research Methodology
3 Executive Summary
4 Market Landscape
- 4.1 Market Overview
- 4.2 Market Drivers
- 4.2.1 E-commerce Scale-up Accelerating Same-Day Fulfilment Demands in Developing Countries
- 4.2.2 OEM Near-shoring Strategies Creating Cross-Border Shuttle Freight Opportunities in North America
- 4.2.3 Pharmaceutical Cold-Chain Outsourcing Surge in Developed Economies
- 4.2.4 Government Green-Logistics Mandates (e.g., EU Fit-for-55) Boosting 3PL Demand for Carbon-Neutral Solutions
- 4.2.5 High-tech Sector's Shift to Direct-to-Consumer (D2C) Models Requiring Multi-Tenant DCs
- 4.2.6 Rise of Omni-channel Grocery Driving Micro-Fulfilment Contracts in Urban Zones
- 4.3 Market Restraints
- 4.3.1 Port Congestion-Induced Cost Volatility Reducing Contract Durations
- 4.3.2 Driver and Warehouse Labor Scarcity in OECD Economies Inflating Operating Margins
- 4.3.3 Soaring Industrial Real-Estate Costs in Tier-1 Logistics Hubs Compressing 3PL Margins
- 4.3.4 Cross-border Data-Residency Rules Limiting Cloud WMS Roll-outs
- 4.4 Value / Supply-Chain Analysis
- 4.5 Technology Snapshot (IoT, AI, etc.)
- 4.6 Key Government Regulations and Initiatives
- 4.7 Insights into E-commerce Business
- 4.8 Warehousing Market Trends
- 4.9 Demand Trend Analysis (CEP, Last-Mile, Cold-Chain etc.)
- 4.10 Porter's Five Forces
- 4.10.1 Threat of New Entrants
- 4.10.2 Bargaining Power of Buyers
- 4.10.3 Bargaining Power of Suppliers
- 4.10.4 Threat of Substitutes
- 4.10.5 Intensity of Competitive Rivalry
- 4.11 Impact of Geopolitical Events on the Market
5 Market Size & Growth Forecasts (Value)
- 5.1 By Service
- 5.1.1 Domestic Transportation Management (DTM)
- 5.1.1.1 Roadways
- 5.1.1.2 Railways
- 5.1.1.3 Airways
- 5.1.1.4 Waterways
- 5.1.2 International Transportation Management (ITM)
- 5.1.2.1 Roadways
- 5.1.2.2 Railways
- 5.1.2.3 Airways
- 5.1.2.4 Waterways
- 5.1.3 Value-Added Warehousing and Distribution (VAWD)
- 5.1.1 Domestic Transportation Management (DTM)
- 5.2 By End User
- 5.2.1 Automotive
- 5.2.2 Energy and Utilities
- 5.2.3 Manufacturing
- 5.2.4 Life Sciences and Healthcare
- 5.2.5 Technology and Electronics
- 5.2.6 Retail and E-commerce
- 5.2.7 Consumer Goods and FMCG
- 5.2.8 Food and Beverages
- 5.2.9 Others
- 5.3 By Logistics Model
- 5.3.1 Asset-Light (Management-Based)
- 5.3.2 Asset-Heavy (Own Fleet and Warehouses)
- 5.3.3 Hybrid
- 5.4 By Region
- 5.4.1 North America
- 5.4.1.1 United States
- 5.4.1.2 Canada
- 5.4.1.3 Mexico
- 5.4.2 South America
- 5.4.2.1 Brazil
- 5.4.2.2 Argentina
- 5.4.2.3 Chile
- 5.4.2.4 Rest of South America
- 5.4.3 Europe
- 5.4.3.1 Germany
- 5.4.3.2 United Kingdom
- 5.4.3.3 France
- 5.4.3.4 Spain
- 5.4.3.5 Italy
- 5.4.3.6 Netherlands
- 5.4.3.7 Russia
- 5.4.3.8 Rest of Europe
- 5.4.4 Asia-Pacific
- 5.4.4.1 China
- 5.4.4.2 India
- 5.4.4.3 Japan
- 5.4.4.4 South Korea
- 5.4.4.5 Singapore
- 5.4.4.6 Vietnam
- 5.4.4.7 Indonesia
- 5.4.4.8 Australia
- 5.4.4.9 Rest of Asia-Pacific
- 5.4.5 Middle East
- 5.4.5.1 United Arab Emirates
- 5.4.5.2 Saudi Arabia
- 5.4.5.3 Turkey
- 5.4.5.4 Israel
- 5.4.5.5 Rest of Middle East
- 5.4.6 Africa
- 5.4.6.1 South Africa
- 5.4.6.2 Egypt
- 5.4.6.3 Nigeria
- 5.4.6.4 Kenya
- 5.4.6.5 Rest of Africa
- 5.4.1 North America
6 Competitive Landscape
- 6.1 Strategic Moves
- 6.2 Market Share Analysis
- 6.3 Company Profiles (includes Global level Overview, Market level overview, Core Segments, Financials as available, Strategic Information, Market Rank/Share for key companies, Products and Services, and Recent Developments)
- 6.3.1 DHL Supply Chain and Global Forwarding
- 6.3.2 Kuehne + Nagel International AG
- 6.3.3 GXO Logistics
- 6.3.4 C.H. Robinson Worldwide Inc.
- 6.3.5 DSV A/S
- 6.3.6 Nippon Express Holdings
- 6.3.7 Sinotrans Ltd.
- 6.3.8 CEVA Logistics (CMA CGM)
- 6.3.9 XPO Logistics Inc.
- 6.3.10 FedEx Logistics
- 6.3.11 UPS Supply Chain Solutions
- 6.3.12 GEODIS
- 6.3.13 Kerry Logistics Network
- 6.3.14 Yusen Logistics (NYK)
- 6.3.15 Hitachi Transport System (LOGISTEED)
- 6.3.16 J.B. Hunt Transport Services Inc.
- 6.3.17 CJ Logistics
- 6.3.18 Samsung SDS
- 6.3.19 Americold Logistics LLC
- 6.3.20 Penske Logistics
- 6.3.21 Expeditors
7 Market Opportunities and Future Outlook
- 7.1 White-space and Unmet-Need Assessment
- 7.2 Emergence of 4PL and Digital Freight Marketplaces
- 7.3 Sustainability and Green Logistics Initiatives
- 7.4 Automation and Robotics in Warehouses
- 7.5 Near-shoring and Regionalisation Impact on Contract Structures
 2026-2030年全球汽车第三者物流市场
 第三方物流软体市场分析及预测(至2035年):依类型、产品类型、服务、技术、组件、应用、部署类型、最终用户、功能及解决方案划分
 美国第三方物流:市场占有率分析、产业趋势与统计、成长预测(2026-2031)英国第三方物流(3PL):市场占有率分析、产业趋势与统计、成长预测(2026-2031)西班牙第三方物流(3PL) 市场:份额分析、产业趋势与统计、成长预测 (2026-2031)
 第三方物流全球市场规模、份额、趋势和成长分析报告(2026-2034)
 生物製药低温运输物流服务市场按服务类型、温度类型、运输方式、产品类型、包装类型和最终用途划分,全球预测(2026-2032年)新加坡第三方物流(3PL) 市场:份额分析、产业趋势、统计数据和成长预测 (2026-2031)日本第三方物流(3PL)市场:份额分析、产业趋势、统计数据和成长预测(2026-2031)
 第三方物流市场-全球产业规模、份额、趋势、机会及预测(依运输方式、服务类型、产业、地区及竞争格局划分,2021-2031年预测)