


 |
市场调查报告书
商品编码
1850125
资料中心电力:市场份额分析、行业趋势、统计数据和成长预测(2025-2030 年)Data Center Power - Market Share Analysis, Industry Trends & Statistics, Growth Forecasts (2025 - 2030) |
||||||
※ 本网页内容可能与最新版本有所差异。详细情况请与我们联繫。
预计到 2025 年,资料中心电力市场规模将达到 245.6 亿美元,到 2030 年将达到 348.6 亿美元,年复合成长率为 7.25%。
人工智慧部署的不断扩展、超大规模资料中心容量的积极成长以及日益严格的可靠性要求正在再形成电力基础设施的优先事项,并推动资料中心电力市场的扩张。高密度人工智慧工作负载的功耗是传统CPU的三倍,促使营运商转向更高电压的配电、液冷和併网供电系统。随着公用事业公司、监管机构和云端服务供应商在需要多吉瓦级互联的大型计划上达成共识,设备供应商之间的整合也在加剧。随着越来越多的参与企业将退役的燃煤电厂改造为园区式资料中心,资料中心电力市场正从被动能源消耗转向主动参与电网,并透过配套服务开闢新的收入来源。
全球资料中心电力市场趋势与洞察
超大规模和云端运算的兴起
超大规模营运商正在为规模堪比中型城市的园区运作电力。 Meta 的 2 吉瓦开发案和 Wonder Valley 的 5.6 吉瓦计画都展现了维持云端运算成长所需的规模。Schneider Electric透露,资料中心将占其 2025 年订单的 24%。将公用事业互联与逐步释放容量挂钩的结构化合约正变得越来越普遍,从而改善了公用事业公司、业主和云端租户之间的风险分配。资料中心电力市场将直接受益,因为 IT 负载每增加一兆瓦,就需要相应增加对开关设备、UPS 和中压系统的投资。
AI密集型工作负载
AI加速器正推动机架密度从5-10kW提升至50-100kW,进而促使电源分配方式转向48V直流、更高相数和液冷方向。 Vertiv的360AI平台支援每个机架100kW的功率,并整合了母线槽、液冷分配和洩漏侦测控制功能。持续的热负荷会增加UPS设备的占空比,因此部分负载效率曲线成为关键的选择指标。根据国际能源总署的预测,到2029年,AI可能消耗全球1.5%的电力,这使得能够根据GPU利用率动态调节功率的节能型电源系统变得更加迫切。随着营运商对可预测部署计划的需求不断增长,那些将电源和冷却整合到紧凑型预製模组中的供应商正在赢得市场份额。
电力基础设施资本支出高
一座人工智慧赋能的资料中心园区,其端到端成本接近每兆瓦3800万美元,而液冷系统会使动力传动系统成本比风冷设计高出15到20倍。规模较小的託管业者难以获得客製化中压设备、长週期变压器和专用电池的融资。儘管设施即服务(FaaS)合约正在兴起,但由于客製化开关设备的次市场价值有限,金融机构仍保持谨慎。预算限制正在减缓新兴市场的扩张,削弱资料中心电力市场的积极发展势头。资金筹措缺口也促使业主和公用事业公司采用合资模式,共同投资,虽然会稀释收益,但能确保计划的可行性。
细分市场分析
到2024年,UPS平台将维持资料中心电力市场62.1%的份额,凸显其作为电网不稳定的最后一道防线的重要作用。儘管锂离子电池的普及仍在继续,但由于阀控式铅酸电池在低密度机房中具有成本优势,因此仍占据主导地位。智慧开关模式整流器可降低转换损耗,并改善设施的整体能源状况。同时,随着营运商将支路监控、温度感测和安全韧体等功能整合到配电设备中,配电设备的复合年增长率 (CAGR) 达到7.5%。虽然发电机仍然必不可少,但随着氢燃料电池发电机的试验,情况正在改变。为了满足人工智慧机架所需的高电压,需要对开关设备进行升级,而电池能源储存系统因其抑低尖峰负载和收益累积的优势而越来越受欢迎。
随着UPS供应商增加电网服务模组,生态系统动态发生变化,这些模组能够在不影响跨接运作效能的前提下进行频率调整。 Vertiv的电网互动韧体可在非关键时段调度备用容量。Delta的Smart PDU I-Type面向高密度AI机柜,将计量和远端升级功能整合到42mm厚的底盘中。由于高密度机房的试运行需要进行热成像、谐波测试和持续的韧体检验,服务收入也随之增加。因此,营运商将生命週期支援外包,为整合商带来可预测的年金收入,并促进了资料中心电源市场的繁荣。
至2024年,託管资料中心将占资料中心电力市场规模的43.8%。然而,受苹果、微软和Google自建AI託管区策略的推动,超大规模资料中心将以8.7%的复合年增长率成长。对于合规性要求较高的行业,企业园区仍将继续存在,而边缘节点将在人口密集区附近大量涌现,以降低延迟。超大规模资料中心将设计独特的电力拓扑结构,整合现场变电站和电池储能係统,而託管资料中心营运商则会以灵活的功率密度和互连架构来应对挑战。
竞争推动创新:Coresight 将液冷晶片和 48V 母线槽标榜为下一代机房的标准,而云端巨头则以 15MW 为增量改进模组。双方都采用计量型合同,将资本投入与即时运作脱钩。边缘运营商引入标准化微功率模组,以跟上 5G 部署的步伐。这些相互交织的策略推动了资料中心电力市场设备数量的成长。
区域分析
维修风力强劲地区的电网,进一步巩固了欧洲在永续设计领域的领先地位。企业买家青睐欧洲的资料中心,因为其可再生能源生产的产品有助于实现净零排放目标,并维持整个资料中心电力市场的设备需求。
亚太地区将以9.2%的复合年增长率成为成长最快的地区,这主要得益于各国政府对云走廊的资助以及对土地、光纤和电力的补贴。截至2024年下半年,亚太地区将拥有12,206兆瓦的运作IT容量,另有14,338兆瓦正在兴建中。微软宣布了在印度和日本的数十亿美元投资计划,凸显了其扩张的规模。中国的PUE(电源使用效率)上限政策加速了对高效率电源组件的需求。印度的《数位个人资料保护法》将促进国内託管,并刺激在可再生能源丛集附近建造新的园区。东南亚各国正在提供税收优惠以吸引超大规模资料中心业者资料中心营运商,这将进一步扩大开关设备、UPS(不间断电源)和智慧PDU(配电单元)的采购管道。
其他福利:
- Excel格式的市场预测(ME)表
- 3个月的分析师支持
目录
第一章 引言
- 研究假设和市场定义
- 调查范围
第二章调查方法
第三章执行摘要
第四章 市场情势
- 市场概览
- 市场驱动因素
- 超大规模和云端运算的扩展
- AI驱动的密集型工作负载
- 更严格的运作和冗余标准
- 永续性和能源效率要求
- 网格互动收入流
- 燃煤发电厂改建为校园
- 市场限制
- 对电力基础设施的高额资本投资
- 碳强度监理与报告
- 变压器/配电设备供应瓶颈
- 当地民众反对扩建变电站。
- 供应链分析
- 监管环境
- 技术展望
- 波特五力模型
- 供应商的议价能力
- 买方的议价能力
- 新进入者的威胁
- 替代品的威胁
- 竞争程度
第五章 市场规模与成长预测
- 按组件
- 电气解决方案
- UPS系统
- 发电机
- 柴油发电机
- 瓦斯发电机
- 氢燃料电池发电机
- 配电单元
- 开关设备
- 传输开关
- 远端电源面板
- 能源储存系统
- 服务
- 安装和试运行
- 维护和支援
- 培训和咨询
- 电气解决方案
- 依资料中心类型
- 超大规模资料中心业者/云端服务供应商
- 託管服务提供者
- 企业和边缘资料中心
- 按资料中心规模
- 小型资料中心
- 中型资料中心
- 大型资料中心
- 大型资料中心
- 超大型资料中心
- 按等级
- 一级和二级
- 三级
- 四级
- 按地区
- 北美洲
- 美国
- 加拿大
- 墨西哥
- 南美洲
- 巴西
- 阿根廷
- 其他南美洲
- 欧洲
- 德国
- 英国
- 法国
- 俄罗斯
- 其他欧洲地区
- 亚太地区
- 中国
- 日本
- 印度
- 韩国
- 澳洲和纽西兰
- 亚太其他地区
- 中东和非洲
- 中东
- 阿拉伯聯合大公国
- 沙乌地阿拉伯
- 土耳其
- 其他中东地区
- 非洲
- 南非
- 奈及利亚
- 其他非洲地区
- 北美洲
第六章 竞争情势
- 市场集中度
- 策略趋势
- 市占率分析
- 公司简介
- Schneider Electric SE
- Vertiv Holdings Co.
- ABB Ltd
- Eaton Corporation plc
- Legrand SA
- Huawei Technologies Co. Ltd
- Fujitsu Ltd
- Cisco Systems Inc.
- Rittal GmbH and Co. KG
- Mitsubishi Electric Corp.
- Cummins Inc.
- Kohler Power Systems
- PDU Experts UK Ltd
- Schleifenbauer Products BV
- Delta Electronics Inc.
- Caterpillar Inc.
- Socomec Group
- Tripp Lite(by Eaton)
- Riello UPS SpA
- KEHUA Tech
第七章 市场机会与未来展望
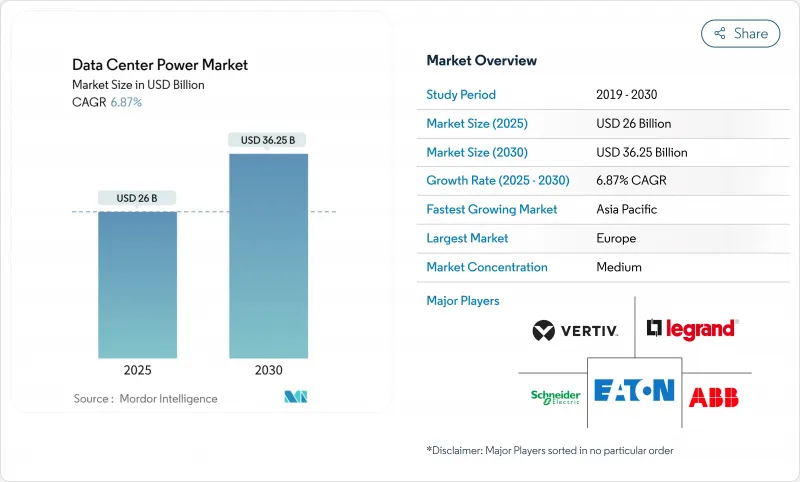
The data center power market size is expected to be valued at USD 24.56 billion in 2025 and is projected to advance at a 7.25% CAGR, reaching USD 34.86 billion by 2030.
Growing deployment of artificial intelligence, aggressive hyperscale capacity additions, and stricter reliability mandates are reshaping electrical infrastructure priorities and fueling expansion in the data center power market. High-density AI workloads consume three times more electricity than conventional CPUs, pushing operators toward higher-voltage distribution, liquid cooling, and grid-interactive power trains. Consolidation among equipment suppliers is strengthening as utilities, regulators, and cloud providers align on large-scale projects that require multi-gigawatt interconnections. With more operators repurposing retired coal plants for campus-style facilities, the data center power market is transitioning from passive energy consumption to active grid participation, unlocking new revenue streams through ancillary services.
Global Data Center Power Market Trends and Insights
Hyperscale & Cloud Computing Expansion
Hyperscale operators are commissioning campuses that equal the electricity demand of medium-sized cities. Meta's 2 GW development and the 5.6 GW Wonder Valley site illustrate the scale now required to sustain cloud growth. Orders for modular, factory-integrated power trains are rising sharply, and Schneider Electric disclosed that data centers made up 24% of its incoming orders in 2025. Structured agreements tying utility interconnections to phased capacity releases are becoming common, improving risk allocation among utilities, landlords, and cloud tenants. The data center power market benefits directly because every incremental megawatt of IT load drives proportional investment in switchgear, UPS, and medium-voltage systems.
AI-Driven High-Density Workloads
AI accelerators raise rack densities from 5-10 kW to 50-100 kW, forcing a move to 48 V DC distribution, higher phase counts, and liquid cooling. Vertiv's 360AI platform supports 100 kW per rack with integrated busway, coolant distribution, and leak-detection controls. Persistent thermal loads increase the duty cycle of UPS equipment, making efficiency curves at partial load a critical selection metric. International Energy Agency projections indicate AI could consume 1.5% of global electricity by 2029, reinforcing the urgency for energy-proportional power systems that dynamically throttle in sync with GPU utilization. Vendors that marry power and cooling into a compact, prefabricated block are capturing share as operators seek predictable deployment timelines.
High CAPEX of Electrical Infrastructure
End-to-end cost for AI-ready campuses approaches USD 38 million per MW, with liquid cooling inflating power-train expenditures by 15-20X compared with air-based designs. Smaller colocation players find it challenging to secure financing for customized medium-voltage gear, long-lead transformers, and specialized batteries. Equipment-as-a-service contracts are emerging, yet lenders remain cautious because secondary-market values for bespoke switchgear are limited. Budget restrictions slow expansion in emerging economies, tempering the otherwise robust trajectory of the data center power market. Financing gaps also spur joint-venture models where landlords and utilities co-invest, diluting returns but enabling project viability.
Other drivers and restraints analyzed in the detailed report include:
- Stricter Uptime & Redundancy Standards
- Sustainability & Energy-Efficiency Mandates
- Transformer/Switchgear Supply Bottlenecks
For complete list of drivers and restraints, kindly check the Table Of Contents.
Segment Analysis
UPS platforms retained 62.1% of the data center power market share in 2024, underscoring their role as the last defense against grid instability. Lithium-ion adoption continues, but valve-regulated lead-acid remains prevalent due to cost advantage in lower-density halls. Intelligent switch-mode rectifiers trim conversion losses, improving overall facility energy profiles. In parallel, power distribution units record 7.5% CAGR because operators now embed branch-circuit monitoring, temperature sensing, and secure firmware. Generators stay indispensable, yet the narrative shifts as hydrogen-ready gensets enter pilot use. Switchgear upgrades align with higher voltages demanded by AI racks, and battery energy storage systems gain favor for peak-shaving and revenue stacking.
Ecosystem dynamics shift as UPS vendors add grid services modules, enabling frequency regulation without undermining ride-through performance. Vertiv's grid-interactive firmware dispatches reserve capacity during non-critical intervals. Delta's Smart PDU I-Type consolidates metering and remote-upgrade functions into a 42 mm chassis aimed at dense AI enclosures. Services revenue rises because commissioning high-density halls requires thermal mapping, harmonic studies, and ongoing firmware validation. Consequently, operators outsource lifecycle support, driving predictable, annuity-style income streams for integrators and enriching the data center power market.
Colocation facilities held a 43.8% share of the data center power market size in 2024, thanks to shared infrastructure economics and rapid time-to-market. Yet hyperscalers post an 8.7% CAGR, propelled by Apple, Microsoft, and Google's strategies to self-build AI hosting zones. Enterprise campuses persist for compliance-sensitive industries, and edge nodes proliferate near population clusters to lower latency. Hyperscalers design proprietary power topologies, integrating on-site substations and battery farms, while colocation players counter with flexible power densities and interconnect fabrics.
Competitive tension fosters innovation: CoreSite advertises liquid-to-chip cooling and 48 V busway as standard in next-gen halls, whereas cloud majors refine modular blocks for 15 MW increments. Pay-as-you-grow contracts appear in both camps, decoupling capital allocation from immediate occupancy. Edge operators deploy standardized micro power modules to keep pace with 5G rollouts. These intertwined strategies collectively elevate equipment volumes flowing into the data center power market.
The Data Center Power Market is Segmented by Component (Electrical Solutions and Services), Data Center Type (Hyperscaler/Cloud Service Providers, Colocation Providers, and More), Data Center Size (Small Size Data Centers, Medium Size Data Centers, Large Size Data Centers and More), Tier Type (Tier I and II, Tier III, Tier IV) and by Geography. The Market Forecasts are Provided in Terms of Value (USD)
Geography Analysis
Europe led with 34.18% revenue share in 2024, driven by binding energy-efficiency legislation, stringent reporting rules, and aggressive renewable goals. Operators retrofit legacy facilities with high-efficiency UPS and battery storage to satisfy the Energy Efficiency Directive. Coal-plant conversions such as Sines DC repurpose existing grid interconnections and seawater intake lines, accelerating deployment while curbing environmental impact. Vendors supply grid-interactive UPS that help stabilize wind-heavy regional grids, strengthening the continent's leadership in sustainable design. Corporate buyers prefer European sites because renewable guarantees of origin support net-zero pledges, sustaining equipment demand across the data center power market.
Asia-Pacific delivers the fastest 9.2% CAGR as governments fund cloud corridors and subsidize land, fiber, and electricity. Regional capacity totaled 12,206 MW of live IT load with 14,338 MW in construction as of H2 2024. Microsoft pledged multi-billion-dollar plans in India and Japan, highlighting the scale of expansion. China enforces a national PUE cap that accelerates high-efficiency power component orders. India's Digital Personal Data Protection Act drives domestic hosting and stimulates new campuses near renewable clusters. Southeast Asian nations offer tax breaks to attract hyperscalers, further widening procurement pipelines for switchgear, UPS, and smart PDUs.
- Schneider Electric SE
- Vertiv Holdings Co.
- ABB Ltd
- Eaton Corporation plc
- Legrand SA
- Huawei Technologies Co. Ltd
- Fujitsu Ltd
- Cisco Systems Inc.
- Rittal GmbH and Co. KG
- Mitsubishi Electric Corp.
- Cummins Inc.
- Kohler Power Systems
- PDU Experts UK Ltd
- Schleifenbauer Products BV
- Delta Electronics Inc.
- Caterpillar Inc.
- Socomec Group
- Tripp Lite (by Eaton)
- Riello UPS S.p.A.
- KEHUA Tech
Additional Benefits:
- The market estimate (ME) sheet in Excel format
- 3 months of analyst support
TABLE OF CONTENTS
1 INTRODUCTION
- 1.1 Study Assumptions and Market Definition
- 1.2 Scope of the Study
2 RESEARCH METHODOLOGY
3 EXECUTIVE SUMMARY
4 MARKET LANDSCAPE
- 4.1 Market Overview
- 4.2 Market Drivers
- 4.2.1 Hyperscale and cloud?computing expansion
- 4.2.2 AI-driven high-density workloads
- 4.2.3 Stricter uptime and redundancy standards
- 4.2.4 Sustainability and energy-efficiency mandates
- 4.2.5 Grid-interactive revenue streams
- 4.2.6 Coal-plant site repurposing for campuses
- 4.3 Market Restraints
- 4.3.1 High CAPEX of electrical infrastructure
- 4.3.2 Carbon-intensity regulations and reporting
- 4.3.3 Transformer/switchgear supply bottlenecks
- 4.3.4 Local opposition to sub-station expansion
- 4.4 Supply-Chain Analysis
- 4.5 Regulatory Landscape
- 4.6 Technological Outlook
- 4.7 Porter's Five Forces
- 4.7.1 Bargaining Power of Suppliers
- 4.7.2 Bargaining Power of Buyers
- 4.7.3 Threat of New Entrants
- 4.7.4 Threat of Substitutes
- 4.7.5 Degree of Competition
5 MARKET SIZE and GROWTH FORECASTS (VALUE)
- 5.1 By Component
- 5.1.1 Electrical Solutions
- 5.1.1.1 UPS Systems
- 5.1.1.2 Generators
- 5.1.1.2.1 Diesel Generators
- 5.1.1.2.2 Gas Generators
- 5.1.1.2.3 Hydrogen Fuel-cell Generators
- 5.1.1.3 Power Distribution Units
- 5.1.1.4 Switchgear
- 5.1.1.5 Transfer Switches
- 5.1.1.6 Remote Power Panels
- 5.1.1.7 Energy-storage Systems
- 5.1.2 Service
- 5.1.2.1 Installation and Commissioning
- 5.1.2.2 Maintenance and Support
- 5.1.2.3 Training and Consulting
- 5.1.1 Electrical Solutions
- 5.2 By Data Center Type
- 5.2.1 Hyperscaler/Cloud Service Providers
- 5.2.2 Colocation Providers
- 5.2.3 Enterprise and Edge Data Center
- 5.3 By Data Center Size
- 5.3.1 Small Size Data Centers
- 5.3.2 Medium Size Data Centers
- 5.3.3 Large Size Data Centers
- 5.3.4 Massive Size Data Centers
- 5.3.5 Mega Size Data Centers
- 5.4 By Tier Level
- 5.4.1 Tier I and II
- 5.4.2 Tier III
- 5.4.3 Tier IV
- 5.5 By Geography
- 5.5.1 North America
- 5.5.1.1 United States
- 5.5.1.2 Canada
- 5.5.1.3 Mexico
- 5.5.2 South America
- 5.5.2.1 Brazil
- 5.5.2.2 Argentina
- 5.5.2.3 Rest of South America
- 5.5.3 Europe
- 5.5.3.1 Germany
- 5.5.3.2 United Kingdom
- 5.5.3.3 France
- 5.5.3.4 Russia
- 5.5.3.5 Rest of Europe
- 5.5.4 Asia-Pacific
- 5.5.4.1 China
- 5.5.4.2 Japan
- 5.5.4.3 India
- 5.5.4.4 South Korea
- 5.5.4.5 Australia and New Zealand
- 5.5.4.6 Rest of Asia-Pacific
- 5.5.5 Middle East and Africa
- 5.5.5.1 Middle East
- 5.5.5.1.1 United Arab Emirates
- 5.5.5.1.2 Saudi Arabia
- 5.5.5.1.3 Turkey
- 5.5.5.1.4 Rest of Middle East
- 5.5.5.2 Africa
- 5.5.5.2.1 South Africa
- 5.5.5.2.2 Nigeria
- 5.5.5.2.3 Rest of Africa
- 5.5.1 North America
6 COMPETITIVE LANDSCAPE
- 6.1 Market Concentration
- 6.2 Strategic Moves
- 6.3 Market Share Analysis
- 6.4 Company Profiles (includes Global-level Overview, Market-level Overview, Core Segments, Financials as available, Strategic Information, Market Rank/Share for key companies, Products and Services, and Recent Developments)
- 6.4.1 Schneider Electric SE
- 6.4.2 Vertiv Holdings Co.
- 6.4.3 ABB Ltd
- 6.4.4 Eaton Corporation plc
- 6.4.5 Legrand SA
- 6.4.6 Huawei Technologies Co. Ltd
- 6.4.7 Fujitsu Ltd
- 6.4.8 Cisco Systems Inc.
- 6.4.9 Rittal GmbH and Co. KG
- 6.4.10 Mitsubishi Electric Corp.
- 6.4.11 Cummins Inc.
- 6.4.12 Kohler Power Systems
- 6.4.13 PDU Experts UK Ltd
- 6.4.14 Schleifenbauer Products BV
- 6.4.15 Delta Electronics Inc.
- 6.4.16 Caterpillar Inc.
- 6.4.17 Socomec Group
- 6.4.18 Tripp Lite (by Eaton)
- 6.4.19 Riello UPS S.p.A.
- 6.4.20 KEHUA Tech
7 MARKET OPPORTUNITIES and FUTURE OUTLOOK
- 7.1 White-space and Unmet-need Assessment
 资料中心电源市场分析及预测(至2035年):类型、产品类型、服务、技术、组件、应用、部署模式、最终用户、解决方案、交付模式
 2026年全球资料中心电力市场报告2026年全球资料中心电源管理市场报告
 伺服器电源市场:依产品类型、组件、额定功率、外形规格、应用、最终用户和通路划分-2026-2030年全球预测资料中心以AC-DC电源市场:按组件、电源类型、冗余方式和应用划分-2026-2032年全球预测资料中心电源系统氮化镓市场分析及预测(至2035年):依类型、产品、服务、技术、组件、应用、形式、材料类型、装置及部署方式划分
 全球资料中心电力市场规模、份额、趋势和成长分析报告(2026-2034)全球资料中心电力市场:市场规模、占有率、成长率、产业分析、依类型、应用和地区划分的分析及预测(2026-2034 年)
 资料中心电源市场 - 全球产业规模、份额、趋势、机会及预测(按解决方案、组件、最终用户产业、地区和竞争格局划分),2021-2031年资料中心结构化布线市场 - 全球产业规模、份额、趋势、机会及预测(按组件、线缆类型、最终用户、地区和竞争格局划分,2021-2031年)