


 |
市场调查报告书
商品编码
1524211
货柜运输:市场占有率分析、产业趋势/统计、成长预测(2024-2029)Container Shipping - Market Share Analysis, Industry Trends & Statistics, Growth Forecasts (2024 - 2029) |
||||||
※ 本网页内容可能与最新版本有所差异。详细情况请与我们联繫。
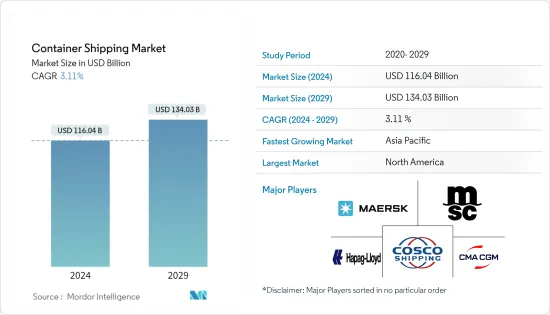
预计2024年货柜运输市场规模为1,160.4亿美元,预计2029年将达到1,340.3亿美元,在预测期内(2024-2029年)复合年增长率为3.11%。
主要亮点
- 全球货柜运输业可能正在应对红海的不稳定状况。儘管如此,今年肯定会为大多数专业人士带来很多时刻。供应链专业人士正在策略性地重新思考贸易路线,并融入促进弹性和创新的技术。儘管航运公司对该行业的成长持乐观态度,但他们仍保持谨慎态度,并认识到地缘政治紧张局势等潜在干扰。
- 投资技术和规划是最主要的投资趋势,30% 的受访者表示他们将钱花在这方面。即时可见性和追踪 (24%)、协作和连接 (27%) 以及流程自动化 (18%) 也排名靠前。
- 运输量的增加是由于各种封锁措施的放鬆、全球经济活动的復苏、支持计划刺激了一些地区大宗商品消费的强劲势头、库存重建导致电子商务的强劲增长以及业务的正常季节性波动;活动。
- 今年,欧盟 (EU) 对企业永续性目标和新区域法规的日益关注,将永续性列为许多托运人和承运人的首要议程。
- 例如,根据欧盟的碳边境调整机制(CBAM)法,欧盟的所有进口商都必须报告与某些产品生产相关的碳排放。此外,从 1 月 1 日起,往返欧洲经济区 (EEA) 的航运公司将受到欧盟新排放交易体系 (ETS) 法规的约束,该法规也已扩展到航运领域。
- 许多航运公司正在努力提高航运的永续,例如透过降低航速来满足 IMO 2023 年温室气体战略等排放标准,以及引入氨、甲醇和回收食用油等生质燃料,我们已经在这方面取得了进展。这。然而,欧盟(EU)的新要求可能会导致航运公司调整船期、引入额外费用以及做出其他改变来实现永续性目标,这对托运人的影响似乎是不可避免的。
货柜运输市场趋势
高立方货柜业务增加
- *高立方货柜有各种长度可供选择,例如 20 英尺和 40 英尺。高立方容器的主要特点是其高度增加。高立方货柜高 9 英尺 6 英寸,标准货柜高 8 英尺 6 英寸。
- *当需要垂直空间时,请使用高立方容器。当运输因尺寸而无法符合标准高度的货物时,或者当您想要有效地最大化货物体积时,这非常有效。
- 高立方集装箱整体普通货物(干货)。高立方货柜整体普通货物(干货),但特别适合运输轻型、大体积货物和高度不超过2.70m的超重货物。
- 高立方货柜的主要优点是,由于其高度(9英尺6英寸),它们比标准货柜具有更多的立方容量。这使得能够运输更大和更高的货物,并提供处理各种货物的灵活性。
- 货柜产量统计数据显示,几年前干货货柜产量超过660万个,但未来几年将减少至345万个标准箱。生产趋势仍在波动,预计成长主要是由于更换需求。一个新的高立方容器的平均成本在 3,000 美元到 7,000 美元之间,而二手物品的成本在 1,50 美元到 5,000 美元之间,具体取决于尺寸。
亚太地区主导市场
- 中国是世界商品供应国,几乎与每个国家都有贸易往来。一个国家的GDP很大程度上受对外贸易的影响。世界对中国商品(成品或原料)的需求很高。 2023年第一季,中国出口在国际市场困难重重的情况下仍呈现明显復苏态势。
- 根据五月亚洲统计,3月中国出口较去年同月成长惊人14.8%,扭转了下滑时期。
- 最新一期新华-波罗的海国际航运中心发展指数显示,2023年全球排名前十位中,中国航运中心城市表现突出。舟山、香港、宁波和上海等城市均榜上有名,凸显了中国在全球航运业日益重要的地位。
- 日本是亚洲第三大船舶持有国,仅次于中国和希腊。包括日本在内的亚洲国家在货物装卸性能方面处于领先地位,并拥有一些在效率和连接性方面世界顶级的港口。
- 2023 年 4 月至 10 月期间,印度所有主要港口的货运量为 4.6398 万吨 (MT)。去年4月至10月,印度主要港口的货物吞吐量为4.465亿吨。几年前,印度出口商品价值4,178亿美元,比上年成长40%。 2023 财政年度出口总额为 4,474.6 亿美元。政府实施了部分机械化,深化征兵,实施快速疏散政策,提高了业务效率。
- 2023-24年4-5月期间,在所有产品中,货柜在印度处理的货物最多,为3,022万吨,占总量的22.6%。其次是POL原油(20.6%)、动力煤(15.1%)、其他产品(8.2%)、铁矿石/球团矿(7.1%)、POL产品(6.7%)、其他煤炭(5.7%)和炼焦煤(4.6%)、液化石油气/液化天然气(1.8%)、钢铁(1.2%)、肥料(1.2%)、FRM干(1.1%)、食用油(1.1%)、其他矿石(1.0%)、 FRM液体(0.9%)、水泥(0.4%)和砂糖(0.3%)。
货柜运输业概况
货柜运输市场本质上是分散的,有许多国际公司。该领域的主要企业包括马士基、MSC、CMA、COSCO、Hapag Lloyd。由于全球海运贸易和工业化的成长,全球货柜市场预计将稳定成长。
海运货柜市场的成长得益于船舶货物运输需求的增加和贸易相关协议数量的增加。此外,运输和仓储成本的波动也影响货柜市场的成长。然而,预测期内的市场成长前景可能是由计划转向航运自动化和海上安全标准提高等因素所推动的。
其他福利:
- Excel 格式的市场预测 (ME) 表
- 3 个月分析师支持
目录
第一章简介
- 调查先决条件
- 调查范围
第二章调查方法
- 分析方法
- 调查阶段
第三章执行摘要
第四章市场动态与洞察
- 目前的市场状况
- 市场动态
- 促进因素
- 国际贸易量增加
- 国家间贸易协定的增加
- 抑制因素
- 燃料成本上涨影响市场
- 贸易紧张局势加剧
- 机会
- 市场技术进步
- 世界贸易的扩大
- 促进因素
- 价值链/供应链分析
- 行业法规政策
- 物流领域技术发展
- 产业吸引力-波特五力分析
- 新进入者的威胁
- 买家/消费者的议价能力
- 供应商的议价能力
- 替代品的威胁
- 竞争公司之间敌对关係的强度
- COVID-19 对市场的影响
- 市场最终用户洞察
第五章市场区隔
- 按尺寸
- 小容器
- 大货柜
- 高立方容器
- 按类型
- 一般货柜运输
- 冷藏货柜运输
- 按地区
- 北美洲
- 美国
- 加拿大
- 墨西哥
- 北美其他地区
- 欧洲
- 德国
- 法国
- 英国
- 义大利
- 其他欧洲国家
- 亚太地区
- 中国
- 日本
- 澳洲
- 印度
- 新加坡
- 马来西亚
- 印尼
- 泰国
- 其他亚太地区
- 中东/非洲
- 埃及
- 卡达
- 沙乌地阿拉伯
- 阿拉伯聯合大公国
- 南非
- 其他中东/非洲
- 南美洲
- 巴西
- 哥伦比亚
- 南美洲其他地区
- 北美洲
第六章 竞争状况
- 市场集中度概览
- 公司简介
- AP Moller-Maersk AS
- MSC Mediterranean Shipping Company SA
- CMA CGM
- China COSCO Holdings Company Limited
- Hapag-Lloyd
- ONE(Ocean Network Express)
- Evergreen Line
- Wan Hai Lines
- Zim
- SITC
- Zhonggu Logistics Corp.
- Antong Holdings(QASC)
- 其他公司
第七章 市场的未来
第8章附录
The Container Shipping Market size is estimated at USD 116.04 billion in 2024, and is expected to reach USD 134.03 billion by 2029, growing at a CAGR of 3.11% during the forecast period (2024-2029).
Key Highlights
- The global container shipping industry may be dealing with a volatile situation in the Red Sea. Still, this year should provide plenty of moments for most professionals in space. Supply chain professionals are strategically rethinking trade routes and embracing technology to foster resilience and innovation. While shipping companies are optimistic about the industry's growth, they remain vigilant, recognizing potential disruptions, such as geopolitical tensions.
- Investments in technology and planning are the top investment trend, with 30% of respondents saying that is where they spend money. Real-time visibility and tracking (24%), collaboration and connectivity (27%), and process automation (18%) also appeared on the list.
- The increase in volumes transported was due to the pick-up in global economic activity following the easing of various lockdown measures, the strong momentum in terms of the consumption of goods encouraged in some locations by support packages, strong e-commerce growth with inventory rebuilding, and the usual seasonal variation in business activity.
- A heightened focus on corporate sustainability goals and new regional regulations from the European Union (EU) puts sustainability at the top of mind for many shippers and carriers heading into this year.
- For example, under the EU's Carbon Border Adjustment Mechanism (CBAM) law, all EU importers need to report carbon emissions related to the production of certain products. Additionally, starting January 1, carriers shipping to, from, or within the European Economic Area (EEA) are subject to the EU's new Emission Trading System (ETS) regulations, which were expanded to include maritime shipping.
- Many ocean carriers have already made progress toward more sustainable shipping, including using slow steaming to meet emissions standards like the 2023 IMO GHG Strategy and introducing biofuels such as ammonia, methanol, and recycled cooking oil. However, the new requirements from the European Union may lead carriers to adjust schedules, implement surcharges, or make other changes to meet their sustainability goals, which would inevitably impact shippers.
Container Shipping Market Trends
Increasing high cube containers segment
- * High cube containers are available in various lengths, including 20-foot and 40-foot options. The key feature of high cube containers is the increased height. While a standard container is 8 feet 6 inches high, high cube containers are 9 feet 6 inches tall.
- * High cube containers are used when extra vertical space is needed. They are beneficial for transporting goods that may not fit within the standard height due to their dimensions or for maximizing cargo volume efficiently.
- High-cube containers are used for all types of general cargo (dry cargo). However, they are particularly suitable for transporting light, voluminous cargoes and overheight cargoes up to a maximum of 2.70 m tall.
- The primary advantage of high cube containers is their extra height (9 feet 6 inches), providing more cubic capacity than standard containers. This allows for transporting more significant or taller cargo, offering flexibility in handling various goods.
- Statistics on the production of containers show that a few years ago, more than 6.6 million dry freight containers were produced, which will drop to 3.45 million TEU in the next few years. The trend in production is still fluctuating, with expectations of an increase mainly driven by replacement needs. The average cost of a new high cube container can range from USD 3,000 to USD 7,000, while a used unit may be around USD 1,50 to USD 5,000, depending on the size.
Asia-Pacific dominating the market
- China is a global supplier of goods, trading with almost every nation. The GDP of the nation is significantly influenced by foreign commerce. Global demand for Chinese commodities (completed items or raw materials) is high. In the first quarter of 2023, China's exports showed a stunning recovery despite experiencing obstacles in international markets.
- According to May Asia, China's exports increased by an impressive 14.8% in March compared to the same month last year, marking a positive turn of events after a period of decline.
- In the top 10 global rankings for 2023, Chinese shipping center cities are notably represented, according to the most recent edition of the Xinhua-Baltic International Shipping Centre Development Index. Cities like Zhoushan, Hong Kong, Ningbo, and Shanghai were well-represented on this list, highlighting China's increasing importance in the global shipping sector.
- Japan is the third-largest ship-owning country in Asia after China and Greece. Asian countries, including Japan, lead in cargo handling performance and have several ports ranked among the top globally for efficiency and connectivity.
- All of India's major ports handled 463.98 million tons (MT) of cargo traffic between April and October of 2023. India's major ports handled 446.50 million tons (MT) of cargo traffic between April and October of the previous year. India exported USD 417.8 billion of goods a few years ago, a 40% increase from the prior year. Exports of goods totaled USD 447.46 billion in FY23. The government has implemented several mechanizations, deepened the draft, and implemented quick evacuation policies to increase operational efficiency.
- In April-May 2023-24, among all commodities, containers handled the highest cargo of 30.22 million tonnes in India, accounting for 22.6% of the total. Next in line were POL-crude (20.6%), thermal coal (15.1%), other commodities (8.2%), iron ore/pellets (7.1%), POL products (6.7%), other coal (5.7%), coking coal (4.6%), LPG/LNG (1.8%), iron & steel (1.2%), fertilizer (1.2%), FRM dry (1.1%), edible oil (1.1%), other ores (1.0%), FRM liquid (0.9%), cement (0.4%), and sugar (0.3%).
Container Shipping Industry Overview
The container shipping market is fragmented in nature, with the presence of many international companies. The top players in the segment include Maersk, MSC, CMA, COSCO, and Hapag Lloyd. Due to the increased seaborne trade and industrialization worldwide, the global shipping container market is expected to grow steadily.
The growth of the shipping container market is supported by increased demand for cargo transport via ships and a rise in trade-tied agreements. In addition, the growth of the shipping container market is affected by fluctuations in transportation and storage costs. Nevertheless, growth prospects for the market in the forecast period will be driven by factors such as a planned shift towards automation of shipping and increased safety standards at sea.
Additional Benefits:
- The market estimate (ME) sheet in Excel format
- 3 months of analyst support
TABLE OF CONTENTS
1 INTRODUCTION
- 1.1 Study Assumptions
- 1.2 Scope of the Study
2 RESEARCH METHODOLOGY
- 2.1 Analysis Methodology
- 2.2 Research Phases
3 EXECUTIVE SUMMARY
4 MARKET DYNAMICS AND INSIGHTS
- 4.1 Current Market Scenario
- 4.2 Market Dynamics
- 4.2.1 Drivers
- 4.2.1.1 Increasing volume of international trade
- 4.2.1.2 The rise of trade agreements between nations
- 4.2.2 Restraints
- 4.2.2.1 Surge in fuel costs affecting the market
- 4.2.2.2 Increasing trade tension
- 4.2.3 Opportunities
- 4.2.3.1 Technological advancements in the market
- 4.2.3.2 Expanding global trade
- 4.2.1 Drivers
- 4.3 Value Chain/Supply Chain Analysis
- 4.4 Industry Policies and Regulations
- 4.5 Technological Developments in the Logistics Sector
- 4.6 Industry Attractiveness - Porter's Five Forces Analysis
- 4.6.1 Threat of New Entrants
- 4.6.2 Bargaining Power of Buyers/Consumers
- 4.6.3 Bargaining Power of Suppliers
- 4.6.4 Threat of Substitute Products
- 4.6.5 Intensity of Competitive Rivalry
- 4.7 Impact of COVID-19 on the Market
- 4.8 Insights into End Users in the Market
5 MARKET SEGMENTATION
- 5.1 By Size
- 5.1.1 Small Containers
- 5.1.2 Large Containers
- 5.1.3 High Cube Containers
- 5.2 By Type
- 5.2.1 General Container Shipping
- 5.2.2 Reefer Container Shipping
- 5.3 By Geography
- 5.3.1 North America
- 5.3.1.1 United States
- 5.3.1.2 Canada
- 5.3.1.3 Mexico
- 5.3.1.4 Rest of North America
- 5.3.2 Europe
- 5.3.2.1 Germany
- 5.3.2.2 France
- 5.3.2.3 United Kingdom
- 5.3.2.4 Italy
- 5.3.2.5 Rest of Europe
- 5.3.3 Asia-Pacific
- 5.3.3.1 China
- 5.3.3.2 Japan
- 5.3.3.3 Australia
- 5.3.3.4 India
- 5.3.3.5 Singapore
- 5.3.3.6 Malaysia
- 5.3.3.7 Indonesia
- 5.3.3.8 Thailand
- 5.3.3.9 Rest of Asia-Pacific
- 5.3.4 Middle East and Africa
- 5.3.4.1 Egypt
- 5.3.4.2 Qatar
- 5.3.4.3 Saudi Arabia
- 5.3.4.4 United Arab Emirates
- 5.3.4.5 South Africa
- 5.3.4.6 Rest of Middle East and Africa
- 5.3.5 South America
- 5.3.5.1 Brazil
- 5.3.5.2 Colombia
- 5.3.5.3 Rest of South America
- 5.3.1 North America
6 COMPETITIVE LANDSCAPE
- 6.1 Market Concentration Overview
- 6.2 Company Profiles
- 6.2.1 AP Moller-Maersk AS
- 6.2.2 MSC Mediterranean Shipping Company SA
- 6.2.3 CMA CGM
- 6.2.4 China COSCO Holdings Company Limited
- 6.2.5 Hapag-Lloyd
- 6.2.6 ONE (Ocean Network Express)
- 6.2.7 Evergreen Line
- 6.2.8 Wan Hai Lines
- 6.2.9 Zim
- 6.2.10 SITC
- 6.2.11 Zhonggu Logistics Corp.
- 6.2.12 Antong Holdings (QASC)*
- 6.3 Other Companies
7 FUTURE OF THE MARKET
8 APPENDIX
 海运货柜市场:按货柜类型、材料类型、货柜尺寸、货柜所有者、应用、最终用户产业划分 - 2025-2030 年全球预测按改装类型、货柜尺寸和应用分類的货柜改装市场 - 2025-2030 年全球预测近海船舶服务市场:按类型、货物类型、类别、营运类型、最终用户、所有者类型 - 2025-2030 年全球预测
 2025年全球货柜运输市场报告
 货柜起重设备市场规模、份额和成长分析(按操作类型、设备类型、推进类型、货物类型、应用、最终用户和地区)- 产业预测 2025-2032货柜运输市场:按货柜尺寸、货柜类型、最终用途行业和地区划分海运货柜市场规模、份额和成长分析(按尺寸、货柜、客户、最终用户产业和地区)- 2025-2032 年产业预测
 欧洲冷藏货柜运输:市场占有率分析、产业趋势与统计、成长预测(2025-2030)欧洲货柜运输:市场占有率分析、产业趋势、成长预测(2025-2030)2025-2033 年日本海运货柜市场报告(按产品、货柜尺寸(小型货柜、大型货柜、高立方货柜等)、应用和地区)