


 |
市场调查报告书
商品编码
1629796
资料视觉化:市场占有率分析、产业趋势、统计、成长预测(2025-2030)Data Visualization - Market Share Analysis, Industry Trends & Statistics, Growth Forecasts (2025 - 2030) |
||||||
※ 本网页内容可能与最新版本有所差异。详细情况请与我们联繫。
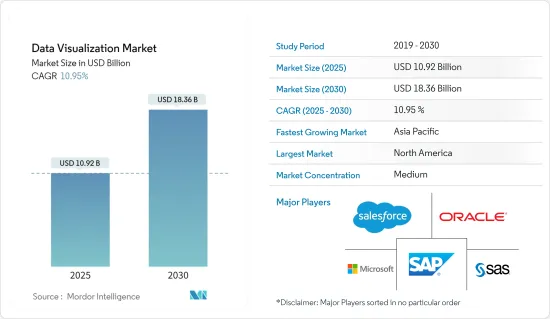
资料视觉化市场规模预计到2025年为109.2亿美元,预计到2030年将达到183.6亿美元,预测期内(2025-2030年)复合年增长率为10.95%。
资料视觉化的新本质正在推动向分析主导业务的转变,使用户能够探索最初仅在各种格式和图形表示形式的表格形式报告中提供的资料。
主要亮点
- 在许多行业中,企业正在意识到资料主导决策的好处。从大型复杂的资料库中提取有用的信息变得越来越重要。资料视觉化对于揭示复杂资讯并以易于理解和分析的视觉吸引力方式呈现至关重要。随着公司寻找从资料中提取有价值见解的方法,资料视觉化工具市场将继续成长。有效地视觉化资料可以帮助决策者发现模式、趋势和相关性,从而做出更明智的策略决策。
- 术语「扩增实境」是指将数位资料(例如视觉化)迭加到实体环境上的技术。一项有潜力改变市场的新发展是将 AR 纳入资料视觉化工具。透过将资料视觉化迭加到现实世界的物件和环境上,AR 可以为消费者提供身临其境、引人入胜的体验,使他们能够以新颖的方式探索和分析资料。该技术可用于多个领域,包括製造、医疗保健和零售,其中地理环境中的即时资料视觉化可以改善决策、培训和消费者互动。
- 自然语言处理和对话介面的结合是资料视觉化的另一个独特的市场驱动力。自然语言处理允许电脑理解、翻译和产生人类语言,允许使用者使用自然语言指令和查询与资料视觉化工具进行通讯。透过与系统交互,使用者可以提出问题、请求特定的视觉化,并利用 NLP 来探索资料。与传统的图形使用者介面相比,它的学习曲线较低,因此有可能使资料视觉化更容易被更广泛的受众接受。它还开启了透过智慧扬声器和虚拟助理等支援语音的小工具进行资料主导决策的可能性。
- 随着产生和分析的资料量不断增加,资料隐私和安全已成为主要问题。由此推断,组织和个人越来越意识到与资料外洩和未授权存取敏感资讯相关的潜在风险。这种日益增强的意识导致了更严格的法规的出台,例如欧盟 (EU) 的《一般资料保护规范》(GDPR) 和美国的《加州消费者隐私法案》(CCPA)。这些法规对组织收集、储存和处理个人资料的方式进行了限制。
- COVID-19 带来了前所未有的挑战,要求组织专注于危机管理和业务永续营运。资料视觉化在帮助企业监控关键指标、识别潜在风险以及製定减轻疫情影响的策略方面发挥了关键作用。可见性使公司能够追踪供应链中断、分析客户行为的变化并监控其营运的财务状况。透过了解这些关键见解,组织能够更有效地应对危机并调整业务以确保业务永续营运。还有俄罗斯和乌克兰战争对整个包装生态系统的影响。
资料视觉化市场趋势
零售业将经历显着成长
- 资料视觉化使零售商能够更深入地了解客户行为、偏好和购买模式。可视化客户资料使零售商能够了解趋势、了解客户细分并制定个人化行销策略。资料的可视化表示使零售商能够做出资料驱动的决策、优化库存管理并提供符合客户需求的产品。客户分析的这些改进正在带来更有针对性的行销宣传活动、更好的客户体验和销售额的增加。
- 资料视觉化在增强零售公司的供应链管理方面发挥关键作用。存量基准、物流和订单履行等供应链资料的可见性使零售商能够识别瓶颈、优化流程并提高整体效率。供应链资料的即时可见性使零售商能够追踪库存变动、监控产品可用性并识别潜在的中断。这可以改善库存管理、减少缺货并提高预测准确性。
- 资料视觉化工具可让零售商即时监控销售业绩。透过互动式仪表板追踪关键绩效指标 (KPI),例如销售收益、转换率和平均交易价值。销售资料的即时可见性使零售商能够了解销售趋势,及时调整定价和促销,并解决出现的问题和机会。这使得零售商能够在竞争激烈的市场中保持敏捷并提高销售表现。
- 资料视觉化允许零售商透过了解个人偏好和行为来创建个人化的客户体验。透过视觉化客户资料(例如购买历史记录、浏览模式和人口统计资讯),零售商可以提供有针对性的建议、个人化优惠和客製化行销宣传活动。资料主导的个人化可提高客户满意度、忠诚度并鼓励重复购买。
北美占最大市场占有率
- 由于该地区的最终用户行业越来越多地采用先进技术,北美成为一个重要的市场。此外,该地区拥有强大的供应商,有助于市场成长。北美的资料视觉化应用受到巨量资料的兴起和零售业分析需求等因素的推动。
- 由于中小型企业产生的资料量不断增加,美国的资料视觉化市场正在经历健康成长。例如,数位资讯平台上每天都在产生大量资料。据IBM公司称,每天会产生2.5亿位元组的资料。
- 2021 年 7 月,美国海岸警卫队采用了 COVID-19资料视觉化工具,帮助指挥官做出从疫苗分发到行动准备的明智决策,并采用新技术来改善警卫隐私,并采取预防措施确保安全不受影响。该计划旨在教授情境察觉和观点,不应直接影响个人。
- 加拿大市场各领域越来越多地采用资料主导的决策。云端业务管理解决方案供应商 Sage 于 2021 年 3 月在美国和加拿大市场推出了针对 Sage 300 和 Sage 100 的首个云端 Sage 资料和分析服务整合。其商业情报套件可藉助人工智慧和机器学习演算法为使用者提供即时销售仪表板和详细的损益表。此类技术创新预计将推动所研究的市场。
- 由于北美是基于技术的解决方案的重要市场,因此越来越需要追踪不同来源的资料并将其组合成各种资料表示形式以做出关键业务决策。
资料视觉化行业概况
资料视觉化市场的竞争是温和的。该市场中的公司正在透过提供策略解决方案来扩大其市场占有率和基本客群进行创新。这使您能够赢得新合约并探索新市场。
- 2023 年 4 月 - Atlassian Marketplace 合作伙伴 Amovos SRO 凭藉其 Custom Charts for Jira 和 Custom Charts for Confluence 应用程式简化了着名的 Jira 和 Confluence,加入了同意被收购的领先产品组合管理解决方案提供商 Tempo Software。此次收购增强了 Tempo 基于 Atlassian 的产品套件,提供易于使用且可自订的 Jira资料视觉化功能,使团队能够专注于快速完成任务,而无需使用繁琐的企业彙报工具。
- 2022 年 9 月:微软和 Grafana Labs 签订策略协议,使 Grafana 与 Azure 云端平台原生相容。 Azure Monitor 和 Azure Data Explorer 只是 Microsoft 新的 Azure 託管 Grafana 服务提供本机连接的两个云端服务。 Microsoft Azure Managed Grafana 9.0 版包含更好的警报功能,可提醒 IT 管理员注意潜在的技术困难。此版本还包含区域冗余和 API 金钥支援。
其他好处:
- Excel 格式的市场预测 (ME) 表
- 3 个月分析师支持
目录
第一章简介
- 研究成果
- 研究场所
- 调查范围
第二章调查方法
第三章执行摘要
第四章市场动态
- 市场概况
- 产业吸引力-波特五力分析
- 新进入者的威胁
- 买家/消费者的议价能力
- 供应商的议价能力
- 替代品的威胁
- 竞争公司之间敌对关係的强度
- 价值链分析
- 市场促进因素与市场约束因素介绍
- 市场驱动因素
- 资料视觉化解决方案云端部署
- 对快速决策的需求不断增加
- 市场限制因素
- 缺乏技术纯熟劳工/技能不足
第五章技术蓝图
第六章 市场细分
- 按组织单位
- 高阶主管
- 行销
- 手术
- 金融
- 销售部
- 其他组织部门
- 按发展
- 本地
- 云端/点播
- 按最终用户
- BFSI
- 资讯科技/通讯
- 零售/电子商务
- 教育
- 製造业
- 政府机构
- 其他最终用户
- 按地区
- 北美洲
- 欧洲
- 亚太地区
- 拉丁美洲
- 中东/非洲
第七章 竞争格局
- 公司简介
- Salesforce.com Inc.(Tableau Software Inc.)
- SAP SE
- SAS Institute Inc.
- Microsoft Corporation
- Oracle Corporation
- TIBCO Software Inc.
- IBM Corporation
- Information Builders
- Dundas Data Visualization Inc.
- Pentaho Corporation
- InetSoft Technology Corporation
- MicroStrategy Inc.
第八章投资分析
第九章 市场机会及未来趋势
The Data Visualization Market size is estimated at USD 10.92 billion in 2025, and is expected to reach USD 18.36 billion by 2030, at a CAGR of 10.95% during the forecast period (2025-2030).
The emerging nature of data visualization encourages a shift toward analytically driven businesses, where users can explore data in various forms of graphical representation, initially only available in tabular reports.
Key Highlights
- Across many industries, businesses are realizing the benefits of data-driven decision-making. Extracting useful information from big, complicated databases is becoming increasingly important. Data visualization is essential for demystifying complex information and presenting it in a visually appealing manner that is simple to comprehend and analyze. As companies look for ways to extract valuable insights from their data, inference implies that the market for data visualization tools will keep growing. Decision-makers may find patterns, trends, and correlations by efficiently visualizing data, which helps them make more well-informed strategic decisions.
- The term "augmented reality" refers to a technology that overlays digital data, such as visualizations, on the physical environment. A new development that has the potential to change the market completely is the incorporation of AR with data visualization tools. AR can give consumers an immersive and engaging experience that enables them to explore and analyze data in novel ways by superimposing data visualizations onto real-world objects or environments. This technology can be used in several fields, including manufacturing, healthcare, and retail, where real-time data visualization in a geographical context can improve judgment, training, and consumer interaction.
- The combination of natural language processing and conversational interfaces is another distinctive market driver for data visualization. NLP enables computers to comprehend, translate, and produce human language, allowing users to communicate with data visualization tools using natural language instructions or queries. Through dialogues with the system, users can ask questions, request certain visualizations, or examine data by utilizing NLP. Due to its lower learning curve than conventional graphical user interfaces, this driver may make data visualization more approachable to a wider audience. Additionally, it creates possibilities for data-driven decision-making via voice-enabled gadgets like smart speakers and virtual assistants.
- Data privacy and security have become major concerns as the volume of data being generated and analyzed continues to increase. Inference suggests that organizations and individuals are becoming more aware of the potential risks associated with data breaches and unauthorized access to sensitive information. This heightened awareness has led to stricter regulations, such as the General Data Protection Regulation (GDPR) in the European Union and the California Consumer Privacy Act (CCPA) in the United States. These regulations impose limitations on how organizations collect, store, and process personal data.
- COVID-19 brought about unprecedented challenges, requiring organizations to focus on crisis management and business continuity. Data visualization played a vital role in helping businesses monitor key metrics, identify potential risks, and develop strategies to mitigate the impact of the pandemic. Visualizations enabled organizations to track supply chain disruptions, analyze customer behavior shifts, and monitor the financial health of their businesses. By visualizing these critical insights, organizations could respond more effectively to the crisis and adapt their operations to ensure business continuity. There has also been an impact of the Russia-Ukraine war on the overall packaging ecosystem.
Data Visualization Market Trends
Retail Segment to Witness Significant Growth
- Data visualization has enabled retailers to gain deeper insights into customer behavior, preferences, and purchasing patterns. By visualizing customer data, retailers can identify trends, understand customer segmentation, and personalize their marketing strategies. Visual representations of data help retailers make data-driven decisions, optimize inventory management, and tailor their product offerings to meet customer demands. This improved customer analytics has resulted in more targeted marketing campaigns, better customer experiences, and increased sales.
- Data visualization plays a crucial role in enhancing supply chain management for retailers. By visualizing supply chain data, including inventory levels, logistics, and order fulfillment, retailers can identify bottlenecks, optimize processes, and improve overall efficiency. Real-time visualization of supply chain data enables retailers to track inventory movement, monitor product availability, and identify potential disruptions. This leads to improved inventory management, reduced stockouts, and better forecasting accuracy.
- With the help of data visualization tools, retailers can monitor sales performance in real time. Through interactive dashboards, they can track key performance indicators (KPIs), such as sales revenue, conversion rates, and average transaction value. Real-time visualization of sales data enables retailers to identify sales trends, make timely adjustments to pricing and promotions, and address issues or opportunities as they arise. This helps retailers stay agile and responsive in a competitive market, improving sales performance.
- Data visualization empowers retailers to create personalized customer experiences by understanding individual preferences and behavior. Retailers can deliver targeted recommendations, personalized offers, and customized marketing campaigns by visualizing customer data, such as purchase history, browsing patterns, and demographic information. Data-driven personalization enhances customer satisfaction, increases loyalty, and drives repeat purchases.
North America to Hold Largest Market Share
- North America is a prominent market owing to the growing adoption of advanced technologies by end-user industries across the region. Moreover, the area has a strong foothold of vendors, contributing to the market's growth. Data visualization applications in North America are driven by factors such as growth in big data and the need for analytics in the retail sector.
- The United States data visualization market is witnessing healthy growth due to the increasing amount of data generated in small- and medium-scale firms. For instance, a massive amount of data is being developed on digital information platforms every day. According to IBM Corporation, 2.5 quintillion bytes of data are generated daily.
- In July 2021, the United States Coast Guard adopted COVID-19 data visualization tools to assist commanders in making informed decisions on everything from vaccine distribution to operational readiness and has taken precautions to guarantee that the new technologies do not compromise guardsmen's privacy and security. The program aims to teach situational awareness and perspective, and it should not directly impact individuals.
- The implementation of data-driven decision-making is also rising in Canadian markets across various sectors. Cloud business management solutions vendor Sage launched its cloud-first Sage Data and Analytics service integration for Sage 300 and Sage 100 in the US and Canadian markets in March 2021. Its business intelligence toolkit can provide users with live sales dashboards and detailed P&L reports with the help of AI and machine learning algorithms. Such innovations are expected to drive the studied market.
- An increasing need to track data from various sources and compile it into different data representations to make critical business decisions can be observed in North America, as this region is a significant market for technology-based solutions.
Data Visualization Industry Overview
The data visualization market is moderately competitive. The players in the market are innovating in providing strategic solutions to increase their market presence and customer base. This enables them to secure new contracts and tap new markets.
- April 2023 - Amovos SRO, an Atlassian Marketplace Partner that simplifies Jira and Confluence with its well-known Custom Charts for Jira and Custom Charts for Confluence apps, had agreed to be acquired by Tempo Software, a leading provider of portfolio management solutions for product development organizations. With Jira data visualizations that are simple to use and customizable thanks to the purchase, Tempo's Atlassian-based product suite will grow, allowing teams to concentrate on finishing tasks swiftly rather than fumbling with cumbersome corporate reporting tools.
- September 2022: To make Grafana natively compatible with the Azure cloud platform, Microsoft and Grafana Labs established a strategic agreement. Azure Monitor and Azure Data Explorer are just two cloud services that Microsoft's new Azure Managed Grafana service offers native connections. Version 9.0 of Microsoft's Azure Managed Grafana includes a better alerting feature to inform IT administrators of potential technical difficulties. Zone redundancy and support for an API key are also included in this edition.
Additional Benefits:
- The market estimate (ME) sheet in Excel format
- 3 months of analyst support
TABLE OF CONTENTS
1 INTRODUCTION
- 1.1 Study Deliverables
- 1.2 Study Assumptions
- 1.3 Scope of the Study
2 RESEARCH METHODOLOGY
3 EXECUTIVE SUMMARY
4 MARKET DYNAMICS
- 4.1 Market Overview
- 4.2 Industry Attractiveness - Porter's Five Forces Analysis
- 4.2.1 Threat of New Entrants
- 4.2.2 Bargaining Power of Buyers/Consumers
- 4.2.3 Bargaining Power of Suppliers
- 4.2.4 Threat of Substitute Products
- 4.2.5 Intensity of Competitive Rivalry
- 4.3 Value Chain Analysis
- 4.4 Introduction to Market Drivers and Restraints
- 4.5 Market Drivers
- 4.5.1 Cloud Deployment of Data Visualization Solutions
- 4.5.2 Increasing Need for Quick Decision Making
- 4.6 Market Restraints
- 4.6.1 Lack of Tech Savvy and Skilled Workforce/Inability
5 TECHNOLOGY ROADMAP
6 MARKET SEGMENTATION
- 6.1 Organizational Department
- 6.1.1 Executive Management
- 6.1.2 Marketing
- 6.1.3 Operations
- 6.1.4 Finance
- 6.1.5 Sales
- 6.1.6 Other Organizational Departments
- 6.2 Deployment Mode
- 6.2.1 On-premise
- 6.2.2 Cloud/On-demand
- 6.3 End User
- 6.3.1 BFSI
- 6.3.2 IT and Telecommunication
- 6.3.3 Retail/E-commerce
- 6.3.4 Education
- 6.3.5 Manufacturing
- 6.3.6 Government
- 6.3.7 Other End Users
- 6.4 Geography
- 6.4.1 North America
- 6.4.2 Europe
- 6.4.3 Asia-Pacific
- 6.4.4 Latin America
- 6.4.5 Middle East and Africa
7 COMPETITIVE LANDSCAPE
- 7.1 Company Profiles
- 7.1.1 Salesforce.com Inc. (Tableau Software Inc.)
- 7.1.2 SAP SE
- 7.1.3 SAS Institute Inc.
- 7.1.4 Microsoft Corporation
- 7.1.5 Oracle Corporation
- 7.1.6 TIBCO Software Inc.
- 7.1.7 IBM Corporation
- 7.1.8 Information Builders
- 7.1.9 Dundas Data Visualization Inc.
- 7.1.10 Pentaho Corporation
- 7.1.11 InetSoft Technology Corporation
- 7.1.12 MicroStrategy Inc.
8 INVESTMENT ANALYSIS
9 MARKET OPPORTUNITIES AND FUTURE TRENDS
 2026年全球数据视觉化生成式人工智慧(AI)市场报告
 供应链视觉化软体市场预测:至 2034 年—按组件、部署类型、企业规模、最终用户和地区分類的全球分析2026年全球数据数位化市场报告
 人工智慧心智图工具市场:按部署类型、定价模式、技术组件、应用、部署模式和组织规模划分,全球预测,2026-2032年
 感测器资料分析市场分析及预测(至2035年):按类型、产品类型、服务、技术、组件、应用、设备、最终用户和部署类型划分
 数据驱动型市场-全球产业规模、份额、趋势、机会及预测(按类型、应用、垂直产业、地区及竞争格局划分,2021-2031年)AI智慧型视觉化网关市场按产品类型、部署类型、最终用户、应用和分销管道划分 - 全球预测(2026-2032年)人工智慧感测器市场:按感测器类型、技术、应用和最终用户划分,全球预测(2026-2032年)感测器资料分析市场:2026-2032年全球预测(按感测器类型、技术、部署类型、应用和最终用户划分)
 数据市场-2026-2031年预测