


 |
市场调查报告书
商品编码
1851878
挥发性有机化合物(VOC)气体感测器:市场份额分析、行业趋势、统计数据和成长预测(2025-2030 年)Volatile Organic Compound Gas Sensor - Market Share Analysis, Industry Trends & Statistics, Growth Forecasts (2025 - 2030) |
||||||
※ 本网页内容可能与最新版本有所差异。详细情况请与我们联繫。
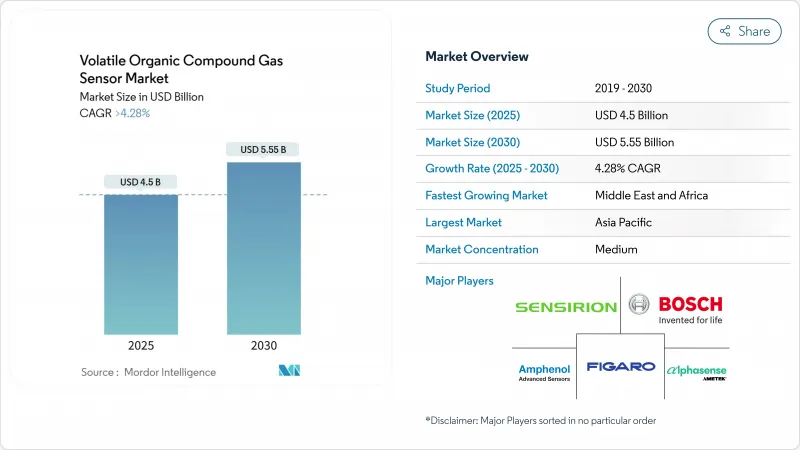
VOC感测器市场预计到2025年将达到45亿美元,到2030年将达到55.5亿美元,复合年增长率为4.28%。
随着室内空气品质法规收紧挥发性有机化合物(VOC)的允许暴露限值,商业建筑纷纷安装连续监测设备,市场需求也随之增强。智慧家庭中心供应商将VOC检测功能与高级产品捆绑销售,以凸显其差异化优势;汽车製造商和电池製造商则依赖快速反应感测器来检测电动车生产线中的溶剂洩漏。低功耗电子机械系统光电离检测器使得工业人员能够佩戴徽章式设备,而绿色建筑认证也为即时空气品质报告提供加分。这些趋势共同推动了全球VOC感测器市场的成长。
全球挥发性有机化合物(VOC)气体感测器市场趋势及洞察
北美和欧洲正在收紧室内空气品质标准
建筑物业主必须证明其持续遵守日益严格的甲醛、苯和其他挥发性有机化合物(VOC)暴露法规。大规模采购固定式壁挂式检测器和BACnet网关,有助于医院、学校、交通枢纽等场所快速维修。市场需求主要集中在符合ASHRAE-62.1和EN-16798标准的计划中,这将推动VOC感测器市场在短期内保持成长势头。
将VOC感测器整合到智慧家居物联网平台
语音助理中心和智慧温控器正将VOC(挥发性有机化合物)检测定位为一项健康功能。功耗低于20mW的MOS晶片透过I2C或BLE介面集成,而Matter 1.2互通性则实现了与供应商无关的配对。高出货量将扩大潜在用户群并降低单价,从而维持VOC感测器市场的中期成长。
高湿度环境下PID感测器的校准漂移
在相对湿度高于 85% 的环境中,水分子会抑制光电离,这可能导致 PID 输出降低 15%。使用者需要承担补偿演算法和频繁重新校准的额外成本,这限制了其在东南亚和南美洲一些食品加工厂和纸浆厂的短期应用。
细分市场分析
MOS元件凭藉其优异的性价比,将在2024年占据最大的VOC感测器市场份额,达到26%的销售额。光电离检测器)到2030年将维持8.2%的复合年增长率,超过VOC感测器市场的整体成长速度。高阶工业用户需要反应时间小于3秒且化学成分检测范围广的感测器,这推动了PID模组VOC感测器市场规模的成长。未来的MOS蓝图将采用多像素阵列来实现物种选择性,而PID供应商正在探索石墨烯视窗技术以实现亚ppm级的灵敏度。
即使晶圆成本下降和温度调製演算法推动了PID和石英微天平设计等细分应用的发展,MOS元件整体市场份额仍将保持现有水准。参与企业必须克服涵盖加热器驱动模式的丛集智慧财产权,这构成了VOC感测器市场的一大障碍。
到2024年,壁挂式面板将占总收入的41.5%,并将继续作为依赖PoE供电的楼宇自动化维修的核心。穿戴式徽章的复合年增长率将达到9.6%,成为成长最快的产品,反映出监管机构对数位日誌中个人暴露资料的重视。随着MEMS-PID设计实现8小时的电池续航时间,徽章相关VOC感测器的市场规模将稳定成长。
可携式手持检测器对紧急应变人员仍然有用,但其市场份额正被支援合规性文件的连续式固定监测器蚕食。多参数室内空气品质监测仪仍然是挥发性有机化合物(VOC)感测器市场的重要组成部分,儘管它们面临来自智慧恆温器厂商的竞争,这些厂商将各个感测器直接整合到主机板子卡上。
区域分析
亚太地区预计到2024年将占全球销售额的31.9%,主要得益于中国、日本和韩国的超级工厂以及正极活性材料产能的扩张。 PID感测器与边缘分析设备相结合,能够满足快速合规性审核的需求,并可向当地环保部门即时提供数据看板。对电池和半导体供应链的投资使亚太地区成为VOC感测器市场最重要的区域。
北美正受益于联邦税额扣抵抵免资助的建筑维修週期,该抵免补贴了整合 VOC 监测的高效 HVAC 系统;企业园区正在使用 LoRaWAN IAQ 节点来追踪职场的健康状况;加拿大绿色建筑委员会正在为持续报告授予 LEED 积分,从而加强了 VOC 感测器市场。
欧盟生态设计指令鼓励製造商揭露产品在使用过程中的挥发性有机化合物(VOC)效能。在德国的汽车喷漆车间,固定监测器将丙酮蒸气控制在10ppm以下。中东和非洲地区的复合年增长率(CAGR)最高,达9.2%。沙乌地阿拉伯和阿联酋的智慧城市试点计画在市政指挥中心引入了室内空气品质(IAQ)仪錶盘,南非的矿山试点计画则为井下工人佩戴可穿戴徽章,这些倡议都推动了该地区VOC感测器市场的扩张。
南美洲正经历稳定成长。巴西已将其国家暴露限值与美国政府工业卫生学家协会(ACGIH)标准表接轨,从而促进了其位于圣保罗附近石化联合体的采购。墨西哥的加工出口走廊正在增加低成本的金属氧化物半导体(MOS)感测器,以符合美墨加协定(USMCA)的环境条款,从而推动了该地区挥发性有机化合物(VOC)感测器市场的发展。
其他福利:
- Excel格式的市场预测(ME)表
- 3个月的分析师支持
目录
第一章 引言
- 研究假设和市场定义
- 调查范围
第二章调查方法
第三章执行摘要
第四章 市场情势
- 市场概览
- 市场驱动因素
- 北美和欧洲的室内空气品质标准日益严格
- 将VOC感测器整合到智慧家居物联网平台
- 亚洲电动车电池生产线对溶剂外洩检测的需求
- 低功耗MEMS-PID感测器可协助实现穿戴式VOC徽章
- 绿建筑认证系统要求持续监测挥发性有机化合物(VOC)。
- 市场限制
- 高湿度环境下PID感测器校准漂移
- 感测器品牌之间缺乏统一的互通性通讯协定
- 智慧家庭市场细分领域的价格敏感性
- 半导体感测器材料供应链的波动
- 价值/供应链分析
- 监管和技术展望
- 波特五力分析
- 新进入者的威胁
- 买方的议价能力
- 供应商的议价能力
- 替代品的威胁
- 竞争对手之间的竞争
第五章 市场规模与成长预测
- 透过感测器技术
- 光电离检测器(PID)
- 金属氧化物半导体(MOS)
- 电化学感测器
- 光纤感测器
- 石英晶体共振器(QCM)
- 其他的
- 按设备外形规格
- 固定式/壁挂式显示器
- 手持式/可携式检测器
- 穿戴式徽章
- 整合式多参数室内空气品质监测仪
- 嵌入式感测器模组
- 连结性别
- 有线(BACnet、Modbus、乙太网路、CAN)
- 无线的
- Wi-Fi
- Bluetooth/ BLE
- Zigbee/ Thread
- LoRaWAN/ NB-IoT/LTE-M
- 按最终用途行业划分
- 工业製程安全
- 石油天然气和石化
- 汽车/运输设备
- 家用电器和智慧家居
- 商业大楼和办公大楼
- 医疗保健和製药
- 食品和饮料製造
- 学术和研发实验室
- 其他的
- 透过检测范围
- 低于1ppm
- 1~10 ppm
- 10-100 ppm
- 100ppm 或更高
- 透过分销管道
- 直销
- 分销商/加值经销商通路
- 电子商务
- 按地区
- 北美洲
- 美国
- 加拿大
- 墨西哥
- 欧洲
- 英国
- 德国
- 法国
- 义大利
- 其他欧洲地区
- 亚太地区
- 中国
- 日本
- 印度
- 韩国
- 亚太其他地区
- 中东
- 以色列
- 沙乌地阿拉伯
- 阿拉伯聯合大公国
- 土耳其
- 其他中东地区
- 非洲
- 南非
- 埃及
- 其他非洲地区
- 南美洲
- 巴西
- 阿根廷
- 其他南美洲国家
- 北美洲
第六章 竞争情势
- 市场集中度
- 策略趋势
- 市占率分析
- 公司简介
- ABB Ltd.
- Alphasense Ltd.
- Aeroqual Limited
- Ion Science Ltd.
- EcoSensors Inc.
- SGX Sensortech Ltd.
- Renesas Electronics Corp.
- Sensirion AG
- Amphenol Advanced Sensors
- Figaro Engineering Inc.
- Bosch Sensortec GmbH
- AMS OSRAM AG
- City Technology(Honeywell Intl.)
- GfG Europe Ltd.
- MicroJet Technology Co., Ltd.
- Riken Keiki Co., Ltd.
- Dragerwerk AG and Co. KGaA
- Kaiterra
- Siemens AG
- Spec Sensors LLC
- NevadaNano Inc.
- Zhengzhou Winsen Electronics Tech. Co., Ltd.
第七章 市场机会与未来展望
The VOC sensors market stands at USD 4.5 billion in 2025 and is projected to reach USD 5.55 billion by 2030, reflecting a 4.28% CAGR.
Demand strengthens as indoor-air-quality codes narrow permissible volatile-organic-compound exposure limits, prompting commercial buildings to install continuous monitors. Smart-home hub vendors bundle VOC detection to distinguish premium offerings, while automotive and battery manufacturers rely on rapid-response sensors to detect solvent leakage on electric-vehicle production lines. Low-power micro-electromechanical-system photoionization detectors allow badge-style wearables for industrial staff, and green-building certifications award points for real-time air-quality reporting. These converging trends anchor growth across the VOC sensors market worldwide.
Global Volatile Organic Compound Gas Sensor Market Trends and Insights
Stricter Indoor-Air-Quality Standards across North America & Europe
Building owners must demonstrate continuous compliance with tightened exposure limits for formaldehyde, benzene and other VOCs. Bulk procurement of fixed wall-mounted detectors and BACnet gateways supports rapid retrofits in hospitals, schools and transit hubs. Demand concentrates on projects governed by ASHRAE-62.1 and EN-16798 guidelines, anchoring short-term momentum for the VOC sensors market.
Integration of VOC Sensors into Smart-Home IoT Platforms
Voice-assistant hubs and connected thermostats position VOC sensing as a wellness feature. MOS chips drawing less than 20 mW integrate over I2C or BLE, while Matter 1.2 interoperability enables vendor-agnostic pairing. High shipment volumes widen the addressable base and lower unit prices, sustaining medium-term growth for the VOC sensors market.
Calibration Drift of PID Sensors in High-Humidity Climates
PID output can drop 15% in environments above 85% relative humidity as water molecules quench photoionisation. Users incur added costs for compensation algorithms and frequent recalibration, tempering near-term uptake in food-processing plants and pulp mills across Southeast Asia and parts of South America.
Other drivers and restraints analyzed in the detailed report include:
- Demand from EV Battery Manufacturing Lines in Asia
- Adoption of Low-Power MEMS-PID Sensors Enabling Wearable Badges
- Lack of Harmonised Interoperability Protocols among Sensor Brands
For complete list of drivers and restraints, kindly check the Table Of Contents.
Segment Analysis
MOS devices generated 26% of revenue in 2024, holding the largest VOC sensors market share because they balance price and performance. Photoionization detectors will post an 8.2% CAGR through 2030, outpacing the overall VOC sensors market. Premium industrial users require sub-3-second response times and wide chemical coverage, driving the VOC sensors market size for PID modules upward. Future MOS roadmaps incorporate multi-pixel arrays for species selectivity, while PID vendors explore graphene windows to reach sub-ppm sensitivity.
Across the MOS segment, falling wafer costs and temperature-modulation algorithms safeguard incumbent share even as niche applications shift to PID or quartz-crystal microbalance designs. Entrants must navigate intellectual-property clusters covering heater-drive patterns, which raise barriers in the VOC sensors market.
Wall-mounted panels captured 41.5% of 2024 revenue and remain core to building-automation retrofits that rely on PoE cabling. Wearable badges post the highest 9.6% CAGR, reflecting regulatory emphasis on personal exposure data in digital logbooks. The VOC sensors market size tied to badges climbs steadily as MEMS-PID designs prove eight-hour battery life.
Portable handheld detectors retain relevance for first responders but cede volume to continuous fixed monitors that support compliance documentation. Multi-parameter IAQ cubes face competition from smart-thermostat OEMs that integrate individual sensors directly onto motherboard daughtercards, yet they still contribute meaningfully to the VOC sensors market.
The Volatile Organic Compound Gas Sensor Market Report is Segmented by Sensor Technology (Photoionization Detector, Optical, and More), Device Form Factor (Wearable Badges, and More), Connectivity (Wired, Wireless), End-Use Industry (Industrial Safety, and More), Detection Range (Less Than 1 Ppm, and More), Distribution Channel (Direct Sales, and More), and Geography. The Market Forecasts are Provided in Terms of Value (USD).
Geography Analysis
Asia-Pacific contributed 31.9% of 2024 turnover, supported by gigafactory and cathode-active-material capacity expansions in China, Japan and South Korea. PID sensors pair with edge-analytics boxes to meet rapid compliance audits that require real-time dashboards delivered to provincial environmental bureaus. Investments in battery and semiconductor supply chains position Asia-Pacific as the foremost region within the VOC sensors market.
North America benefits from a building-retrofit cycle funded by federal tax credits that subsidize high-efficiency HVAC systems integrating VOC monitoring. Enterprise campuses use LoRaWAN IAQ nodes to track workplace wellness, and Canada's green-building council awards LEED points for continuous reporting, reinforcing the VOC sensors market.
Europe's Ecodesign directive pushes manufacturers to disclose VOC performance in use. Fixed monitors maintain acetone vapors below 10 ppm in German automotive paint shops. The Middle East and Africa post the quickest 9.2% CAGR as smart-city pilots in Saudi Arabia and the United Arab Emirates embed IAQ dashboards into municipal command centers, and South African mines trial wearable badges for underground crews, enlarging the regional VOC sensors market.
South America experiences steadier growth. Brazil aligns national exposure limits with ACGIH tables, driving procurement by petrochemical complexes near Sao Paulo. Mexico's maquiladora corridor adds low-cost MOS sensors to comply with USMCA environmental clauses, supporting the VOC sensors market across the region.
- ABB Ltd.
- Alphasense Ltd.
- Aeroqual Limited
- Ion Science Ltd.
- EcoSensors Inc.
- SGX Sensortech Ltd.
- Renesas Electronics Corp.
- Sensirion AG
- Amphenol Advanced Sensors
- Figaro Engineering Inc.
- Bosch Sensortec GmbH
- AMS OSRAM AG
- City Technology (Honeywell Intl.)
- GfG Europe Ltd.
- MicroJet Technology Co., Ltd.
- Riken Keiki Co., Ltd.
- Dragerwerk AG and Co. KGaA
- Kaiterra
- Siemens AG
- Spec Sensors LLC
- NevadaNano Inc.
- Zhengzhou Winsen Electronics Tech. Co., Ltd.
Additional Benefits:
- The market estimate (ME) sheet in Excel format
- 3 months of analyst support
TABLE OF CONTENTS
1 INTRODUCTION
- 1.1 Study Assumptions and Market Definition
- 1.2 Scope of the Study
2 RESEARCH METHODOLOGY
3 EXECUTIVE SUMMARY
4 MARKET LANDSCAPE
- 4.1 Market Overview
- 4.2 Market Drivers
- 4.2.1 Tightening Indoor Air-Quality Standards across North America and Europe
- 4.2.2 Integration of VOC Sensors into Smart-Home IoT Platforms
- 4.2.3 Demand from EV Battery Manufacturing Lines in Asia for Solvent-Leak Detection
- 4.2.4 Adoption of Low-Power MEMS-PID Sensors Enabling Wearable VOC Badges
- 4.2.5 Green-Building Certification Schemes Mandating Continuous VOC Monitoring
- 4.3 Market Restraints
- 4.3.1 Calibration Drift of PID Sensors in High-Humidity Climates
- 4.3.2 Lack of Harmonised Interoperability Protocols among Sensor Brands
- 4.3.3 Price Sensitivity in Mass-Market Smart-Home Segment
- 4.3.4 Supply-Chain Volatility for Semiconductor Sensor Materials
- 4.4 Value / Supply-Chain Analysis
- 4.5 Regulatory or Technological Outlook
- 4.6 Porter's Five Forces Analysis
- 4.6.1 Threat of New Entrants
- 4.6.2 Bargaining Power of Buyers
- 4.6.3 Bargaining Power of Suppliers
- 4.6.4 Threat of Substitute Products
- 4.6.5 Intensity of Competitive Rivalry
5 MARKET SIZE AND GROWTH FORECASTS (VALUE)
- 5.1 By Sensor Technology
- 5.1.1 Photoionization Detector (PID)
- 5.1.2 Metal Oxide Semiconductor (MOS)
- 5.1.3 Electrochemical Sensor
- 5.1.4 Optical Fiber Sensor
- 5.1.5 Quartz Crystal Microbalance (QCM)
- 5.1.6 Others
- 5.2 By Device Form Factor
- 5.2.1 Fixed/Wall-Mounted Monitors
- 5.2.2 Handheld/Portable Detectors
- 5.2.3 Wearable Badges
- 5.2.4 Integrated Multi-Parameter IAQ Monitors
- 5.2.5 Embedded Sensor Modules
- 5.3 By Connectivity
- 5.3.1 Wired (BACnet, Modbus, Ethernet, CAN)
- 5.3.2 Wireless
- 5.3.2.1 Wi-Fi
- 5.3.2.2 Bluetooth/BLE
- 5.3.2.3 Zigbee/Thread
- 5.3.2.4 LoRaWAN/NB-IoT/LTE-M
- 5.4 By End-use Industry
- 5.4.1 Industrial Process Safety
- 5.4.2 Oil and Gas and Petrochemical
- 5.4.3 Automotive and Transportation
- 5.4.4 Consumer Electronics and Smart Homes
- 5.4.5 Commercial Buildings and Offices
- 5.4.6 Healthcare and Pharmaceuticals
- 5.4.7 Food and Beverage Production
- 5.4.8 Academic and RandD Laboratories
- 5.4.9 Others
- 5.5 By Detection Range
- 5.5.1 Less than 1 ppm
- 5.5.2 1 - 10 ppm
- 5.5.3 10 - 100 ppm
- 5.5.4 Greater than 100 ppm
- 5.6 By Distribution Channel
- 5.6.1 Direct Sales
- 5.6.2 Distributor / VAR Channel
- 5.6.3 E-commerce
- 5.7 By Geography
- 5.7.1 North America
- 5.7.1.1 United States
- 5.7.1.2 Canada
- 5.7.1.3 Mexico
- 5.7.2 Europe
- 5.7.2.1 United Kingdom
- 5.7.2.2 Germany
- 5.7.2.3 France
- 5.7.2.4 Italy
- 5.7.2.5 Rest of Europe
- 5.7.3 Asia-Pacific
- 5.7.3.1 China
- 5.7.3.2 Japan
- 5.7.3.3 India
- 5.7.3.4 South Korea
- 5.7.3.5 Rest of Asia-Pacific
- 5.7.4 Middle East
- 5.7.4.1 Israel
- 5.7.4.2 Saudi Arabia
- 5.7.4.3 United Arab Emirates
- 5.7.4.4 Turkey
- 5.7.4.5 Rest of Middle East
- 5.7.5 Africa
- 5.7.5.1 South Africa
- 5.7.5.2 Egypt
- 5.7.5.3 Rest of Africa
- 5.7.6 South America
- 5.7.6.1 Brazil
- 5.7.6.2 Argentina
- 5.7.6.3 Rest of South America
- 5.7.1 North America
6 COMPETITIVE LANDSCAPE
- 6.1 Market Concentration
- 6.2 Strategic Moves
- 6.3 Market Share Analysis
- 6.4 Company Profiles {(includes Global level Overview, Market level overview, Core Segments, Financials as available, Strategic Information, Market Rank/Share for key companies, Products and Services, and Recent Developments)}
- 6.4.1 ABB Ltd.
- 6.4.2 Alphasense Ltd.
- 6.4.3 Aeroqual Limited
- 6.4.4 Ion Science Ltd.
- 6.4.5 EcoSensors Inc.
- 6.4.6 SGX Sensortech Ltd.
- 6.4.7 Renesas Electronics Corp.
- 6.4.8 Sensirion AG
- 6.4.9 Amphenol Advanced Sensors
- 6.4.10 Figaro Engineering Inc.
- 6.4.11 Bosch Sensortec GmbH
- 6.4.12 AMS OSRAM AG
- 6.4.13 City Technology (Honeywell Intl.)
- 6.4.14 GfG Europe Ltd.
- 6.4.15 MicroJet Technology Co., Ltd.
- 6.4.16 Riken Keiki Co., Ltd.
- 6.4.17 Dragerwerk AG and Co. KGaA
- 6.4.18 Kaiterra
- 6.4.19 Siemens AG
- 6.4.20 Spec Sensors LLC
- 6.4.21 NevadaNano Inc.
- 6.4.22 Zhengzhou Winsen Electronics Tech. Co., Ltd.
7 MARKET OPPORTUNITIES AND FUTURE OUTLOOK
- 7.1 White-Space and Unmet-Need Assessment


