


 |
市场调查报告书
商品编码
1631638
亚太地区风力发电机叶轮:市场占有率分析、产业趋势和成长预测(2025-2030)Asia Pacific Wind Turbine Rotor Blade - Market Share Analysis, Industry Trends & Statistics, Growth Forecasts (2025 - 2030) |
||||||
※ 本网页内容可能与最新版本有所差异。详细情况请与我们联繫。
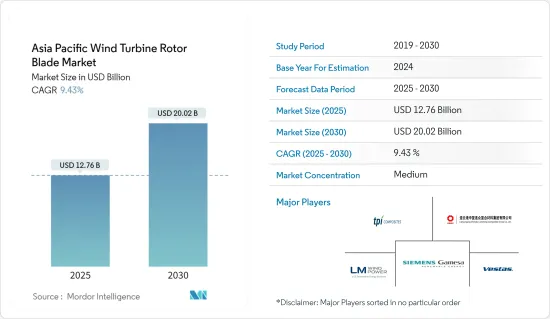
预计2025年亚太地区风力发电机叶轮市场规模为127.6亿美元,预测期内(2025-2030年)复合年增长率为9.43%,到2030年将达到200.2亿美元。
从中期来看,风电成本下降和风电产业投资增加等因素预计将在预测期内推动亚太地区风力发电机叶轮市场的发展。
另一方面,运输成本的相关上升以及太阳能和水力发电等替代清洁能源的成本竞争等因素有可能在预测期内阻碍市场成长。
也就是说,风电产业需要具有成本效益的解决方案,而高效率的产品有可能改变产业的动态。在某些情况下,旧涡轮机被更换,不是因为损坏,而是因为市场上出现了更有效率的叶片。因此,技术发展很快将成为风力发电机叶轮市场的机会。
预计在预测期内,中国将主导亚太地区风力发电机叶轮市场。
亚太地区风力发电机叶轮市场趋势
土地领域主导市场
- 陆域风电技术在过去五年中不断发展,以最大限度地提高每兆瓦装置容量的发电量,并覆盖更多风速较低的地区。除此之外,近年来风力发电机变得越来越大,轮毂更高,直径更宽,风力发电机叶片也更大。
- 根据全球风能理事会(GWEC)预测,2022年亚太陆上风电市场将新增3,697千万瓦,占全球陆上风电总装置容量的53.72%。
- 中国和印度等几个主要国家的投资增加预计将在预测期内推动市场需求。中国和印度是世界上成长最快的经济体之一,因此国内电力消耗量也强劲成长。
- 在2021年石化燃料的COP26上,印度总理宣布,印度计划在2030年将排放强度降低45%以上,使其低于2005年的水平,并宣布到2030年能源容量将增加到500GW,到2030 年, 50% 的能源结构将是再生能源。
- 截至2022年1月,非石化燃料占总发电量的38.5%。风电目前占其中的10.2%。作为 2030 年气候行动的一部分,新能源和可再生能源部 (MNRE) 估计将需要 140GW 的风电容量。
- 2022 年 10 月,煤炭部下属公共部门企业 (PSU) NLC India Ltd. 宣布与新能源和可再生能源部下属研发机构国家风力发电研究所 (NIWE) 建立合作伙伴关係。开发陆域风发电工程的策略合作协议。
- 截至2022年,印度陆域风电装置容量持有全球第四。这些计划主要分布在该国的北部、南部和西部地区。根据IRENA统计,印度风电总装置容量为41.93兆瓦,较2021年的40.06兆瓦成长4.64%。
- 此外,根据国际能源总署的数据,平准化能源成本(LCOE)和全球加权平均总资本支出将从2016年的76.1美元/兆瓦时和1730.5美元/兆瓦时增加到2021年的48.2美元/兆瓦时。此外,LCOE 和平均加权资本支出预计在预测期内下降,并于 2025 年分别达到 44.6 美元/MWh 和 1338.2 美元/MWh。
- 由于平准化度电成本的降低和资本支出的减少,加上清洁能源来源带来的高能源需求,陆上大型风力发电机的叶轮市场预计将在预测期内成长。
中国主导市场
- 中国是世界上最大的能源消费国和可再生能源市场。该国一直在努力解决主要来自石化燃料发电厂排放气体的空气污染问题,并致力于扩大可再生能源产能,以满足不断增长的能源需求,同时减少整体排放。
- 作为「十四五」规划(2021-2025)的一部分,该国的目标是到2025年供应国内电力消耗的33%和非水力发电可再生能源的18%。该国的目标是到 2030 年将可再生能源发电增加到 3,300 太瓦。
- 在最新的国家自主贡献(NDC)中,中国承诺在 2030 年达到高峰排放并实现碳中和,作为其在《巴黎协定》下承诺的一部分。在能源目标方面,我们的目标是与 2005 年相比,单位 GDP 二氧化碳排放减少 65% 以上,并将风能和太阳能总合装置容量增加到 1,200 吉瓦。
- 基于该国可再生能源产业的快速成长,CarbonBrief估计,风能和太阳能装置1,200吉瓦的目标将在2030年的最后期限之前提前实现。风力发电装置容量的快速成长是由于解决环境问题所产生的需求增加,预计国内能源消耗的增加将在预测期内推动风力发电市场的发展。
- 中国每个省份都制定了可再生能源计划的单独目标,作为其国家目标的一部分。西北地区的内蒙古自治区和甘肃省设定的最大目标是利用大片沙漠地区的优势。两省计画在截至2022年5月的装置容量74GW的基础上,到2025年累积新增风电和太阳能发电工程190GW。紧随其后的是陕西、河北和山东,这些省份计划在 2021 年至 2025 年间新建太阳能和风电装置容量 190GW。
- 根据GWEC统计,2022年,中国风电总装置容量与前一年同期比较%。风力发电总设备容量约为365.44GW。
- 中国沿海地区正在重点发展新型离岸风力发电。广东省计画在2025年离岸风力发电达1800万千瓦,福建省、浙江省和江苏省计画到2025年离岸风力发电分别为1330千万瓦、600万千瓦和900万千瓦。计划.
- 山东省计画在2030年新增离岸风力发电装置容量3500万千瓦,同时动工1000万千瓦计划,到2025年新增併网容量5000万千瓦。国家能源局(NEA)已批准海南省到2025年建设离岸风力发电1230万千瓦。
- 此外,2022年12月,中国风力发电机製造商明阳智慧能源宣布推出全球最长的抗颱风离岸风机MySE 16-260离岸风力发电机,这是2021年推出的16MW机型的升级版,转子直径为242m。製造风力发电机叶片。
- 因此,国有企业投资的增加和政府对风力发电的有利政策预计将在预测期内推动中国风力发电机叶轮市场的成长。
亚太地区风力发电机叶轮产业概况
亚太地区风力发电机叶轮市场较为分散。该市场的主要企业包括连云港中復连众复合材料集团、TPI Composites Inc.、LM Wind Power(GE 再生能源业务)、Siemens Gamesa Renewable Energy SA 和 Vestas Wind Systems A/S。
其他好处:
- Excel 格式的市场预测 (ME) 表
- 3 个月分析师支持
目录
第一章简介
- 调查范围
- 市场定义
- 研究场所
第 2 章执行摘要
第三章调查方法
第四章市场概况
- 介绍
- 2029年之前的市场规模与需求预测(单位:美元)
- 最新趋势和发展
- 政府法规政策
- 市场动态
- 促进因素
- 风力发电成本下降
- 加大风发电工程投资
- 抑制因素
- 更多采用替代清洁能源
- 促进因素
- 供应链分析
- 波特五力分析
- 供应商的议价能力
- 消费者议价能力
- 新进入者的威胁
- 替代品的威胁
- 竞争公司之间的敌对关係
第五章市场区隔
- 按部署地点
- 陆上
- 离岸
- 按刀片材质分
- 碳纤维
- 玻璃纤维
- 其他刀片材料
- 按地区
- 中国
- 印度
- 韩国
- 日本
- 马来西亚
- 泰国
- 印尼
- 越南
- 其他亚太地区
第六章 竞争状况
- 併购、合资、联盟、协议
- 主要企业策略
- Companies Profiles
- TPI Composites Inc.
- Lianyungang Zhongfu Lianzhong Composites Group Co., Ltd.
- LM Wind Power(a GE Renewable Energy Business)
- Siemens Gamesa Renewable Energy SA
- Vestas Wind Systems A/S
- Sinoma Technology Wind Power Blade Co., Ltd.
- Suzlon Energy Limited
- Nordex SE
- Enercon GmbH
- 市场排名/份额分析
第七章 市场潜力及未来趋势
- 新兴和未开发市场对离岸风力发电的兴趣日益浓厚
The Asia Pacific Wind Turbine Rotor Blade Market size is estimated at USD 12.76 billion in 2025, and is expected to reach USD 20.02 billion by 2030, at a CAGR of 9.43% during the forecast period (2025-2030).
Over the medium term, factors such as the declining cost of wind energy and increasing investments in the wind power sector are expected to drive the wind turbine rotor blade market in the Asia-Pacific region during the forecast period.
On the other hand, factors such as the associated high cost of transportation and cost competitiveness of alternate clean power sources like solar power, hydropower, etc., have the potential to hinder the market growth during the forecast period.
Nevertheless, the wind power industry has been in demand for cost-effective solutions, and a highly efficient product has the potential to change the dynamics of the industry. There were instances where old turbines were replaced, not because of the damage but due to the availability of more efficient blades in the market. Hence, technological developments present themselves as a good opportunity for the wind turbine rotor blade market soon.
China is expected to dominate the wind turbine rotor blade market in the Asia-Pacific region during the forecast period.
Asia-Pacific Wind Turbine Rotor Blade Market Trends
Onshore Segment to Dominate the Market
- The onshore wind energy power generation technology has evolved over the last five years to maximize electricity produced per megawatt capacity installed and to cover more sites with lower wind speeds. Besides this, in recent years, wind turbines have become larger with taller hub heights, broader diameters, and larger wind turbine blades.
- According to the Global Wind Energy Council (GWEC), the Asia-Pacific onshore wind market added 36.97 GW in 2022 and contributed 53.72% of the total global onshore wind installations in 2022.
- The growing investments in several major countries, such as China and India, are expected to drive the market demand during the forecast period. China and India are some of the fastest-growing economies in the world, and hence, they have registered significant growth in domestic power consumption.
- During COP26 in November 2021, the Prime Minister of India announced that India plans to reduce emission intensity by 45% or more by 2030, bringing it to levels below those of 2005, and announced 500 GW of non-fossil fuels energy capacity by 2030; 50% renewables in the energy mix by 2030.
- As of January 2022, non-fossil fuels represent 38.5% of overall power generation capacity. Wind currently accounts for 10.2% of this capacity. As part of its 2030 climate commitments, the Ministry of New and Renewable Energy (MNRE) estimates 140 GW of wind energy capacity is required.
- In October 2022, the NLC India Ltd., a Public Sector Undertaking (PSU) part of the Ministry of Coal, entered into a strategic collaboration agreement with the National Institute of Wind Energy (NIWE), an autonomous Research and Development institution under the Ministry of New and Renewable Energy (MNRE), for the development of onshore wind power projects in India.
- India holds the fourth-largest onshore wind power installed capacity globally as of 2022. These projects are majorly spread in the northern, southern, and western parts of the country. According to IRENA, India's total installed wind capacity was 41.93 GW, witnessing an increase of 4.64% compared to 40.06 GW in 2021.
- Moreover, according to the International Energy Agency, the Levelized cost of energy (LCOE) and global weighted average total CAPEX is likely to decrease from 76.1 USD/MWh and 1730.5 USD/MWh in 2016 to 48.2 USD/MWh and 1396.3 USD/MWh in 2021. In addition, the LCOE and average weighted CAPEX are expected to decrease in the forecast period to 44.6 USD/MWh and 1338.2 USD/MWh, respectively, by 2025.
- The onshore large wind turbine rotor blade market is expected to grow in the forecast period due to declining LCOE and reduced CAPEX, coupled with high energy demand through clean sources.
China to Dominate the Market
- China is the largest energy consumer and renewable energy market globally, and the country is rapidly expanding its renewable energy capacity to satiate its domestic energy demand. As the country has been suffering from air pollution caused primarily by fossil-fuel-fired power plant emissions, it has focused on expanding its renewable energy capacity to meet its growing energy demands while reducing overall emissions.
- As part of its 14th five-year plan (2021-2025), the country aims to supply 33% of national power consumption by 2025 and 18% of non-hydro renewables. The country aims to increase renewable energy generation to 3,300 TWh by 2030.
- In its latest updated Nationally Determined Contributions (NDC), China has committed to reaching peak emissions by 2030 and achieving carbon neutrality as part of its commitments under the Paris Agreement. In terms of energy targets, the country aims to cut C02 emissions per unit of GDP by more than 65% from 2005 levels and increase the total installed wind plus solar capacity to 1,200 GW.
- According to CarbonBrief, based on the rapid growth of the renewable energy industry in the country, it is estimated that China will reach its target of 1,200 GW of wind+solar deployment significantly ahead of its 2030 deadline. Such rapid growth in the installed wind energy capacity is due to the rising demand created due to environmental commitments, and the increasing domestic energy consumption is expected to drive the wind energy market during the forecast period.
- China's provinces have set up individual targets for renewable energy projects as a part of national targets. The largest targets have been set up by the northwestern provinces of Inner Mongolia and Gansu to leverage the presence of large tracts of uninhabited desert lands. These two provinces plan to add a cumulative 190 GW of wind and solar projects by 2025, in addition to the 74 GW of installed capacity as of May 2022. These provinces are followed by Shaanxi, Hebei, and Shandong, which have planned to install 190 GW of new solar and wind capacity additions during 2021-2025.
- According to GWEC, in 2022, the total wind installed capacity increased by 11.5% compared to the previous year in China. The total wind energy installed capacity accounted for about 365.44 GW.
- Coastal provinces in China have been focused on developing new offshore wind capacity. Guangdong aims to install 18 GW of offshore capacity by 2025, while Fujian, Zhejiang, and Jiangsu aim to install 13.3GW, 6GW, and 9GW of offshore wind power projects by 2025, respectively.
- Shandong aims to add 35 GW of offshore wind power capacity by 2030 while starting the construction of 10 GW of projects and adding 5 GW to the grid by 2025. The island province of Hainan has been permitted by the National Energy Administration (NEA) to build 12.3 GW of offshore wind by 2025.
- Further, in December 2022, Chinese wind turbine manufacturer Mingyang Smart Energy produced the World's Longest Anti-Typhoon Offshore Wind Turbine Blade for the MySE 16-260 offshore wind turbine, an elevated version of its 16 MW model, announced in 2021 with a 242-meter rotor diameter.
- Thus, the growing investment from state-owned companies and favorable government policies in wind energy generation are expected to drive the growth of the Chinese wind turbine rotor blade market during the forecast period.
Asia-Pacific Wind Turbine Rotor Blade Industry Overview
The Asia-Pacific wind turbine rotor blade market is moderately fragmented. Some of the major players in the market include Lianyungang Zhongfu Lianzhong Composites Group Co., Ltd., TPI Composites Inc., LM Wind Power (a GE Renewable Energy Business), Siemens Gamesa Renewable Energy S.A., and Vestas Wind Systems A/S, among others.
Additional Benefits:
- The market estimate (ME) sheet in Excel format
- 3 months of analyst support
TABLE OF CONTENTS
1 INTRODUCTION
- 1.1 Scope of the Study
- 1.2 Market Definition
- 1.3 Study Assumptions
2 EXECUTIVE SUMMARY
3 RESEARCH METHODOLOGY
4 MARKET OVERVIEW
- 4.1 Introduction
- 4.2 Market Size and Demand Forecast in USD, till 2029
- 4.3 Recent Trends and Developments
- 4.4 Government Policies and Regulations
- 4.5 Market Dynamics
- 4.5.1 Drivers
- 4.5.1.1 Declining Cost of Wind Energy
- 4.5.1.2 Increasing Investments in Wind Energy Power Generation Projects
- 4.5.2 Restraints
- 4.5.2.1 Increasing Adoption of Alternate Clean Power Sources
- 4.5.1 Drivers
- 4.6 Supply Chain Analysis
- 4.7 Porter's Five Forces Analysis
- 4.7.1 Bargaining Power of Suppliers
- 4.7.2 Bargaining Power of Consumers
- 4.7.3 Threat of New Entrants
- 4.7.4 Threat of Substitutes Products and Services
- 4.7.5 Intensity of Competitive Rivalry
5 MARKET SEGEMENTATION
- 5.1 Location of Deployment
- 5.1.1 Onshore
- 5.1.2 Offshore
- 5.2 Blade Material
- 5.2.1 Carbon Fiber
- 5.2.2 Glass Fiber
- 5.2.3 Other Blade Materials
- 5.3 Geography
- 5.3.1 China
- 5.3.2 India
- 5.3.3 South Korea
- 5.3.4 Japan
- 5.3.5 Malaysia
- 5.3.6 Thailand
- 5.3.7 Indonesia
- 5.3.8 Vietnam
- 5.3.9 Rest of Asia-Pacific
6 COMPETITIVE LANDSCAPE
- 6.1 Mergers and Acquisitions, Joint Ventures, Collaborations, and Agreements
- 6.2 Strategies Adopted by Leading Players
- 6.3 Companies Profiles
- 6.3.1 TPI Composites Inc.
- 6.3.2 Lianyungang Zhongfu Lianzhong Composites Group Co., Ltd.
- 6.3.3 LM Wind Power (a GE Renewable Energy Business)
- 6.3.4 Siemens Gamesa Renewable Energy S.A.
- 6.3.5 Vestas Wind Systems A/S
- 6.3.6 Sinoma Technology Wind Power Blade Co., Ltd.
- 6.3.7 Suzlon Energy Limited
- 6.3.8 Nordex SE
- 6.3.9 Enercon GmbH
- 6.4 Market Ranking/Share Analysis
7 MARKET OPPORTUNITIES and FUTURE TRENDS
- 7.1 Increasing Interest in Offshore Wind Energy from Developing and Untapped Markets
 全球碳纤维风力涡轮机转子叶片市场:按类型、叶片尺寸、应用和地区划分 - 市场规模、行业趋势、机会分析和预测(2025-2033 年)
 风力叶片回收市场:2035年前的产业趋势和全球预测 - 各回收方法,不同材料,各终端用户,各地区
 风力发电机叶轮:全球市场份额和排名、总收入和需求预测(2025-2031年)
 风力叶片回收市场分析及预测(至2034年):类型、产品、服务、技术、组件、应用、製程、最终用户、安装类型、解决方案
 风力发电机叶片检测服务市场(按检测方法、服务模式、涡轮机额定容量、叶片材质和最终用户划分)—2025-2032年全球预测风力发电机叶轮市场按涡轮机容量、叶片材质、涡轮机类型、风力等级和涂层类型划分 - 全球预测(2025-2032 年)
 2032 年风力发电机叶片市场预测:按材料、叶片类型、安装、製造流程、应用、最终用户和地区进行的全球分析全球可回收涡轮叶片市场:预测(至 2032 年)、材料类型、涡轮类型、回收技术、应用和地区分析
 2025年全球风力发电机叶片检测服务市场报告
 风电叶片回收市场:依叶片材料、回收方法、应用及地区划分