


 |
市场调查报告书
商品编码
1637896
美国风力发电-市场占有率分析、产业趋势与统计、成长预测(2025-2030)United States Wind Energy - Market Share Analysis, Industry Trends & Statistics, Growth Forecasts (2025 - 2030) |
||||||
价格
※ 本网页内容可能与最新版本有所差异。详细情况请与我们联繫。
简介目录
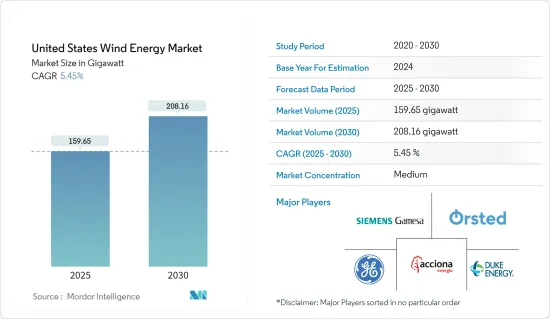
美国风力发电市场规模预计到2025年为159.65吉瓦,预计2030年将达到208.16吉瓦,预测期间(2025-2030年)复合年增长率为5.45%。
主要亮点
- 从中期来看,政府资金和联邦激励措施,包括通货膨胀减少法案(IRA)、税额扣抵和补贴、风力发电计划投资以及风力发电机成本降低,将推动美国风力发电市场的成长。
- 另一方面,来自其他可再生能源技术的竞争预计将阻碍研究期间的市场成长。
- 近海地区风力发电产业的扩张预计将在未来几年创造市场成长机会。
美国风力发电市场趋势
主导市场的土地领域
- 陆域风力发电是指位于陆地上的风力发电机利用自然气流所产生的电力。它是美国发展最快的可再生能源技术之一。风力发电机对于未来的无碳能源产业非常重要,因为它们不会排放空气或水污染物。
- 在过去的五年中,陆上风力发电技术已经发展到可以最大限度地提高每兆瓦装置功率输出的程度。儘管2023年天然气价格下降,但风力发电透过减少氮氧化物和二氧化碳排放,继续对电网、人类健康和环境产生正面影响。
- 例如,2023年美国陆上风电装置容量约为150.43GW,较2022年陆上风电装置容量144.3GW成长4.2%。风力发电的增加是由于通货膨胀控制法案的税收优惠,这使得风力发电变得更便宜。此外,风电成本的降低和供应链投资的增加也支持了成长。
- 2024年7月,密苏里州500兆瓦的高草原风电场开始运作,拥有175台先进风力发电机。该计划预计每年可为约 12 万户家庭发电。这是密苏里州 Ameren 45 亿美元投资计画的一部分,该计画旨在 2030 年增加 3,100 兆瓦的清洁能源产能。 High Prairie 风电场预计将为密苏里州到 2050 年实现净零碳排放的目标做出重大贡献。
- 根据全球风能理事会的数据,预计2024年至2028年间,中国、美国和欧洲等国家将启动近653吉瓦的陆上计划。
- 因此,由于额外的投资、技术进步和经济成长,陆上风力发电预计在未来几年将扩大。
加大投资带动市场
- 由于电力需求不断增加,美国正在推动风力发电成长以满足电力需求。在美国联邦政府和州政府的支持下,许多跨国和本土公司正在投资风力发电产业。
- 2023年9月,拜登政府宣布投资100亿美元,加强美国离岸风力发电供应链。这项投资预计将包括港口、航运和劳动力发展,可显着提振投资者信心。该倡议旨在加速向可再生能源的转变并增强经济。
- 例如,2024年3月,美国第一个商业规模的离岸风力发电在剑岛海岸开幕。该设施将由 16 台涡轮机组成,每台功率 8.2 兆瓦 (MW),总合可发电 130 兆瓦。这一里程碑标誌着美国离岸风力发电向前迈出了重要一步。
- 大西洋的三个主要离岸风力发电计划正在建设中。麻萨诸塞州的 Vineyard Wind 1 发电量为 800 兆瓦,足以为 40 万户家庭供电。 Revolution Wind 位于罗德岛州和麻萨诸塞州之间,发电量为 704 兆瓦,足以为 25 万户家庭供电。新泽西州海岸附近的 Ocean Wind 发电量为 110 万千瓦,将为 50 万户家庭供电。这些计划正在提高美国离岸风力发电容量。
- 2023年,美国风力发电量将达到429.5太瓦时,略低于2022年的438.7太瓦时。这意味着风力发电发电量比与前一年同期比较下降了2.1%。儘管出现下降,但 2018 年至 2023 年的总体趋势反映出显着增长,风力发电量在五年内增长了 56%。
- 因此,风力发电产业的此类发展预计将推动未来几年的市场成长。
美国风力发电市场
美国风力发电市场较为分散。主要参与企业包括 Acciona Energia SA、杜克能源公司、奥斯特公司、通用电气公司和西门子歌美飒可再生能源公司。
其他好处
- Excel 格式的市场预测 (ME) 表
- 3 个月分析师支持
目录
第一章简介
- 调查范围
- 市场定义
- 研究场所
第 2 章执行摘要
第三章调查方法
第四章市场概况
- 介绍
- 至2029年装置容量及预测(单位:GW)
- 美国可再生能源结构(2023)
- 最新趋势和发展
- 政府法规和措施
- 市场动态
- 促进因素
- 支持性法规和税收优惠鼓励风力发电投资
- 加大风电计划投资力度
- 抑制因素
- 替代可再生能源技术的竞争加剧
- 促进因素
- 供应链分析
- PESTLE分析
- 投资分析
第五章 市场区隔(按地区)
- 土地
- 海上
第六章 竞争状况
- 併购、合资、联盟、协议
- 主要企业策略
- 公司简介
- 风力发电厂营运商
- Acciona Energia SA
- Orsted AS
- Duke Energy Corporation
- NextEra Energy Inc.
- Trident Winds Inc.
- E.ON SE
- EDF SA
- EnBW Energie Baden-Wurttemberg AG
- 设备供应商
- Envision Energy
- General Electric Company
- Siemens Gamesa Renewable Energy
- Vestas Wind Systems AS
- 风力发电厂营运商
- 其他知名公司名单
- 市场排名分析
第七章 市场机会及未来趋势
- 拓展离岸业务
简介目录
Product Code: 48329
The United States Wind Energy Market size is estimated at 159.65 gigawatt in 2025, and is expected to reach 208.16 gigawatt by 2030, at a CAGR of 5.45% during the forecast period (2025-2030).
Key Highlights
- Over the medium term, factors such as government funding and federal incentives, including the Inflation Reduction Act (IRA), tax credits and subsidies, investments in wind energy projects, and decreasing cost of wind turbines are expected to drive the growth of the US wind energy market.
- On the other hand, competition from other renewable energy technologies is expected to hinder the market growth during the study period.
- The expansion of the wind energy industry in the offshore region is likely to create an opportunity for the market to grow in the coming years.
United States Wind Energy Market Trends
The Onshore Segment to Dominate the Market
- Onshore wind energy refers to electricity produced by wind turbines situated on land, harnessing the natural flow of air. It is one of the fastest-growing renewable energy technologies in the United States. Wind turbines do not release air or water pollutants, making them important for a future carbon-free energy industry.
- In the last five years, onshore wind energy technology has advanced to maximize electricity output per installed megawatt. Despite a drop in natural gas prices in 2023, wind energy continued to positively impact the grid, human health, and the environment by reducing emissions of nitrogen oxides and carbon dioxide.
- For instance, in 2023, onshore wind energy installations in the United States were around 150.43 GW, a 4.2% increase compared to the 144.3 GW of onshore wind energy installations in 2022. The increase in wind power is due to tax incentives from the Inflation Reduction Act, which makes wind energy more affordable. Additionally, decreasing wind energy costs and increasing investments in the supply chain boosted its growth.
- In July 2024, the 500 MW High Prairie Wind Farm in Missouri became operational, featuring 175 advanced wind turbines. This project is expected to generate enough electricity to power approximately 120,000 homes annually. It is part of Ameren Missouri's USD 4.5 billion investment plan to add 3,100 MW of clean energy capacity by 2030. The High Prairie Wind Farm is projected to significantly contribute to Missouri's goal of achieving net-zero carbon emissions by 2050.
- According to the Global Wind Energy Council, nearly 653 GW of onshore projects are likely to be commissioned between 2024 and 2028 in countries like China, the United States, and Europe.
- Therefore, onshore wind energy is expected to expand in the coming years with additional investments, technological advances, and economic growth.
Increasing Investments to Drive the Market
- Due to the increasing demand for electricity, the United States is promoting the growth of wind energy to meet power needs. Many multinational corporations and local firms are investing in the wind energy industry with the help of the governments of federal provinces in the United States.
- In September 2023, the Biden administration announced USD 10 billion to strengthen the US offshore wind energy supply chain. This investment is expected to involve developing ports, vessels, and workforce development, which may greatly increase investor confidence. This initiative aims to expedite the shift to renewable energy and fortify the economy.
- For instance, in March 2024, the first commercial-scale offshore wind power plant in the United States, situated off the coast of Thode Island, began delivering power. The facility comprises 16 turbines, each with a capacity of 8.2 megawatts (MW), which can produce 130 MW in total. The infrastructure for offshore wind energy in the United States has advanced significantly with this milestone.
- Three major offshore wind projects are under construction in the Atlantic. Vineyard Wind 1, of Massachusetts, will have an 800 MW capacity to power 400,000 homes. Revolution Wind, between Rhode Island and Massachusetts, will have a 704 MW capacity for 250,000 homes. Ocean Wind, off New Jersey, will have a 1.1 GW capacity to power 500,000 homes. These projects are boosting the US offshore wind energy capacity.
- In 2023, wind energy generation in the United States reached 429.5 TWh, a slight decrease compared to 438.7 TWh in 2022. This represents a 2.1% decline in electricity generation from wind energy sources year-over-year. Despite this reduction, the overall trend from 2018 to 2023 reflected significant growth, with wind energy generation increasing by 56% over the five-year period.
- Hence, such developments in the wind energy industry are expected to drive the growth of the market in the upcoming years.
United States Wind Energy Market New
The US wind energy market is fragmented. Some key players include Acciona Energia SA, Duke Energy Corporation, Oersted A/S, General Electric Company, and Siemens Gamesa Renewable Energy.
Additional Benefits:
- The market estimate (ME) sheet in Excel format
- 3 months of analyst support
TABLE OF CONTENTS
1 INTRODUCTION
- 1.1 Scope of the Study
- 1.2 Market Definition
- 1.3 Study Assumptions
2 EXECUTIVE SUMMARY
3 RESEARCH METHODOLOGY
4 MARKET OVERVIEW
- 4.1 Introduction
- 4.2 Installed Capacity and Forecast in GW, until 2029
- 4.3 United States Renewable Energy Mix, 2023
- 4.4 Recent Trends and Developments
- 4.5 Government Policies and Regulations
- 4.6 Market Dynamics
- 4.6.1 Drivers
- 4.6.1.1 Supportive Regulations and Tax Incentives Boost Wind Energy Investments
- 4.6.1.2 Increasing Investments in Wind Projects
- 4.6.2 Restraints
- 4.6.2.1 Increasing Competition from Alternate Renewable Energy Technologies
- 4.6.1 Drivers
- 4.7 Supply Chain Analysis
- 4.8 PESTLE Analysis
- 4.9 Investment Analysis
5 MARKET SEGMENTATION - BY LOCATION
- 5.1 Onshore
- 5.2 Offshore
6 COMPETITIVE LANDSCAPE
- 6.1 Mergers and Acquisitions, Joint Ventures, Collaborations, and Agreements
- 6.2 Strategies Adopted by Leading Players
- 6.3 Company Profiles
- 6.3.1 Wind Farm Operators
- 6.3.1.1 Acciona Energia SA
- 6.3.1.2 Orsted AS
- 6.3.1.3 Duke Energy Corporation
- 6.3.1.4 NextEra Energy Inc.
- 6.3.1.5 Trident Winds Inc.
- 6.3.1.6 E.ON SE
- 6.3.1.7 EDF SA
- 6.3.1.8 EnBW Energie Baden-Wurttemberg AG
- 6.3.2 Equipment Suppliers
- 6.3.2.1 Envision Energy
- 6.3.2.2 General Electric Company
- 6.3.2.3 Siemens Gamesa Renewable Energy
- 6.3.2.4 Vestas Wind Systems AS
- 6.3.1 Wind Farm Operators
- 6.4 List of Other Prominent Companies
- 6.5 Market Ranking Analysis
7 MARKET OPPORTUNITIES AND FUTURE TRENDS
- 7.1 Expansion in the Offshore Sector
02-2729-4219
+886-2-2729-4219
 风力发电市场基本面分析:依应用、涡轮机朝向、安装类型和所有权模式划分-2025-2032年全球预测
 风能救援系统市场-全球产业规模、份额、趋势、机会和预测(按应用程式、类型、最终用户、技术、地区和竞争细分,2020-2030 年)
 2025年风力发电设备物流全球市场报告全球风力发电市场报告(2025年)
 风电转换系统市场:2025-2030 年预测风能储存设备市场-全球产业规模、份额、趋势、机会及预测(按储存技术、应用、地区和竞争细分,2020-2030 年预测)
 印度风力发电:市场份额分析、行业趋势、统计数据和成长预测(2025-2030 年)
 2025-2029年全球风力发电市场
 2025-2029年全球风力发电电缆市场空中风能市场-全球产业规模、份额、趋势、机会和预测,按类型(陆上、海上)、按应用(再生能源发电、抽水、其他)、按地区和竞争细分,2020-2030 年预测
▼