


 |
市场调查报告书
商品编码
1645046
北美浮体式海上风电:市场占有率分析、行业趋势和统计、成长预测(2025-2030 年)North America Floating Offshore Wind Power - Market Share Analysis, Industry Trends & Statistics, Growth Forecasts (2025 - 2030) |
||||||
价格
※ 本网页内容可能与最新版本有所差异。详细情况请与我们联繫。
简介目录
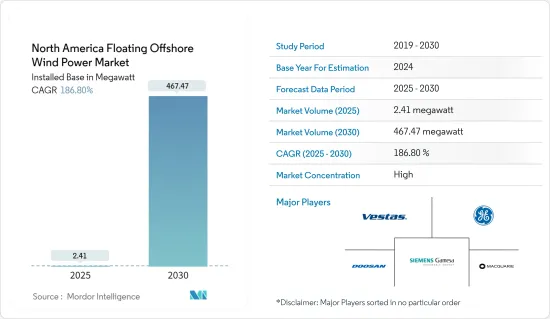
根据装置容量计算,北美浮体式海上风电市场规模预计将从 2025 年的 2.41 兆瓦成长到 2030 年的 467.47 兆瓦,预测期内(2025-2030 年)的复合年增长率为 186.8%。
主要亮点
- 从中期来看,预计预测期内对离岸风力发电的需求不断增长以及国际社会对减少二氧化碳排放的承诺将推动所研究市场的成长。
- 另一方面,预计在预测期内,清洁替代能源(主要是天然气和太阳能)的日益普及将阻碍浮体式海上风电的成长。
- 然而,浮体式海上风电的技术创新和最新技术的采用可能会在预测期内为浮体式海上风电市场带来机会。
- 美国占据市场主导地位,并可能在预测期内实现最高的复合年增长率。
北美浮体式海上风电市场趋势
深水作为关键领域
- 深水浮体式海上风电技术是最具经济可行性的技术。此外,美国离岸风力发电技术资源大部分位于水深超过60公尺的水域。
- 浮体式海上风电技术的设计目标是,一旦安装涡轮机,吃水相对较浅,并且具有流体动力动态。其他优点包括不受水深限制(大于 30 公尺)、安装适应各种天气条件、不受海床土壤条件限制、锚碇系统相对便宜且简单、安装和拆除简单、因波动板引起的移动最小、总体风险低。
- 浮体式深海风电发电工程比陆上风力发电厂有许多优势。海上风速很快且恆定,且附近没有陆地,因此干扰较少。
- 根据国际可再生能源机构的《2023年可再生能源容量》资料,到2022年,风电装置容量将达到1,520万千瓦,高于2021年的1,400万千瓦。
- 美国和加拿大都拥有大片沿海和深海区域,非常适合安装浮体式海上风电。 Sable Island Bank 位于加拿大大西洋地区新斯科细亚省,每年将能够生产高达 70,000 吉瓦时的电力,帮助加拿大实现 2050 年净零排放目标。
- 同样,离岸风电资源足够丰富,到2050年可以产生美国四分之一的电力。 2023年,美国在罗德岛和维吉尼亚沿岸建造了两座小型风电场。该国首个商业规模风电场将于 2023 年 6 月在马萨诸塞州玛莎葡萄园岛附近开幕。
- 因此,鑑于上述情况,预计深水领域将在预测期内占据市场主导地位。
预计美国将主导市场
- 由于旨在促进国内能源生产的「美国优先」政策,美国的风力发电产业享受到政府的大力支持。由于该国拥有大片沿海地区可供租赁,因此浮体式海上风电产业被视为重点发展领域。
- 美国是总设备容量第二大的国家,2022 年装置容量为 140.1 吉瓦,占北美总设备容量的 80% 以上。
- 根据能源研究所《2023年世界能源统计评论》的资料,风电发电量将达到 439.2兆瓦时,比 2021 年增加。
- 美国设定了约45,000兆瓦离岸风力发电的采购目标。此外,随着12个离岸风力发电计划的开发,预计2026年离岸风力发电约为10.3吉瓦。这些政府措施可能在预测期内促进浮体式海上风电市场的发展。
- 根据国际可再生能源机构2023年的可再生能源容量资料,2022年离岸风力发电容量将达42兆瓦。
- 因此,鑑于上述情况,预计预测期内美国浮体式海上风电市场将显着成长。
北美浮体式海上风电产业概况
北美浮体式海上风电市场相当分散。该市场的主要企业(不分先后顺序)包括维斯塔斯风力系统公司、通用电气公司、西门子歌美飒再生能源公司、斗山重工业和麦格理集团。
其他福利:
- Excel 格式的市场预测 (ME) 表
- 3 个月的分析师支持
目录
第 1 章 简介
- 研究范围
- 市场定义
- 调查前提
第 2 章执行摘要
第三章调查方法
第四章 市场概况
- 介绍
- 装置容量及 2028 年预测
- 最新趋势和发展
- 政府法规和政策
- 市场动态
- 驱动程式
- 采用无碳发电源
- 政府优惠政策
- 限制因素
- 来自替代可再生能源的激烈竞争
- 驱动程式
- 供应链分析
- 波特五力分析
- 供应商的议价能力
- 消费者议价能力
- 新进入者的威胁
- 替代品的威胁
- 竞争对手之间的竞争
第五章 市场区隔
- 依深度(仅定性分析)
- 浅水(深度小于30公尺)
- 过渡区(深度30米至60米)
- 深海(深度60公尺以上)
- 地区
- 美国
- 加拿大
- 墨西哥
第六章 竞争格局
- 合併、收购、合作及合资
- 主要企业策略
- 公司简介
- vestas wind systems a/s
- General Electric Company
- Siemens Gamesa Renewable Energy SA
- Doosan Heavy Industries & Construction
- Macquarie Group
- Equinor ASA
第七章 市场机会与未来趋势
- 超深离岸风电场变电站平台开发
简介目录
Product Code: 50001781
The North America Floating Offshore Wind Power Market size in terms of installed base is expected to grow from 2.41 megawatt in 2025 to 467.47 megawatt by 2030, at a CAGR of 186.8% during the forecast period (2025-2030).
Key Highlights
- Over the medium term, the growing demand for offshore wind power coupled with international commitments to reduce carbon emissions are expected to drive the growth of the market studied during the forecast period.
- On the other hand, increasing adoption of alternate sources of clean power generation, mainly gas and solar power, are expected to hinder the growth of Floating Offshore wind power during the forecast period.
- Nevertheless, technological innovation and adaptation of the latest technologies in Floating Offshore wind power are likely to create opportunities for the Floating Offshore wind power market in the forecast period.
- The United States dominates the market and is also likely to witness the highest CAGR during the forecast period.
North America Floating Offshore Wind Power Market Trends
Deep Water as a Significant Segment
- Deepwater floating offshore wind power technology is the most economically viable technology because, at these depths, the cost of deployment of fixed-base structures is prohibitively high. Additionally, most of the total technical offshore wind resources in the United States lie over water depths greater than 60 m.
- Floating offshore wind power technology design is a relatively shallow draft and hydrodynamic stability after wind turbine installation. Other benefits include depth independence (above 30 meters), broad weather window for installation, insensitivity to subsea soil conditions, relatively cheap and simple mooring systems, simple installation and decommissioning, minimal level of movement due to heave plates, and overall lower risk.
- Floating deepwater offshore wind power projects offer more advantages than onshore wind farms. The wind speeds are higher and constant in the offshore regions, and the areas offer fewer hindrances due to no ground nearby in the vicinity.
- According to the International Renewable Energy Agency Renewable Energy Capacity 2023 data, the installed wind power capacity reached 15.2 GW in 2022, increasing from 14 GW in 2021.
- Both the United States and Canada offer significant coastal and deepwater offshore areas, thus providing excellent floating offshore wind power capacities. The Sable Island Bank in Nova Scotia, Atlantic Canada, could churn up to 70,000 Gigawatt-hours of electricity in a year, thus helping Canada reach its goal of net zero in 2050.
- Similarly, offshore wind resources are plentiful enough to generate up to a quarter of the United States' electricity by 2050, thus helping the country meet its global climate goals. In 2023, the United States had two small wind farms off the Rhode Island and Virginia coasts. The country's first commercial-scale wind farm off Martha's Vineyard was constructed on the foundations, Massachusetts, in June 2023.
- Hence, due to the above points, the deep water segment will dominate the market during the forecast period.
United States Expected to Dominate the Market
- The wind power sector in the United States is receiving immense support from the government due to the America First policy, which aims to boost domestic energy production. The floating offshore wind power sector is considered a major development area, as the country has a large coastal area available for leasing.
- The United States was the second-largest country in terms of total installed wind energy capacity, recording 140.1 GW of capacity in 2022, or more than 80% of the total wind energy capacity in North America.
- According to the Energy Institute Statistical Review of World Energy 2023 data, the electricity generation from wind power reached 439.2 terawatt-hours, increasing from 2021.
- The United States has established nearly 45,000 MW of offshore wind procurement targets. Additionally, around 10.3 GW of offshore wind energy is expected by 2026, with the development of 12 offshore wind energy projects. Such government initiatives are likely to increase the floating offshore wind power market during the forecast period.
- According to the International Renewable Energy Agency Renewable Energy Capacity 2023 data, the offshore wind power capacity reached 42 MW in 2022.
- Hence, owing to the above points, the United States is expected to see significant growth in the Offshore Floating wind power market during the forecast period.
North America Floating Offshore Wind Power Industry Overview
The North American Offshore Floating wind power market is moderately fragmented. Some of the key players in this market (in no particular order) include Vestas Wind Systems AS, General Electric Company, Siemens Gamesa Renewable Energy SA, Doosan Heavy Industries & Construction, and Macquarie Group.
Additional Benefits:
- The market estimate (ME) sheet in Excel format
- 3 months of analyst support
TABLE OF CONTENTS
1 INTRODUCTION
- 1.1 Scope of the Study
- 1.2 Market Definition
- 1.3 Study Assumptions
2 EXECUTIVE SUMMARY
3 RESEARCH METHODOLOGY
4 MARKET OVERVIEW
- 4.1 Introduction
- 4.2 Installed Capacity and Forecast, till 2028
- 4.3 Recent Trends and Developments
- 4.4 Government Policies and Regulations
- 4.5 Market Dynamics
- 4.5.1 Drivers
- 4.5.1.1 Adoption of Carbon Free Electricity Generation Sources
- 4.5.1.2 Favorable Government Policies
- 4.5.2 Restraints
- 4.5.2.1 Tough Competition from Alternative renewable energy sources
- 4.5.1 Drivers
- 4.6 Supply Chain Analysis
- 4.7 Porter's Five Force Analysis
- 4.7.1 Bargaining Power of Suppliers
- 4.7.2 Bargaining Power of Consumers
- 4.7.3 Threat of New Entrants
- 4.7.4 Threat of Substitutes Products and Services
- 4.7.5 Intensity of Competitive Rivalry
5 MARKET SEGMENTATION
- 5.1 By Water Depth (Qualitative Analysis Only)
- 5.1.1 Shallow Water ( less than 30 m Depth)
- 5.1.2 Transitional Water (30 m to 60 m Depth)
- 5.1.3 Deep Water (higher than 60 m Depth)
- 5.2 Geography
- 5.2.1 United States
- 5.2.2 Canada
- 5.2.3 Mexico
6 COMPETITIVE LANDSCAPE
- 6.1 Mergers, Acquisitions, Collaboration and Joint Ventures
- 6.2 Strategies Adopted by Key Players
- 6.3 Company Profiles
- 6.3.1 vestas wind systems a/s
- 6.3.2 General Electric Company
- 6.3.3 Siemens Gamesa Renewable Energy SA
- 6.3.4 Doosan Heavy Industries & Construction
- 6.3.5 Macquarie Group
- 6.3.6 Equinor ASA
7 MARKET OPPORTUNITIES AND FUTURE TRENDS
- 7.1 Developing Ultradeep water Offshore Wind farm Substation Platform
02-2729-4219
+886-2-2729-4219
 2026年全球浮体式海上电市场报告2026年全球浮体式海上风力发电市场报告
 浮体式海上风电市场-2026-2031年预测
 全球浮体式海上风电系统市场:预测至2032年-按组件、平台类型、风扇容量、水深、轴线、应用、最终用户及地区进行分析
 海上漂浮式风电:全球市场份额和排名、总收入和需求预测(2025-2031年)
 全球浮体式海上风力发电市场
 浮体式海上风电:市场份额分析、行业趋势、统计数据和成长预测(2025-2030 年)
 浮动离岸风电市场-全球产业规模、份额、趋势、机会和预测,按水深(浅水、过渡水域和深水)、按涡轮机容量、按地区、按竞争细分,2020-2030 年
 浮动离岸风能市场机会、成长动力、产业趋势分析及2025-2034年预测亚太地区浮体式海上风电:市场占有率分析、产业趋势与成长预测(2025-2030)
▼