


 |
市场调查报告书
商品编码
1645105
碳计量:市场占有率分析、行业趋势和统计、成长预测(2025-2030 年)Carbon Accounting - Market Share Analysis, Industry Trends & Statistics, Growth Forecasts (2025 - 2030) |
||||||
价格
※ 本网页内容可能与最新版本有所差异。详细情况请与我们联繫。
简介目录
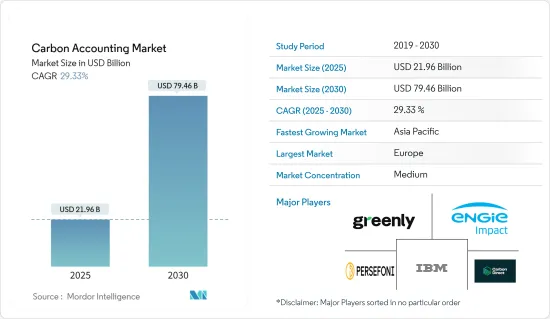
2025年碳计量市场规模预估为219.6亿美元,预计2030年将达794.6亿美元,预测期间(2025-2030年)复合年增长率为29.33%。
关键亮点
- 从中期来看,企业对实现永续性目标的日益关注以及碳排放测量和控制的严格法规和合规性等因素预计将成为预测期内碳计量市场最重要的驱动因素。
- 另一方面,预计在预测期内,准确计算和实施碳计量方法的资料收集的复杂性将对市场构成威胁。
- 然而,在开发更具创新性和效率的碳计量方法和软体方面,我们仍在不断取得进展。预计这一因素将在未来几年为市场创造许多机会。
- 亚太地区占据市场主导地位,并可能在预测期内实现最高的复合年增长率。中国、印度、日本和其他国家由于其工业和基础设施发展活动的不断增加而推动市场的发展。
碳计量市场趋势
电力业务部门实现大幅成长
- 电力产业是碳计量最重要的产业之一,因为它是温室气体排放的重要来源。这些产业严重依赖石油、煤炭和天然气等石化燃料发电。这些排放排放了大量的温室气体,因此这些公司必须进行碳计量,以遵守监管和合规要求,并向投资者和相关人员提供资讯。
- 开发商将进行广泛的碳计量,以识别高排放源,并制定策略和政策来应对增加和减少排放。这些策略和政策包括投资再生能源来源、提高效率、实施碳捕获技术和采用更清洁的石化燃料技术。碳计量评估发电设施、输配电系统和基础设施等复杂营运组成部分的碳足迹,从而确定工作优先顺序并优化资源。
- 国际可再生能源机构表示,全球减少碳排放、采用更清洁能源来源的迫切需要,正推动主要企业大力投资开发可再生能源发电计划,大幅增加可再生能源装置容量。 2023年全球可再生能源装置容量约为3,869.7 GW,而2022年为3,396.32 GW,成长率约14%。
- 此外,碳计量为公用事业提供了重要资料,以评估和减轻气候变迁的风险,包括潜在的供应中断、基础设施损坏和消费者需求变化。这将为低碳未来的长期、有弹性的规划和可持续的投资决策提供资讯。
- 例如,2024年3月,领先的可再生能源计划开发商和营运商GE Vernova宣布将在Globeleq位于象牙海岸共和国的Azito Energie SA发电厂部署碳计量软体。该电厂是该国最大的天然气发电厂。 GE Vernova希望该软体能为其提供必要的碳排放信息,并确定资讯来源,以开发更有效率的流程和设备。
- 因此,如上所述,预计发电业务部门在预测期内将呈现显着的成长率。
亚太地区占市场主导地位
- 预计未来几年亚太地区将主导全球碳计量市场。受快速工业化、人口成长和应对气候变迁日益紧迫的影响,该地区主要依靠石化燃料来满足其能源需求。中国、印度、日本和东南亚国家等製造业中心和新兴经济体是全球温室气体排放的主要贡献者。然而,这些国家正积极追求永续发展目标并采取措施抑制碳排放。
- 亚太地区不断增长的工业活动和能源需求推动了对强有力的碳计量实践的需求,以准确测量、报告并最终减少排放。在该地区运营的跨国公司面临日益严格的环境法规和报告要求,推动了先进碳计量系统的采用。此外,该地区非常重视发展太阳能和风能等可再生能源,迫切需要进行全面的碳生命週期分析来量化排放。
- 2023年11月,中国政府宣布打算取消对外商投资製造业的限制,显示中国持续致力于欢迎外商投资企业。预计这项进步措施将促进中国製造业的成长,影响整个製造业,并在预测期内推动碳计量市场的发展。
- 此外,亚太市场在新干净科技、基础设施升级以及一系列其他清洁能源解决方案产品和计划正在经历重大发展和投资。这需要采用碳计量方法来追踪和减少碳排放并识别资源效率低下。这就是为什么我们正在与各种国际公司合作并开发更准确的碳计量方法。亚太地区消费者和相关人员的环保意识不断增强,进一步推动了企业对透明碳报告的需求。
- 电池、汽车、仪器设备等製造业的规模化发展,为国际市场参与企业发展面向各行业的碳计量服务供应商、软体开发商和咨询公司创造了巨大的机会。
- 因此,预计亚太地区将在预测期内占据主导地位。
碳计量产业概况
全球碳计量市场是半静态的。该市场的主要企业(不分先后顺序)包括 Greenly、国际商业机器公司、ENGIE Impact、Persefoni AI 和 Carbon Direct。
其他福利
- Excel 格式的市场预测 (ME) 表
- 3 个月的分析师支持
目录
第 1 章 简介
- 研究范围
- 市场定义
- 调查前提
第 2 章执行摘要
第三章调查方法
第四章 市场概况
- 介绍
- 至2029年的市场规模及需求预测(单位:美元)
- 最新趋势和发展
- 政府法规和政策
- 市场动态
- 驱动程式
- 企业永续性目标
- 严格监理与合规
- 限制因素
- 碳计量的复杂性
- 驱动程式
- 供应链分析
- 产业吸引力-波特五力分析
- 供应商的议价能力
- 消费者议价能力
- 新进入者的威胁
- 替代品的威胁产品/服务
- 竞争对手之间的竞争
第五章 市场区隔
- 市场类型
- 云端基础
- 本地
- 最终用户
- 石油和天然气
- 电力业务
- 建筑基础设施
- 通讯
- 饮食
- 其他的
- 2029 年市场规模与需求预测(按地区)
- 北美洲
- 美国
- 加拿大
- 北美其他地区
- 欧洲
- 德国
- 法国
- 英国
- 义大利
- 西班牙
- 北欧的
- 俄罗斯
- 土耳其
- 欧洲其他地区
- 亚太地区
- 中国
- 印度
- 澳洲
- 日本
- 韩国
- 马来西亚
- 泰国
- 印尼
- 越南
- 其他亚太地区
- 中东和非洲
- 沙乌地阿拉伯
- 阿拉伯聯合大公国
- 奈及利亚
- 埃及
- 卡达
- 南非
- 其他中东和非洲地区
- 南美洲
- 巴西
- 阿根廷
- 哥伦比亚
- 南美洲其他地区
- 北美洲
第六章 竞争格局
- 併购、合资、合作与协议
- 主要企业策略
- 公司简介
- Greenly
- International Business Machines Corporation
- ENGIE Impact
- Persefoni AI
- Normative
- Carbon Direct
- Sphera
- Emitwise
- SINAI Technologies
- Diligent Corporation
- 市场排名/份额分析
第七章 市场机会与未来趋势
- 开发创新的碳计量解决方案
简介目录
Product Code: 50002216
The Carbon Accounting Market size is estimated at USD 21.96 billion in 2025, and is expected to reach USD 79.46 billion by 2030, at a CAGR of 29.33% during the forecast period (2025-2030).
Key Highlights
- Over the medium term, factors such as growing corporate focus on achieving their sustainability goals and increasing stringent regulations and compliances over carbon emission measuring and regulations are expected to be among the most significant drivers for the carbon accounting market during the forecast period.
- On the other hand, the complexity of accumulating data and implementing carbon accounting methodology for accurate calculation is high, which is expected to pose a threat to the market during the forecast period.
- However, continued advancements in developing more innovative and efficient carbon accounting methodologies and software are ongoing. This factor is expected to create several opportunities for the market in the future.
- Asia-Pacific dominates the market and will likely register the highest CAGR during the forecast period. China, India, Japan, and others drive it due to the growing number of industries and infrastructural development activities in these countries.
Carbon Accounting Market Trends
The Power Utilities Segment to Witness Significant Growth
- The power utilities end-user segment is one of the most essential industries for carbon accounting as these segments are significant contributors to greenhouse gas emissions. These industries heavily rely on fossil fuels such as oil, coal, and natural gas for power generation. These sources are heavy emitters of greenhouse gases, which makes carbon accounting necessary for these companies to comply with the regulations and compliance requirements, along with informing investors and stakeholders.
- Utilities will identify the highest emitting sources by conducting extensive carbon accounting practices and developing strategies and policies to counter the growth and reduce emissions. These strategies and policies can include investing in renewable energy sources, improving efficiency, implementing carbon capture technologies, or adopting cleaner fossil fuel technology. Carbon accounting allows for assessing the carbon footprint across complex operational components like generation facilities, transmission/distribution systems, and supporting infrastructure, prioritizing efforts and optimizing resources.
- According to the International Renewable Energy Agency, the global imperative of reducing carbon emissions and adopting cleaner energy sources has led significant power utility companies to invest heavily in developing renewable energy power projects, significantly increasing the renewable energy installed capacity. In 2023, the global renewable energy installed capacity was around 3869.7 GW compared to 3396.32 GW in 2022, registering a growth rate of approximately 14%.
- Moreover, carbon accounting provides power utilities with crucial data to assess and mitigate risks posed by climate change, such as potential supply disruptions, infrastructure damage, and shifting consumer demands. This informs long-term resilient planning and sustainable investment decisions for a low-carbon future.
- For instance, in March 2024, GE Vernova, a primary renewable energy project developer and operator, announced that it would deploy carbon accounting software in Globeleq's Azito Energie S.A. power plant in Cote D'Ivoire. This is the largest natural gas power plant in the country. GE Vernova expects the software to provide necessary information on carbon emissions and identify sources to develop more efficient processes and equipment.
- Therefore, as mentioned above, the power utilities segment is expected to witness a significant growth rate during the forecast period.
Asia-Pacific to Dominate the Market
- Asia-Pacific will dominate the global carbon accounting market in the coming years. It is driven by rapid industrialization, population growth, and the increasing urgency to address climate change, as the region predominantly relies on fossil fuels to meet its energy demands. As manufacturing hubs and developing economies, countries like China, India, Japan, and Southeast Asian nations are major contributors to global greenhouse gas emissions. However, they are also actively pursuing sustainable development goals and implementing policies to curb their carbon footprints.
- The growing intensity of industrial activities and energy demands across Asia-Pacific drives the demand for robust carbon accounting practices to accurately measure, report, and ultimately reduce emissions. Multinational corporations operating in the region face stricter environmental regulations and reporting requirements, driving the adoption of sophisticated carbon accounting systems. Additionally, the region's focus on renewable energy development, such as solar and wind power, creates a pressing need for comprehensive carbon lifecycle analysis to quantify emissions savings.
- In November 2023, the Chinese government declared its intention to eliminate all restrictions on foreign involvement in manufacturing, showcasing the nation's ongoing commitment to embracing foreign enterprises. This progressive step is anticipated to foster growth in the Chinese manufacturing sector, subsequently influencing the overall manufacturing landscape and propelling the carbon accounting market forward during the forecast period.
- Moreover, the Asia-Pacific market has witnessed significant developments and investments in new clean technologies, infrastructure upgrades, and various other clean energy solution products and projects. This necessitates adopting carbon accounting methods to track and reduce carbon emissions and identify inefficient resources. This has led to collaboration with various international players and the development of more precise carbon accounting methodologies. The rising environmental consciousness among consumers and stakeholders in Asia-Pacific further fuels companies' demand for transparent carbon reporting.
- The large-scale development of manufacturing industries, such as batteries, automobiles, instruments, and equipment, presents enormous opportunities for international market players to explore carbon accounting service providers, software developers, and consulting firms catering to diverse industries.
- Thus, the Asia-Pacific region is expected to dominate the market segment during the forecast period.
Carbon Accounting Industry Overview
The global carbon accounting market is semi-consolidated. Some key players in this market (in no particular order) include Greenly, International Business Machines Corporation, ENGIE Impact, Persefoni AI, and Carbon Direct.
Additional Benefits:
- The market estimate (ME) sheet in Excel format
- 3 months of analyst support
TABLE OF CONTENTS
1 INTRODUCTION
- 1.1 Scope of the Study
- 1.2 Market Definition
- 1.3 Study Assumptions
2 EXECUTIVE SUMMARY
3 RESEARCH METHODOLOGY
4 MARKET OVERVIEW
- 4.1 Introduction
- 4.2 Market Size and Demand Forecast in USD, till 2029
- 4.3 Recent Trends and Developments
- 4.4 Government Policies and Regulations
- 4.5 Market Dynamics
- 4.5.1 Drivers
- 4.5.1.1 Corporate Sustainability Goals
- 4.5.1.2 Stringent Regultions and Compliance
- 4.5.2 Restraints
- 4.5.2.1 High Complexity in Carbon Accounting
- 4.5.1 Drivers
- 4.6 Supply Chain Analysis
- 4.7 Industry Attractiveness - Porter's Five Forces Analysis
- 4.7.1 Bargaining Power of Suppliers
- 4.7.2 Bargaining Power of Consumers
- 4.7.3 Threat of New Entrants
- 4.7.4 Threat of Substitutes Products and Services
- 4.7.5 Intensity of Competitive Rivalry
5 MARKET SEGMENTATION
- 5.1 Type
- 5.1.1 Cloud Based
- 5.1.2 On Premise
- 5.2 End Users
- 5.2.1 Oil and Gas
- 5.2.2 Power Utilities
- 5.2.3 Construction and Infrastructure
- 5.2.4 Telecommunication
- 5.2.5 Food and Beverages
- 5.2.6 Other End Users
- 5.3 Geography [Market Size and Demand Forecast till 2029 (for Regions Only)]
- 5.3.1 North America
- 5.3.1.1 United States
- 5.3.1.2 Canada
- 5.3.1.3 Rest of North America
- 5.3.2 Europe
- 5.3.2.1 Germany
- 5.3.2.2 France
- 5.3.2.3 United Kingdom
- 5.3.2.4 Italy
- 5.3.2.5 Spain
- 5.3.2.6 NORDIC
- 5.3.2.7 Russia
- 5.3.2.8 Turkey
- 5.3.2.9 Rest of Europe
- 5.3.3 Asia-Pacific
- 5.3.3.1 China
- 5.3.3.2 India
- 5.3.3.3 Australia
- 5.3.3.4 Japan
- 5.3.3.5 South Korea
- 5.3.3.6 Malaysia
- 5.3.3.7 Thailand
- 5.3.3.8 Indonesia
- 5.3.3.9 Vietnam
- 5.3.3.10 Rest of Asia-Pacific
- 5.3.4 Middle East and Africa
- 5.3.4.1 Saudi Arabia
- 5.3.4.2 United Arab Emirates
- 5.3.4.3 Nigeria
- 5.3.4.4 Egypt
- 5.3.4.5 Qatar
- 5.3.4.6 South Africa
- 5.3.4.7 Rest of Middle East and Africa
- 5.3.5 South America
- 5.3.5.1 Brazil
- 5.3.5.2 Argentina
- 5.3.5.3 Colombia
- 5.3.5.4 Rest of South America
- 5.3.1 North America
6 COMPETITIVE LANDSCAPE
- 6.1 Mergers and Acquisitions, Joint Ventures, Collaborations, and Agreements
- 6.2 Strategies Adopted by Leading Players
- 6.3 Company Profiles
- 6.3.1 Greenly
- 6.3.2 International Business Machines Corporation
- 6.3.3 ENGIE Impact
- 6.3.4 Persefoni AI
- 6.3.5 Normative
- 6.3.6 Carbon Direct
- 6.3.7 Sphera
- 6.3.8 Emitwise
- 6.3.9 SINAI Technologies
- 6.3.10 Diligent Corporation
- 6.4 Market Ranking/Share Analysis
7 MARKET OPPORTUNITIES AND FUTURE TRENDS
- 7.1 Development of Innovative Carbon Accounting Solutions
02-2729-4219
+886-2-2729-4219
 脱碳软体市场:按类型、可近性、技术、部署模式、企业规模和最终用户产业划分-2026-2032年全球预测
 2026年全球云碳管理系统市场报告碳管理软体市场:按组件、应用、部署类型、最终用户产业、组织类型和企业规模划分-2026-2032年全球预测2026年智慧碳全球市场报告2026年全球碳管理系统市场报告
 智慧碳足迹分析市场分析及预测(至2035年):依类型、产品类型、服务、技术、组件、应用、最终用户、模组、功能划分酵素催化二氧化碳还原市场分析及预测(至2035年):依类型、产品、服务、技术、应用、材料类型、製程、最终用户、功能及设备划分
 2026-2034年全球能源和公共产业碳管理系统市场规模、份额、趋势和成长分析报告
 碳管理软体市场规模、份额、趋势及预测(按组件、应用、垂直产业及地区划分),2026-2034年全球製造业废弃物管理市场:市场规模、占有率、成长率、产业分析、依类型、应用和地区划分的分析及预测(2026-2034 年)
▼