


 |
市场调查报告书
商品编码
1645129
美国软性饮料包装:市场占有率分析、行业趋势和统计、成长预测(2025-2030 年)US Soft Drinks Packaging - Market Share Analysis, Industry Trends & Statistics, Growth Forecasts (2025 - 2030) |
||||||
价格
※ 本网页内容可能与最新版本有所差异。详细情况请与我们联繫。
简介目录
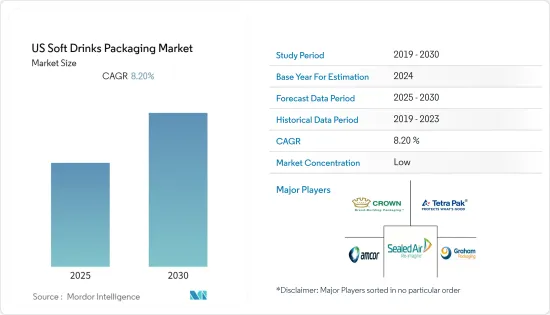
预计预测期内美国软性饮料包装市场复合年增长率为 8.20%。
主要亮点
- 在消费者对更健康生活方式的追求的推动下,瓶装水将取代碳酸饮料,成为美国消费者的首选包装饮料。由于健康饮料的趋势威胁到碳酸软性饮料的成长,因此,透过包装激励措施找到新的创新方法来提高消费者的购买意愿对于包装製造商和品牌所有者来说至关重要。然而,成本可能是使新包装成为现实的一个重要因素。
- 宝特瓶水产业的每个领域都在成长,宝特瓶水被认为是美国最成功的大众市场饮料类别。
- 此外,在纽约、波士顿、洛杉矶、旧金山、拉斯维加斯、休士顿、迈阿密和华盛顿特区等 17 个主要城市,瓶装水的销量超过了零售软性饮料。预计会有更多城市加入这项名单。
- 大多数碳酸饮料都装在铝罐或宝特瓶出售。它也在食品服务业的汽水供应机大量销售。只有一小部分的碳酸饮料是装在玻璃瓶中。由于消费者偏好和生活方式的变化,这些产品的包装尺寸通常较小,而且与大容量的宝特瓶和铝罐相比,运输沉重、小容量的玻璃容器会导致成本增加。
- 此外,软性饮料是继水之后消费量第二大的饮料,而软性饮料最常用的包装材料是塑胶。许多饮料製造商倾向于使用塑胶包装来包装瓶装饮料,因为它重量轻、耐用且具有成本效益。
- 此外,碳酸饮料通常装在铝罐中。新冠疫情在疫情初期就影响了这些罐头的供应,凸显了它们的限制。这种罐装短缺促使汽水製造商寻找新的包装,尤其是任何可以延长保质期的无菌包装。
美国软性饮料包装市场趋势
塑胶有望占据主要市场占有率
- 与替代材料相比,塑胶生产更节能、更轻,使其成为比其他替代材料更有效的软性饮料包装材料。例如,仅 2 磅塑胶就可以提供 10 加仑液体,即牛奶,而需要 3 磅铝、8 磅钢和超过 40 磅玻璃才能提供相同量的液体。
- 由于需求增加,即饮冰茶正在经历强劲成长。市面上的商贩提供专门用于即饮茶的再生包装。例如,Graham Packaging 提供可回收塑胶包装以延长其单份包装的保质期。
- 此外,由于上班族生活繁忙,各品牌都推出了单份塑胶小袋装产品。因此,即饮饮料变得越来越重要,进一步推动了市场的成长。
- HDPE是应用最广泛的塑胶包装材料。它用于製造多种类型的瓶子和容器。无色瓶子半透明、阻隔性,非常适合包装果汁和能量饮料等保质期较短的产品。
- 随着软性饮料市场的扩大,人们对果汁、能量饮料、运动饮料等营养产品的需求日益增加,这显然直接推动了软性饮料包装市场的发展。塑料也非常耐用且易于携带。此外,塑胶是密封的,因此不太可能发生洩漏或变质。
碳酸饮料占最大市场占有率
- 碳酸饮料市场是全球成熟的产业之一。过去几年来,该行业的产品创新和交付发生了重大变化。为了应对日益严峻的市场挑战,各公司在提供新口味的同时,也考虑到消费者对健康和保健的关注。
- 在美国,碳酸饮料是仅次于水的第二大消费量饮料,而塑胶是软性饮料包装最常用的材料。人口成长和可支配收入增加推动了碳酸饮料产品的需求。
- 大多数碳酸饮料都装在铝罐和宝特瓶出售。它也在食品服务业的汽水供应机大量销售。只有一小部分的碳酸饮料是装在玻璃瓶中。这是因为,随着消费者的偏好和生活方式变化,与容积率较高的宝特瓶和铝罐相比,重量较重且容积较小的玻璃容器的运输成本有所增加。
- 此外,可乐软性饮料是2020年美国最受欢迎的碳酸饮料。销售额突破130亿美国。柑橘类碳酸饮料则位居第二,销售额约46亿美元。
- 此外,高效能的包装解决方案易于使用、易于处理并能改善使用者体验。这些优势导致了软性饮料领域对包装解决方案的需求。推动需求的另一个趋势是新颖和创新的产品,帮助製造商区分他们的产品同时提高品牌知名度。
美国软性饮料包装产业概况
美国软性饮料包装市场高度分散,拥有许多国内和国际参与者。市场较为分散,参与者在价格、产品设计、产品创新等方面竞争。市场的主要企业包括 Amcor Ltd、Sealed Air Corporation、Tetra Pak International、Graham Packaging Company 和 Crown Holdings Incorporated。
- 2021 年 7 月-希悦尔已承诺投入超过 3,000 万美元的资金来扩大其全球生产能力并投资新的设备系统,以满足对其自动包装系统品牌解决方案日益增长的需求。这项投资主要用于扩大俄亥俄州斯特里茨伯勒和贝德福德高地以及西维吉尼亚凯泽的产能,以及「非接触式」自动化和专有数位印刷技术,预计将于 2021 年完成。
- 2021 年 2 月-利乐推出经过认证的再生聚合物,成为食品和饮料包装行业第一家获得永续生物材料圆桌会议 (RSB) 高级产品认证的公司。目前,采用可回收聚合物製成的纸箱包装正在出售给食品和饮料製造商。
其他福利:
- Excel 格式的市场预测 (ME) 表
- 3 个月的分析师支持
目录
第 1 章 简介
- 研究假设和市场定义
- 研究范围
第二章调查方法
第三章执行摘要
第四章 市场洞察
- 市场概况
- 产业价值链分析
- 产业吸引力-波特五力分析
- 供应商的议价能力
- 买家的议价能力
- 新进入者的威胁
- 替代品的威胁
- 竞争对手之间的竞争强度
- COVID-19 市场影响评估
第五章 市场动态
- 市场驱动因素
- 即饮饮料需求不断成长
- 消费者对便利包装的需求不断增加
- 市场限制
- 与塑胶使用相关的环境问题
- 严格的政府法规
第六章 市场细分
- 依包装材料类型
- 塑胶
- 纸和纸板
- 玻璃
- 金属
- 其他材料
- 依产品类型
- 瓶装水
- 碳酸饮料
- 汁
- 即饮饮料
- 运动饮料
- 其他产品
第七章 竞争格局
- 公司简介
- Crown Holdings Inc.
- Amcor Ltd.
- Tetra Pak International
- Sealed Air Corporation
- Graham Packaging Company
- Ball Corporation
- Placon Corporation
- Toyo Seikan Group Holdings Ltd
- WestRock Company
- Owens-Illinois Inc.
- Refresco Group NV
- Ardagh Group SA
- CAN-PACK SA
第八章投资分析
第九章:未来市场展望
简介目录
Product Code: 54340
The US Soft Drinks Packaging Market is expected to register a CAGR of 8.20% during the forecast period.
Key Highlights
- Driven by consumer desire for a healthier lifestyle, bottled water will overtake carbonated soft drinks as the leading packaged beverage of choice among U.S. consumers. With trends toward healthier beverages threatening the growth of carbonated soft drinks, finding new and innovative ways to get consumers to buy through packaging stimuli will be crucial for packaging manufacturers and brand owners. However, the cost will still be the key ingredient to any new packaging feasibility.
- Every segment of the bottled water industry is growing, and bottled water is considered the most successful mass-market beverage category in the U.S. Single-serve PET plastic bottled water outperformed all other beverage categories, posting another significant rise.
- Further, bottled water outsells retail soft drinks in 17 major cities, including New York, Boston, Los Angeles, San Francisco, Las Vegas, Houston, Miami, and Washington D.C. Overall, soft drink consumption declines. More cities are projected will join the list.
- The majority of carbonated soft drinks are sold in aluminum cans and PET bottles. They are also sold in bulk in the foodservice industry through soda fountains. Only a tiny portion of CSDs are still packaged in glass bottles. These are usually packaged in smaller sizes due to changing consumer preferences and lifestyles and increased costs associated with transporting heavy, low-volume glass containers versus high volume-to-packaging ratio PET bottles and aluminum cans.
- Moreover, soft drinks are the second most-consumed drink after water, with plastic being the most used material for soft drinks packaging. Many beverage companies favor plastic packaging material for bottled beverages due to its lightweight, durability, and cost-efficiency.
- Further, carbonated soft drinks are usually packaged in aluminum cans. The COVID-19 pandemic impacted the supply of these cans in the early months of the pandemic, which highlighted the limitations of these cans. The can shortage made carbonated beverage producers look for new packages, specifically all forms of aseptic, enabling a long ambient shelf life.
US Soft Drinks Packaging Market Trends
Plastic is Expected to Hold Significant Market Share
- Plastics are a more efficient material for soft drinks packaging than other alternatives because plastics are energy efficient to manufacture and lighter than alternative materials. For instance, just two pounds of plastic can deliver 10 gallons of Liquid, i.e., milk, whereas three pounds of aluminum, eight pounds of steel, or over 40 pounds of glass are needed to deliver the same amount of Liquid.
- Ready-to-drink iced tea has grown considerably due to the increasing demand. Market vendors are offering specialized recycle packaging for ready-to-drink tea. For instance, Graham Packaging offers recyclable plastic packaging to provide longer shelf life for single-serve packaging.
- Also, the busy life of working people has led to the launch of single-serve plastic sachets by various brands. Thus, this increases the importance of ready-to-consume drinks and further boosts market growth.
- HDPE is the most widely used type of plastic packaging material. It is used to make many types of bottles and containers. Unpigmented bottles are translucent and sturdy, have good barrier properties, and are well suited for packaging products with a shorter shelf life, such as Juices and Energy Drinks.
- With the expanding soft drinks market, it is evident that nutritional product demand, such as Juices, Energy drinks, sports drinks, is increasing, directly driving the soft drinks packaging market. It is also durable, and people can carry them without hassle. Moreover, plastics are airtight, so leakage and getting stale is unlikely.
Carbonated Beverages to hold the Largest Market Share
- The carbonated beverages market is one of the matured industries across the globe. The segment has undergone significant changes in product innovations and offerings in the last few years. To face the growing market challenges, companies are bringing new flavors keeping in mind consumers' health and wellness concerns.
- In the United States, carbonated drinks are the second most-consumed drink after water, with plastic being the most used material for soft drinks packaging. The increasing population and rising disposable income have led to the increasing demand for carbonated soft drinks products.
- The majority of carbonated soft drinks are sold in aluminum cans and PET bottles. They are also sold in bulk in the foodservice industry through soda fountains. Only a tiny portion of CSDs are still packaged in glass bottles. These are usually packaged in smaller sizes due to changing consumer preferences and lifestyles and increased costs associated with transporting heavy, low-volume glass containers versus high volume-to-packaging ratio PET bottles and aluminum cans.
- Moreover, Cola style soft drinks were the most popular carbonated beverage in the United States in 2020. The sales reached over 13 billion U.S. dollars. Citrus carbonated soft drink varieties ranked second, with sales amounting to around 4.6 billion U.S. dollars.
- Further, efficient packaging solutions offer ease of use, disposability, and enhanced user experience. These benefits have led to the demand for packaging solutions for the soft drinks segment. The other trend augmenting the demand is the new and innovative products, which helps manufacturers enhance their brand visibility while offering product differentiation.
US Soft Drinks Packaging Industry Overview
The US Soft Drinks Packaging market is highly fragmented, owing to many domestic and international players. The market is fragmented, with the players competing in terms of price, product design, product innovation, etc. Some of the major players in the market are Amcor Ltd, Sealed Air Corporation, Tetra Pak International, Graham Packaging Company, Crown Holdings Incorporated, among others.
- July 2021 - Sealed Air Corporation has dedicated more than USD b30 million in capital to expand global production capacity and invest in new equipment systems to meet the accelerating demand for Automated Packaging Systems brand solutions. The investment is for capacity expansion, 'touchless' automation, and proprietary digital printing technologies, primarily in Streetsboro and Bedford Heights, Ohio, and Keyser, West Virginia, and will be completed in 2021.
- February 2021 - Tetra Pak introduced certified recycled polymers and became the first company in the food and beverage packaging industry to be awarded the Roundtable on Sustainable Biomaterials (RSB) Advanced Products certification. Its carton packages integrating attributed recycled polymers are now available for food and beverage manufacturers.
Additional Benefits:
- The market estimate (ME) sheet in Excel format
- 3 months of analyst support
TABLE OF CONTENTS
1 INTRODUCTION
- 1.1 Study Assumptions and Market Definition
- 1.2 Scope of the Study
2 RESEARCH METHODOLOGY
3 EXECUTIVE SUMMARY
4 MARKET INSIGHTS
- 4.1 Market Overview
- 4.2 Industry Value Chain Analysis
- 4.3 Industry Attractiveness - Porter's Five Forces Analysis
- 4.3.1 Bargaining Power of Suppliers
- 4.3.2 Bargaining Power of Buyers
- 4.3.3 Threat of New Entrants
- 4.3.4 Threat of Substitute Products
- 4.3.5 Intensity of Competitive Rivalry
- 4.4 Assessment of the Impact of COVID-19 on the market
5 MARKET DYNAMICS
- 5.1 Market Drivers
- 5.1.1 Growing Demand for Ready-to-use Drinks
- 5.1.2 Increased demand for convenience packaging from consumers
- 5.2 Market Restraints
- 5.2.1 Environmental concerns regarding usage of plastic
- 5.2.2 Stringent Government Regulations
6 MARKET SEGMENTATION
- 6.1 By Packaging Material Type
- 6.1.1 Plastic
- 6.1.2 Paper & Paperboard
- 6.1.3 Glass
- 6.1.4 Metal
- 6.1.5 Other Materials
- 6.2 By Product Type
- 6.2.1 Bottled Water
- 6.2.2 Carbonated Drinks
- 6.2.3 Juices
- 6.2.4 RTD Beverages
- 6.2.5 Sports Drink
- 6.2.6 Other Products
7 COMPETITIVE LANDSCAPE
- 7.1 Company Profiles
- 7.1.1 Crown Holdings Inc.
- 7.1.2 Amcor Ltd.
- 7.1.3 Tetra Pak International
- 7.1.4 Sealed Air Corporation
- 7.1.5 Graham Packaging Company
- 7.1.6 Ball Corporation
- 7.1.7 Placon Corporation
- 7.1.8 Toyo Seikan Group Holdings Ltd
- 7.1.9 WestRock Company
- 7.1.10 Owens-Illinois Inc.
- 7.1.11 Refresco Group NV
- 7.1.12 Ardagh Group SA
- 7.1.13 CAN-PACK S.A.
8 INVESTMENT ANALYSIS
9 FUTURE OUTLOOK OF THE MARKET
02-2729-4219
+886-2-2729-4219
 软性饮料包装市场-2026-2031年预测
 软性饮料包装市场(按包装材料、包装类型和最终用途行业)—2025-2032 年全球预测
 软性饮料包装:市场占有率分析、产业趋势与统计、成长预测(2025-2030)
 软性饮料包装市场机会、成长动力、产业趋势分析与预测 2025-2034中东和非洲软性饮料包装:市场占有率分析、产业趋势、成长预测(2025-2030)北美软性饮料包装:市场占有率分析、行业趋势和成长预测(2025-2030 年)拉丁美洲软性饮料包装:市场占有率分析、行业趋势和成长预测(2025-2030 年)欧洲软性饮料包装:市场占有率分析、产业趋势、成长预测(2025-2030)