


 |
市场调查报告书
商品编码
1939570
白色水泥:市场占有率分析、产业趋势与统计、成长预测(2026-2031)White Cement - Market Share Analysis, Industry Trends & Statistics, Growth Forecasts (2026 - 2031) |
||||||
※ 本网页内容可能与最新版本有所差异。详细情况请与我们联繫。
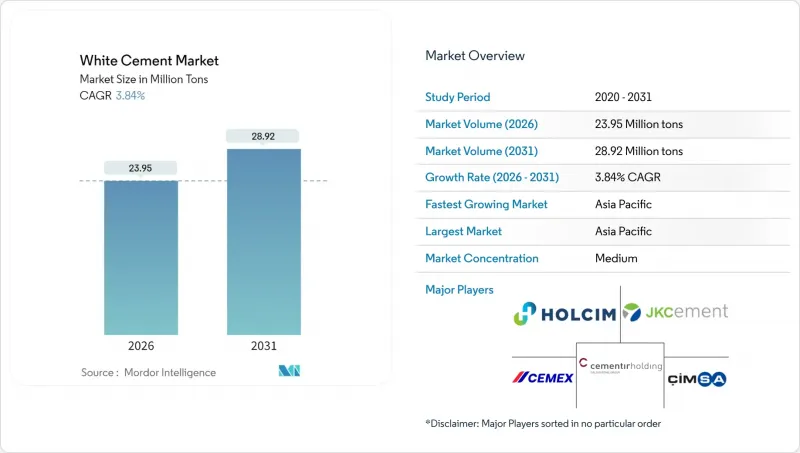
预计白水泥市场将从 2025 年的 2,306 万吨增长到 2026 年的 2,395 万吨,到 2031 年将达到 2,892 万吨,2026 年至 2031 年的复合年增长率为 3.84%。
高端建筑饰面、隔热屋顶系统以及亚太和中东地区大型计划的稳步推进,是推动需求成长的主要因素。高都市化、不断增长的可支配收入以及日益严格的绿色建筑标准,都进一步巩固了白水泥市场的成长动能。拥有专用白水泥窑的生产商拥有定价权,因为这些窑炉需要低铁原料,且生产过程能源密集,供应有限。竞争优势体现在优化产能、管理合适的石灰石供应链以及创新配方技术,以满足历史建筑修復和高性能结构的需求。
全球白水泥市场趋势与洞察
装饰和建筑领域的需求快速成长
在人口密集的城市中,建筑师偏好使用白色水泥,因为它外观均匀浅淡,能够有效区分高层住宅大楼和体验式零售综合体。不断上涨的都市区地价推动了人们对视觉效果独特的建筑的需求,进而促使建筑商对裸露的白色水泥产生需求,以降低外墙成本。此外,住宅对能够提升房产价值的优质材料的需求,也进一步推动了水磨石地板和GRC板材等室内装潢元素的发展。受印度大都会圈豪华住宅计划需求的推动,JK水泥公司2024年的装饰级产品销售量激增。市政法规提倡使用高太阳反射率的表面,这与私营部门的美学目标不谋而合,使得装饰性应用成为白色水泥市场需求的强劲驱动力。
亚太地区和中东的大型计划
沙乌地阿拉伯的NEOM新城、印度的智慧城市计画以及「一带一路」示范计划等旗舰计画均指定使用白水泥建造火车站、航站楼、桥樑和文化设施。设计指南强调减少眩光、提升热舒适度和持久的色彩稳定性—这些特性都得益于白水泥配方。阿联酋已拨款152亿美元用于2024年的公共基础设施建设,其中相当一部分将用于机场候机厅和地铁系统,这些设施需要浅色、耐污渍的饰面。为了缓解进口瓶颈,建筑商倾向于与区域生产商签订长期供应协议,从而将白水泥市场的供应週期远远延长至典型的建筑週期之外。这些大型企划也制定了品质标准,指导后续的地方政府和城市发展,使未来的需求量增加一倍。
与普通水泥相比,生产成本和能源成本更高。
白水泥窑炉需要维持更高的烧製温度,并且避免使用替代燃料来降低成本,因为这些燃料可能会影响颜色。水泥集团(Cementir Group)宣布,到2024年,能源成本将占白水泥生产成本的35%,而灰水泥的比例为28%。在欧洲,碳定价加剧了这一劣势,在电价上涨期间会进一步压低营运利润率。大型基础设施项目的公共采购通常以最低竞标为准,除非有热性能或外观方面的特殊要求,这限制了白水泥的普及。因此,短期盈利取决于对冲能源价格风险和优化余热回收系统。
细分市场分析
预计到2025年,I型水泥的产量将占总产量的51.63%,年复合成长率达3.96%,巩固了其作为装饰性建筑幕墙、水磨石和预製建筑构件基准等级的地位。其优异的可加工性和均衡的抗压强度简化了施工管理,并可实现结构柱、墙板和室内抹灰等单一材料的应用。透过添加聚合物添加剂改进混合工艺,I型水泥的应用范围已扩展至中等荷载桥面,蚕食了先前由II型水泥占据的市场。 JK水泥等製造商于2024年推出了新型I型水泥混合料,在不影响流动性的前提下提高了早期强度,从而稳步巩固了其市场领先地位。性能的持续提升增强了设计师的信心,并减少了替代材料的使用,进一步巩固了I型水泥在白水泥市场的地位。
II型水泥适用于硫酸盐耐受性、氯离子渗透性或高抗压强度超过I型阈值的严苛环境。虽然II型水泥在白水泥市场中所占份额较小,但在沿海工业厂、石化码头和海水淡化基础设施等领域却能获得溢价。沙乌地阿拉伯NEOM计划的管道文件描述了用于发电厂地基的客製化II型水泥混合料,显示其需求虽小但稳定。 「其他」类别(包括修復级、超高性能和3D列印配方)在2024年实现了最高的成长率。然而,专利申请量年增25%,显示特殊应用领域具有巨大的成长潜力,并可能在未来十年逐步重塑II型水泥的分类。
白水泥市场报告按类型(I型、II型、其他)、最终用途产业(商业、工业及公共、基础设施、住宅)和地区(亚太、北美、欧洲、南美、中东和非洲)进行细分。市场预测以吨为单位。
区域分析
亚太地区将占全球水泥消费量的近一半,到2025年将达到全球消费量的47.55%,预计到2031年将达到4.33%的最高区域复合年增长率。中国的水泥消费成长主要得益于高层建筑的持续建设以及省级政府推行的屋顶隔热措施。印度是仅次于中国的第二大水泥消费市场,其水泥消费正经历快速成长,这主要得益于智慧城市投资和联邦住宅计画。越南和泰国等东南亚市场则受惠于饭店和零售业资本投资的扩张,以及东协地区水泥分销物流成本的有利条件。
北美正经历稳定但低调的成长,主要得益于维修和历史建筑保护工作。在美国,建筑规范强制要求采用冷屋顶标准,推动了南部各州对白水泥的需求;而在加拿大,商业开发商正采用浅色外墙以满足节能标准。墨西哥则利用跨国供应链在美国阳光地带附近开发工业园区,确保供应稳定,不受汇率波动的影响。
在欧洲,建筑保护、修復和高端建筑饰面正日益受到青睐。能源成本和碳排放交易正在挤压利润空间,但可再生和高反射率材料的政策奖励在一定程度上抵消了这种影响。中东和非洲地区虽然绝对吨位小规模,但得益于NEOM新城、利雅德地铁延伸线和南非仓储中心等旗舰计划,正经历着强劲的发展势头。极端气候条件凸显了热反射率的优势,推动政府在公共资产规范中采用白水泥。南美洲是一个新兴但充满潜力的地区,尤其是在巴西,房地产融资中的永续性标准正在推动高反射率建筑幕墙的普及。阿根廷的商业办公大楼维修正在用白水泥覆层改造20世纪70年代的建筑,这凸显了在宏观经济波动中,整个大陆都在向高端材料转型。
其他福利:
- Excel格式的市场预测(ME)表
- 3个月的分析师支持
目录
第一章 引言
- 研究假设和市场定义
- 调查范围
第二章调查方法
第三章执行摘要
第四章 市场情势
- 市场概览
- 市场驱动因素
- 装饰和建筑水泥的需求迅速增长
- 亚太地区、中东和非洲的大型计划
- 炎热气候下对隔热屋顶材料的需求
- 文物修復中的优质化
- 低碳白PLC
- 电子商务在DIY领域的渗透
- 市场限制
- 与普通水泥相比,生产成本和能源成本更高。
- 低铁原料短缺
- 替代燃料和水泥外加剂的颜色限制
- 价值链分析
- 监管环境
- 波特五力模型
- 供应商的议价能力
- 买方的议价能力
- 新进入者的威胁
- 替代品的威胁
- 竞争对手之间的竞争
第五章 市场规模与成长预测
- 按类型
- 一型
- II 型
- 其他的
- 按最终用途
- 商业的
- 工业和公共设施
- 基础设施
- 住宅
- 按地区
- 亚太地区
- 中国
- 印度
- 日本
- 韩国
- 澳洲
- 印尼
- 泰国
- 越南
- 亚太其他地区
- 北美洲
- 我们
- 加拿大
- 墨西哥
- 欧洲
- 德国
- 法国
- 义大利
- 西班牙
- 英国
- 俄罗斯
- 其他欧洲地区
- 南美洲
- 巴西
- 阿根廷
- 其他南美洲
- 中东和非洲
- 沙乌地阿拉伯
- 阿拉伯聯合大公国
- 其他中东和非洲地区
- 亚太地区
第六章 竞争情势
- 市场集中度
- 策略趋势
- 市占率(%)/排名分析
- 公司简介
- Buzzi Unicem SpA
- Cementir Holding NV
- Cementos Portland Valderrivas
- CEMEX SAB de CV
- Cimsa Cimento
- Federal White Cement
- HOLCIM
- Jiangxi Yinshan White Cement Co., Ltd.
- JK Cement Ltd.
- OYAK Cimento
- Riyadh Cement Co.
- Royal White Cement, Inc.
- Saudi White Cement Co.
- SCG Cement-Building Materials
- UltraTech Cement Ltd.
第七章 市场机会与未来展望
第八章:CEO们需要思考的关键策略问题
The White Cement market is expected to grow from 23.06 million tons in 2025 to 23.95 million tons in 2026 and is forecast to reach 28.92 million tons by 2031 at 3.84% CAGR over 2026-2031.
Demand acceleration flows from premium architectural finishes, heat-reflective roofing systems, and a steady pipeline of infrastructure mega-projects across Asia-Pacific and the Middle East. High urbanization rates, rising disposable incomes, and stricter green-building codes collectively reinforce the growth path of the white cement market. Producers with dedicated white cement kilns enjoy pricing power because the product requires low-iron raw materials and operates under energy-intensive conditions that restrict supply. Competitive differentiation centers on capacity optimization, supply-chain control of suitable limestone, and formulation innovation aimed at meeting heritage-restoration and high-performance structural requirements.
Global White Cement Market Trends and Insights
Decorative and Architectural Construction Surge
Architects specify white cement to create uniform, light-toned facades that differentiate high-rise residential towers and experiential retail complexes in densely populated cities. Rising urban land prices intensify the need for visually distinctive buildings, pushing contractors toward exposed white concrete that eliminates cladding costs. Decorative interior elements such as terrazzo floors and GRC panels further magnify volume uptake, as homeowners pursue premium materials that elevate property value. JK Cement recorded a jump in decorative-grade sales in 2024, fueled by metropolitan India's luxury housing projects. Municipal regulations that promote higher solar-reflectance surfaces dovetail with private-sector aesthetic goals, making decorative usage a resilient demand pillar for the white cement market.
Infrastructure Mega-Projects in Asia-Pacific and Middle East
Flagship undertakings such as Saudi Arabia's NEOM city, India's Smart Cities Mission, and Belt and Road showcase projects specify white cement for stations, terminals, bridges, and cultural landmarks. Design guidelines emphasize glare reduction, thermal comfort, and enduring color stability-attributes amplified in white cement formulations. The UAE allocated USD 15.2 billion to public-sector infrastructure in 2024, channeling a sizable share toward airport concourses and metro systems that require bright, stain-resistant finishes. Contractors favor long-term supply agreements with regional producers to mitigate import bottlenecks, extending the visibility of the white cement market pipeline well beyond typical building cycles. These mega-projects also set quality benchmarks that govern subsequent provincial and municipal developments, multiplying forward demand.
High Production and Energy Costs Compared with Grey Cement
Specialized kilns for white cement maintain higher firing temperatures and reject cost-saving alternative fuels that might contaminate color. Cementir Group disclosed that energy accounted for 35% of its white cement production expenditure in 2024, compared to 28% for grey cement. Carbon-pricing schemes compound the disadvantage in Europe, pushing operating margins downward during periods of electricity inflation. Public procurement for large-scale infrastructure often awards contracts to the lowest bidder, limiting the adoption of white cement unless thermal or visual criteria require it. Short-term profitability, therefore, hinges on hedging energy exposure and optimizing waste-heat recovery systems.
Other drivers and restraints analyzed in the detailed report include:
- Heat-Reflective Roofing Demand in Hot Climates
- Heritage Restoration Premiumization
- Scarcity of Low-Iron Raw Materials
For complete list of drivers and restraints, kindly check the Table Of Contents.
Segment Analysis
Type I generated 51.63% of 2025 output and is forecast to accelerate at a 3.96% CAGR, underscoring its role as the baseline grade across ornamental facades, terrazzo, and architectural precast elements. High workability and balanced compressive-strength trajectories simplify contractor logistics, allowing a single inventory item to span structural columns, wall panels, and interior plasters. Upgrading mixes with polymeric additives has expanded their applicability to medium-load bridge decks, encroaching on the territory once held by Type II. Manufacturers such as JK Cement introduced a new Type I blend in 2024, demonstrating higher early strength without sacrificing flow properties, marking an iterative progression that maintains market leadership. Continuous performance gains reinforce specifier confidence and discourage substitution, cementing Type I's franchise in the white cement market.
Type II addresses aggressive environments where sulfate resistance, chloride permeability, or elevated compressive strength surpass Type I thresholds. Though representing a smaller slice of the white cement market, Type II secures premium pricing from coastal industrial plants, petrochemical docks, and desalination infrastructure. Pipeline documents for Saudi Arabia's NEOM include tailored Type II mixes for power-block foundations, indicating niche but sticky demand. The "Others" category, encompassing restoration-grade, ultra-high-performance, and 3D-printing formulations, logged the fastest percentage growth in 2024. Nevertheless, patent activity surged 25% year-over-year, suggesting a long runway for specialized applications that could incrementally reshape type segmentation over the next decade.
The White Cement Market Report is Segmented by Type (Type I, Type II, and Others), End-Use Sector (Commercial, Industrial and Institutional, Infrastructure, and Residential), and Geography (Asia-Pacific, North America, Europe, South America, and Middle-East and Africa). The Market Forecasts are Provided in Terms of Volume (Tons).
Geography Analysis
The Asia-Pacific region anchors nearly half of the global volume, reflecting a 47.55% share in 2025 and delivering the top regional CAGR of 4.33% through 2031. China's consumption is driven by continuous high-rise construction and provincial mandates on cool roofing. India trails but grows faster due to smart city investments and federal housing programs; Southeast Asian markets, such as Vietnam and Thailand, ride the upcycle in hospitality and retail capital expenditures, aided by favorable logistics costs for intra-ASEAN cement flows.
North America contributes steady, if less spectacular, gains, concentrated in renovation and heritage-preservation activities. U.S. building codes referencing cool-roof standards bolster demand for white cement in southern states, while Canadian commercial developers adopt light-colored facades for energy code compliance. Mexico taps cross-border supply chains to fuel industrial parks near the U.S. Sun Belt, ensuring stable inflows despite currency volatility.
Europe emphasizes conservation and premium architectural veneers. Energy costs and carbon trading pinch margins, yet policy incentives for recyclable, high-albedo materials provide partial offsets. The Middle East and Africa, though smaller in absolute tonnage, display robust momentum linked to flagship projects such as NEOM, Riyadh metro extensions, and South African warehouse hubs. Extreme climate amplifies thermal-reflectance advantages, nudging government specifications toward white cement for public-domain assets. South America remains nascent but promising, especially in Brazil where sustainability criteria in real-estate financing encourage the adoption of high-reflectance facades. Argentina's commercial-office refurbishments also integrate white cement cladding to modernize 1970s-era buildings, highlighting a continental shift toward premium materials even amid macroeconomic flux.
- Buzzi Unicem S.p.A.
- Cementir Holding N.V.
- Cementos Portland Valderrivas
- CEMEX S.A.B. de C.V.
- Cimsa Cimento
- Federal White Cement
- HOLCIM
- Jiangxi Yinshan White Cement Co., Ltd.
- JK Cement Ltd.
- OYAK Cimento
- Riyadh Cement Co.
- Royal White Cement, Inc.
- Saudi White Cement Co.
- SCG Cement-Building Materials
- UltraTech Cement Ltd.
Additional Benefits:
- The market estimate (ME) sheet in Excel format
- 3 months of analyst support
TABLE OF CONTENTS
1 Introduction
- 1.1 Study Assumptions and Market Definition
- 1.2 Scope of the Study
2 Research Methodology
3 Executive Summary
4 Market Landscape
- 4.1 Market Overview
- 4.2 Market Drivers
- 4.2.1 Decorative and architectural construction surge
- 4.2.2 Infrastructure mega-projects in the Asia-Pacific and the Middle East, and African countries
- 4.2.3 Heat-reflective roofing demand in hot climates
- 4.2.4 Heritage restoration premiumization
- 4.2.5 Low-carbon white PLC adoption
- 4.2.6 E-commerce penetration in DIY segment
- 4.3 Market Restraints
- 4.3.1 High production and energy costs compared to grey cement
- 4.3.2 Scarcity of low-iron raw materials
- 4.3.3 Colour constraints on alternative fuels and SCMs
- 4.4 Value Chain Analysis
- 4.5 Regulatory Landscape
- 4.6 Porter's Five Forces
- 4.6.1 Bargaining Power of Suppliers
- 4.6.2 Bargaining Power of Buyers
- 4.6.3 Threat of New Entrants
- 4.6.4 Threat of Substitutes
- 4.6.5 Competitive Rivalry
5 Market Size and Growth Forecasts (Volume)
- 5.1 By Type
- 5.1.1 Type I
- 5.1.2 Type II
- 5.1.3 Others
- 5.2 By End-Use Sector
- 5.2.1 Commercial
- 5.2.2 Industrial and Institutional
- 5.2.3 Infrastructure
- 5.2.4 Residential
- 5.3 By Geography
- 5.3.1 Asia-Pacific
- 5.3.1.1 China
- 5.3.1.2 India
- 5.3.1.3 Japan
- 5.3.1.4 South Korea
- 5.3.1.5 Australia
- 5.3.1.6 Indonesia
- 5.3.1.7 Thailand
- 5.3.1.8 Vietnam
- 5.3.1.9 Rest of Asia-Pacific
- 5.3.2 North America
- 5.3.2.1 United States
- 5.3.2.2 Canada
- 5.3.2.3 Mexico
- 5.3.3 Europe
- 5.3.3.1 Germany
- 5.3.3.2 France
- 5.3.3.3 Italy
- 5.3.3.4 Spain
- 5.3.3.5 United Kingdom
- 5.3.3.6 Russia
- 5.3.3.7 Rest of Europe
- 5.3.4 South America
- 5.3.4.1 Brazil
- 5.3.4.2 Argentina
- 5.3.4.3 Rest of South America
- 5.3.5 Middle-East and Africa
- 5.3.5.1 Saudi Arabia
- 5.3.5.2 United Arab Emirates
- 5.3.5.3 Rest of Middle-East and Africa
- 5.3.1 Asia-Pacific
6 Competitive Landscape
- 6.1 Market Concentration
- 6.2 Strategic Moves
- 6.3 Market Share(%)/Ranking Analysis
- 6.4 Company Profiles (includes Global level Overview, Market level overview, Core Segments, Financials as available, Strategic Information, Market Rank/Share for key companies, Products and Services, and Recent Developments)
- 6.4.1 Buzzi Unicem S.p.A.
- 6.4.2 Cementir Holding N.V.
- 6.4.3 Cementos Portland Valderrivas
- 6.4.4 CEMEX S.A.B. de C.V.
- 6.4.5 Cimsa Cimento
- 6.4.6 Federal White Cement
- 6.4.7 HOLCIM
- 6.4.8 Jiangxi Yinshan White Cement Co., Ltd.
- 6.4.9 JK Cement Ltd.
- 6.4.10 OYAK Cimento
- 6.4.11 Riyadh Cement Co.
- 6.4.12 Royal White Cement, Inc.
- 6.4.13 Saudi White Cement Co.
- 6.4.14 SCG Cement-Building Materials
- 6.4.15 UltraTech Cement Ltd.
7 Market Opportunities and Future Outlook
- 7.1 White-space and Unmet-need Assessment
8 Key Strategic Questions for Cement CEOs
 亚太地区白水泥:市占率分析、产业趋势与统计、成长预测(2026-2031年)
 全球白水泥市场规模、份额、趋势和成长分析报告(2026-2034年)
 日本白水泥市场规模、份额、趋势和预测:按类型、应用和地区划分,2026-2034年
 2026年全球白水泥市场报告
 白水泥市场按产品类型、应用、最终用户和销售管道划分-2025-2032年全球预测2025-2033年白水泥市场规模、份额、趋势及预测(按类型、应用和地区)
 白水泥市场机会、成长动力、产业趋势分析及2025-2034年预测
 白水泥市场规模、份额、趋势分析报告:按产品、按应用、按地区、细分市场预测,2025-2030
 全球白水泥市场2024-2028