


 |
市场调查报告书
商品编码
1683175
LNG 市场:市场占有率分析、产业趋势与统计、成长预测(2025-2030 年)LNG - Market Share Analysis, Industry Trends & Statistics, Growth Forecasts (2025 - 2030) |
||||||
价格
※ 本网页内容可能与最新版本有所差异。详细情况请与我们联繫。
简介目录
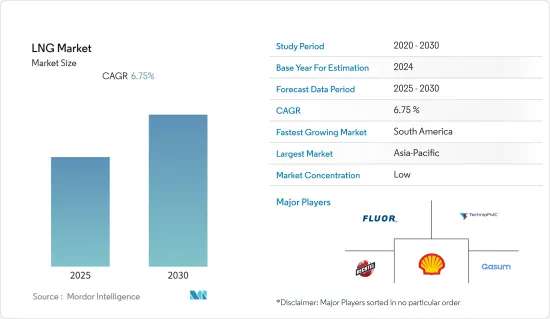
预测期内,液化天然气市场预计将以 6.75% 的复合年增长率成长。
2020年,新冠疫情对市场产生了负面影响。目前市场已恢復至疫情前的水准。
关键亮点
- 从中期来看,预计天然气发电需求增加和液化天然气燃料船舶数量增加等因素将在预测期内推动全球液化天然气市场的发展。
- 另一方面,预计预测期内液化天然气供应过剩和贸易紧张局势将阻碍市场成长。
- 液化天然气市场是一个新兴市场,因为对液化天然气的需求不断增长,预计未来几年将提案许多液化天然气计划和发展计划,为非洲地区的市场相关人员创造许多机会。
液化天然气(LNG)市场趋势
液化行业占据市场主导地位
- 过去十年,工业化和都市化进程大幅加快,导致全球二氧化碳和温室气体排放量激增。因此,为了减少二氧化碳和温室气体的排放,世界各国政府都在推动使用天然气作为发电和汽车的燃料。
- 因此,世界各国政府正在製定各种支持措施,鼓励CNG和LNG燃料汽车的普及,包括对汽车製造商和消费者提供补贴和免税。
- 过去十年,由于各地区需求不断成长,全球天然气消费量不断增加。例如,2012年的天然气消费量约为3,3,194亿立方米,但到2021年将增加21%以上至4,3,750亿立方米。
- 根据《2022年全球液化天然气报告》,液化天然气连接40个进口国和19个出口市场。 2021年全球液化量将从上年的2,000万吨/年增加690万吨/年,达到4.599亿吨/年。非洲巨大的液化天然气潜力对该地区的发展至关重要,目前有 1.239 亿吨/年的液化天然气提案正在等待最终投资决定(FID)。
- 此外,PFLNG Dua(1.5 MTPA)、Corpus Christi T3(4.5 MTPA)和 Yamal LNG T4(0.9 MTPA)是于 2021 年投入运作的液化计划。 2022 年头四个月又增加了 12.5 MTPA 的液化能力,使全球液化总合能力增至 472.4 MTPA。因此,预计液化能力的增加和液化计划的建立将在预测期内产生对液化行业的需求。
- 因此,基于上述因素,预计液化部门将在预测期内主导液化天然气市场。
亚太地区占市场主导地位
- 亚太地区仍然是主要的进口地区,其在全球液化天然气进口中的份额从去年的 72% 增加到 2019 年的 69%。去年亚洲液化天然气进口量成长7.7%,达3,718亿立方公尺。除日本、印度、马来西亚和新加坡外,所有亚太国家的进口均增加。
- 根据《2022 年全球液化天然气报告》,最大的出口地区仍是亚太地区,去年出口总合1.312 亿吨,与 2020 年出口量持平。
- 中国是亚太地区最大的液化天然气进口国,进口量增幅最大,较去年同期成长16.8%,去年进口量达1,095亿立方公尺。此外,世界各国政府都推出了支持天然气消费的政策,其中包括多个液化天然气计划。
- 此外,江苏华电燕崖液化LNG接收站将于 2023 年 2 月在中国东部江苏省利安克莱尔市燕崖港开工。该计划被纳入国家天然气发展规划和能源部「十四五」规划,设计液化天然气接收能力为300万吨/年。该计划是联邦政府核准的2022年四个液化天然气接收计划之一,总接收量约为每年2,400万吨。
- 因此,由于上述因素,预计亚太地区将在预测期内主导全球液化天然气市场。
液化天然气(LNG)产业概况
液化天然气市场是细分的。主要参与企业(不分先后顺序)包括 Fluor Corporation、TechnipFMC PLC、Bechtel Corporation、Shell PLC 和 Gasum AS。
其他福利
- Excel 格式的市场预测 (ME) 表
- 3 个月的分析师支持
目录
第 1 章 简介
- 研究范围
- 市场定义
- 调查前提
第 2 章执行摘要
第三章调查方法
第四章 市场概况
- 介绍
- 2028 年市场规模与需求预测(十亿美元)
- 最新趋势和发展
- 政府法规和政策
- 市场动态
- 驱动程式
- 限制因素
- 供应链分析
- 产业吸引力-波特五力分析
- 供应商的议价能力
- 消费者议价能力
- 新进入者的威胁
- 替代品的威胁
- 竞争对手之间的竞争强度
第五章 市场区隔
- 液化天然气基础设施
- LNG液化工厂
- LNG 再气化设施
- 液化天然气运输
- 液化天然气贸易
- 地区
- 北美洲
- 美国
- 加拿大
- 墨西哥
- 北美其他地区
- 欧洲
- 德国
- 英国
- 法国
- 欧洲其他地区
- 亚太地区
- 中国
- 韩国
- 日本
- 其他亚太地区
- 南美洲
- 巴西
- 阿根廷
- 南美洲其他地区
- 中东和非洲
- 阿拉伯聯合大公国
- 沙乌地阿拉伯
- 其他中东和非洲地区
- 北美洲
第六章 竞争格局
- 併购、合资、合作、协议
- 主要企业策略
- 公司简介
- LNG基础设施公司(营运商和EPC公司)
- JGC Holdings Corporation
- Chiyoda Corporation
- Bechtel Corporation
- Technip FMC PLC
- Fluor Corporation
- LNG燃料库公司和公司
- Shell PLC
- Gasum AS
- ENN Energy Holdings Ltd.
- Engie SA
- Gazpromneft Marine Bunker LLC
- LNG基础设施公司(营运商和EPC公司)
第七章 市场机会与未来趋势
简介目录
Product Code: 57149
The LNG Market is expected to register a CAGR of 6.75% during the forecast period.
In 2020, COVID-19 had a detrimental effect on the market. Presently, the market has reached pre-pandemic levels.
Key Highlights
- Over the medium term, factors such as increasing demand for gas power generation and a rising number of LNG-fueled fleets are expected to drive the global LNG market during the forecast period.
- On the other hand, LNG oversupply and trade tension are expected to hamper market growth during the forecast period.
- Nevertheless, a high number of LNG projects and development plans are expected to be proposed in the upcoming years, underpinned by the growing LNG demand, leading to the creation of several opportunities for market players in the African region, thus creating an emerging LNG market.
Liquefied Natural Gas (LNG) Market Trends
Liquefaction Sector to Dominate the Market
- In the last decade, there has been a significant rise in industrialization and urbanization, which has resulted in a surge in carbon dioxide and greenhouse gases worldwide. Thus, to reduce carbon and greenhouse gas emissions, governments are promoting the utilization of natural gas in power generation and fuel in vehicles.
- Thus, governments are developing various supportive policies to increase the adoption of CNG and LNG-based vehicles, including providing subsidies and tax exemptions to automobile manufacturers and consumers.
- The growing demand for natural gas across the regions resulted in increased natural gas consumption in the last decade across the globe. For instance, in 2012, natural gas consumption was around 3,319.4 billion cubic meters, which increased by more than 21% in 2021 to about 4,037.5 billion cubic meters.
- According to the World LNG Report 2022, LNG connected 40 importing countries with 19 export markets. The global liquefaction capacity accounted for 459.9 MTPA in 2021 after adding 6.9 MTPA, compared to 20 MTPA the year prior. The great potential for LNG in Africa is significant to the region's development, with 123.9 MTPA of proposed liquefaction waiting for the final investment decision (FID).
- Additionally, PFLNG Dua (1.5 MTPA), Corpus Christi T3 (4.5 MTPA), and Yamal LNG T4 (0.9 MTPA) were the liquefaction projects that came online in 2021. During the first four months of 2022, an additional 12.5 MTPA of liquefaction capacity was added, increasing the total global liquefaction capacity to 472.4 MTPA. Thus, the increasing liquefaction capacity, as well as the establishment of liquefaction projects, are expected to create demand for the liquefaction sector in the forecast period.
- Therefore, based on the above-mentioned factors, the liquefaction sector is expected to dominate the LNG market during the forecast period.
Asia-Pacific to Dominate the Market
- Asia-Pacific continued to be the leading importing region, with a 72% share of global LNG imports last year, up from 69% in 2019. Asian LNG imports grew by 7.7% last year, reaching 371.8 billion cubic meters. Imports rose in all Asia-Pacific countries except Japan, India, Malaysia, and Singapore.
- According to the World LNG Report 2022, the largest exporting region continued to be Asia-Pacific, with a total of 131.2 MT of exports last year, in line with what was exported in 2020.
- China, being the largest LNG importer in Asia-Pacific, experienced the greatest growth in terms of imported volumes, with an annual growth rate of 16.8%, accounting for 109.5 billion cubic meters last year. Additionally, governments also adopted supportive policies for natural gas consumption, which include several LNG projects.
- Furthermore, in February 2023, Jiangsu Huadian Ganyu LNG terminal construction began at Ganyu port in Lianyungang, China's eastern Jiangsu province. The project is included in both the national natural gas development plan and the province's 14th Five-Year Plan, with a designed LNG receiving capacity of 3 million mt/year. The project is one of four LNG-receiving projects approved by the federal government for 2022, with a total capacity of almost 24 million metric tons per year.
- Therefore, based on the above-mentioned factors, Asia-Pacific is expected to dominate the global LNG market during the forecast period.
Liquefied Natural Gas (LNG) Industry Overview
The LNG market is fragmented. Some of the major players (not in a particular order) include Fluor Corporation, TechnipFMC PLC, Bechtel Corporation, Shell PLC, and Gasum AS.
Additional Benefits:
- The market estimate (ME) sheet in Excel format
- 3 months of analyst support
TABLE OF CONTENTS
1 INTRODUCTION
- 1.1 Scope of the Study
- 1.2 Market Definition
- 1.3 Study Assumptions
2 EXECUTIVE SUMMARY
3 RESEARCH METHODOLOGY
4 MARKET OVERVIEW
- 4.1 Introduction
- 4.2 Market Size and Demand Forecast in USD billion, till 2028
- 4.3 Recent Trends and Developments
- 4.4 Government Policies and Regulations
- 4.5 Market Dynamics
- 4.5.1 Drivers
- 4.5.2 Restraints
- 4.6 Supply Chain Analysis
- 4.7 Industry Attractiveness - Porter's Five Forces Analysis
- 4.7.1 Bargaining Power of Suppliers
- 4.7.2 Bargaining Power of Consumers
- 4.7.3 Threat of New Entrants
- 4.7.4 Threat of Substitute Products and Services
- 4.7.5 Intensity of Competitive Rivalry
5 MARKET SEGMENTATION
- 5.1 LNG Infrastructure
- 5.1.1 LNG Liquefaction Plants
- 5.1.2 LNG Regasification Facilities
- 5.1.3 LNG Shipping
- 5.2 LNG Trade
- 5.3 Geography
- 5.3.1 North America
- 5.3.1.1 United States
- 5.3.1.2 Canada
- 5.3.1.3 Mexico
- 5.3.1.4 Rest of the North America
- 5.3.2 Europe
- 5.3.2.1 Germany
- 5.3.2.2 United Kingdom
- 5.3.2.3 France
- 5.3.2.4 Rest of the Europe
- 5.3.3 Asia-Pacific
- 5.3.3.1 China
- 5.3.3.2 South Korea
- 5.3.3.3 Japan
- 5.3.3.4 Rest of the Asia-Pacific
- 5.3.4 South America
- 5.3.4.1 Brazil
- 5.3.4.2 Argentina
- 5.3.4.3 Rest of the South America
- 5.3.5 Middle-East and Africa
- 5.3.5.1 United Arab Emirates
- 5.3.5.2 Saudi Arabia
- 5.3.5.3 Rest of the Middle-East and Africa
- 5.3.1 North America
6 COMPETITIVE LANDSCAPE
- 6.1 Mergers and Acquisitions, Joint Ventures, Collaborations, and Agreements
- 6.2 Strategies Adopted by Leading Players
- 6.3 Company Profiles
- 6.3.1 LNG Infrastructure Companies (Operators and EPC Companies)
- 6.3.1.1 JGC Holdings Corporation
- 6.3.1.2 Chiyoda Corporation
- 6.3.1.3 Bechtel Corporation
- 6.3.1.4 Technip FMC PLC
- 6.3.1.5 Fluor Corporation
- 6.3.2 LNG Bunkering and Trading Companies
- 6.3.2.1 Shell PLC
- 6.3.2.2 Gasum AS
- 6.3.2.3 ENN Energy Holdings Ltd.
- 6.3.2.4 Engie SA
- 6.3.2.5 Gazpromneft Marine Bunker LLC
- 6.3.1 LNG Infrastructure Companies (Operators and EPC Companies)
7 MARKET OPPORTUNITIES AND FUTURE TRENDS
02-2729-4219
+886-2-2729-4219
 液化天然气市场(按基础设施、液化天然气类型、应用和分销管道)—2025-2030 年全球预测
 2025年液化天然气(LNG)基础设施全球市场报告
 C型罐的全球市场全球车用液化天然气市场
 2032 年液化天然气压缩机市场预测:按压缩机类型、冷却方式、容量、技术、应用、最终用户和地区进行的全球分析全球液化天然气卡车市场2025年液化天然气全球市场报告2025年液化天然气压缩机全球市场报告
 计画中的液化天然气市场-全球产业规模、份额、趋势、机会和预测,按技术(液化、再气化)、应用(住宅、商业、工业)、地区和竞争细分,2020-2030 年预测2025年全球工业液化天然气(LNG)汽化器市场报告
▼